Biofuels - Market Share Analysis, Industry Trends & Statistics, Growth Forecasts (2026 - 2031)
バイオ燃料市場レポートは、燃料タイプ(バイオエタノール、バイオディーゼル、再生可能ディーゼルなど)、世代(第一世代、第三世代など)、原料(砂糖作物、デンプン作物、藻類など)、技術(発酵、エステル交換、水素化処理など)、最終用途(道路輸送、航空、海洋、発電および暖房)、および地域(北米、ヨーロッパ、アジア太平洋など)別にセグメント化されています。
The Biofuels Market Report is Segmented by Fuel Type (Bioethanol, Biodiesel, Renewable Diesel, and More), Generation (First-Generation, Third-Generation, and More), Feedstock (Sugar Crops, Starch Crops, Algae, and More), Technology (Fermentation, Trans-Esterification, Hydrotreatmen, and More), End-Use (Road Transport, Aviation, Marine, and Power Generation and Heating), and Geography (North America, Europe, Asia-Pacific, and More).
| 出版 | Mordor Intelligence |
| 出版年月 | 2026年02月 |
| ページ数 | 125 |
| 価格 | 記載以外のライセンスについてはお問合せください |
| シングルユーザ | USD 4,750 |
| 種別 | 英文調査報告書 |
| 商品番号 | SMR-1345813458 |

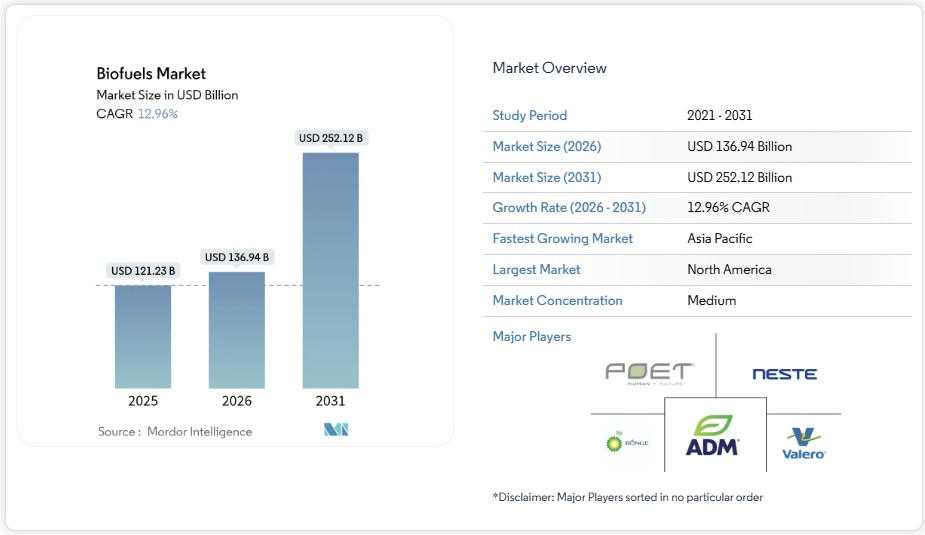
バイオ燃料市場は、2025年の1,212.3億米ドルから2026年には1,369.4億米ドルに成長すると予想されており、2026年から2031年にかけて年平均成長率12.96%で成長し、2031年には2,521.2億米ドルに達すると予測されています。
運輸、特に航空分野における脱炭素化義務の高まりと、石油メジャーによる大規模な投資は、導入障壁を緩和する生産能力の増強を促進しています。第一世代の作物由来燃料から廃棄物由来燃料や合成生物学ソリューションへの技術の急速な移行は、ライフサイクル排出量の改善と原料リスクの低減につながっています。同時に、北米における政府の税額控除とアジアにおける混合義務化は、生産者にとって価格安定につながる長期オフテイク契約を促進しています。大手石油会社が発表した43件の製油所転換およびグリーンフィールドプロジェクトにより、2030年までに数百万トン規模の生産能力が追加され、サプライチェーンの再構築と再生可能燃料と化石燃料のコスト格差の縮小が見込まれるため、競争は激化しています。
Biofuels Market Analysis
The Biofuels market is expected to grow from USD 121.23 billion in 2025 to USD 136.94 billion in 2026 and is forecast to reach USD 252.12 billion by 2031 at 12.96% CAGR over 2026-2031.
Growing decarbonization mandates in transportation, especially aviation, and scaled investments from oil majors are driving capacity additions that ease adoption barriers. Rapid shifts in technology from first-generation crop-based fuels toward waste-derived and synthetic biology solutions are improving life-cycle emissions and reducing feedstock risk. At the same time, government tax credits in North America and blending mandates in Asia are prompting long-term offtake contracts that stabilize prices for producers. Competitive intensity is rising because 43 refinery conversion and greenfield projects announced by leading petroleum companies will add multimillion-ton capacity before 2030, reshaping supply chains and narrowing cost gaps between renewable and fossil fuels.
Global Biofuels Market Trends and Insights
Transport-sector blend mandates intensifying in Asia & South America
Asian and South American governments are implementing higher blending requirements, which are reshaping feedstock allocation and production footprints. Indonesia’s B40 program alone lifts biodiesel consumption to 13.15 million kiloliters annually, cutting diesel imports and saving USD 9 billion in foreign exchange. India is fast-tracking its move to 20% ethanol blending by 2025, which drives parallel investment in distillation and logistics assets. Similar policies in the Philippines and Thailand add regional momentum, while Brazil keeps its long-standing ethanol platform. These mandates support rural incomes, curb crude import bills, and establish predictable demand that de-risks plant expansions. Together, they underpin the steep growth outlook for the global biofuels market.
Net-zero-aligned corporate PPAs driving renewable diesel demand in North America
Major logistics and retail brands now sign multiyear purchase agreements that guarantee low-carbon fuel supply beyond regulatory minimums. DHL Group intends to source 300,000 tons of SAF annually by 2030 under a partnership with Neste . California’s Low Carbon Fuel Standard enables participating firms to monetize greenhouse-gas credits, which are often valued above the physical fuel price, thereby further sweetening long-term economics. These corporate commitments provide producers with clearer revenue visibility, enabling them to secure debt financing for new hydrotreatment units across the United States and Canada.
Volatile Feedstock Prices (Soy, Rapeseed, UCO) Squeezing Producer Margins
Soybean oil, used cooking oil, and tallow prices swung 40–60% during 2024, eroding margins and complicating hedge strategies for refiners. Fraud-related disruptions in European waste-oil imports inflated prices while creating challenges to traceability. Producers are countering volatility by diversifying into residues such as forestry waste and municipal sludges, although preprocessing adds capital cost and complexity. Near-term profitability, therefore, depends on agile feedstock portfolios and robust credit markets that offset commodity swings.
Other drivers and restraints analyzed in the detailed report include:
- SAF tax incentives in the EU & U.S. Inflation Reduction Act
- Palm feedstock phase-out prompting algae & waste-oil investment in Europe
- Infrastructure bottlenecks in collecting agri-residues in India & Indonesia
For complete list of drivers and restraints, kindly check the Table Of Contents.
Segment Analysis
Sustainable aviation fuel volumes scale from a small base at a 34.98% CAGR, reflecting airlines’ need for immediate emissions cuts and supportive mandates. Bioethanol retains the lion’s share because it is entrenched in U.S. E10 and Brazilian E27 blends. Yet hydrotreatment’s ability to co-produce SAF, renewable diesel, and bio-naphtha is shifting capital toward drop-in molecules that fit existing pipelines.
Second-generation biodiesel is plateauing because of compatibility issues with newer engine systems in cold climates. In contrast, renewable diesel gains market share thanks to its superior cetane numbers and parity with fossil diesel in terms of infrastructure. High-value co-products such as bio-propane further enhance project economics. The global biofuels market is therefore shifting toward fuels with cross-sector appeal and higher carbon credit valuation.
First-generation fuels still account for 67.62% of sales, driven primarily by sugarcane ethanol in Brazil and corn ethanol in the United States. The global biofuels market size for first-generation pathways is expected to rise modestly; however, the relative share will decline as advanced options scale. Third-generation algae projects now demonstrate 15.92% CAGR after genetics and photobioreactor advances cut production costs by double digits.
Recent university studies show that engineered microalgae can convert 85% of waste oil into lipids suitable for hydrotreatment, thereby reducing land-use concerns. Second-generation cellulosic facilities, such as LanzaJet’s ethanol-to-SAF plant, are finally hitting commercial throughput and proving enzyme efficiency gains. Fourth-generation synthetic biology remains pre-commercial but attracts venture funding because it promises direct fuel synthesis from captured CO2.
The Biofuels Market Report is Segmented by Fuel Type (Bioethanol, Biodiesel, Renewable Diesel, and More), Generation (First-Generation, Third-Generation, and More), Feedstock (Sugar Crops, Starch Crops, Algae, and More), Technology (Fermentation, Trans-Esterification, Hydrotreatmen, and More), End-Use (Road Transport, Aviation, Marine, and Power Generation and Heating), and Geography (North America, Europe, Asia-Pacific, and More).
Geography Analysis
North America is expected to control 42.56% of the global biofuels market in 2025, driven by mature corn ethanol plants, the growth of soybean oil-based renewable diesel, and generous tax credits. Installed renewable diesel capacity doubles to 5.2 billion gallons by 2025, and California’s LCFS consumes nearly the entire domestic pool, creating a stable price floor. The region’s policy clarity enables producers to secure financing quickly, while robust grain handling infrastructure ensures a stable feedstock flow. Mexico’s recent mandate extensions and Canada’s clean fuel regulations further enlarge regional demand.
Europe is transforming as the Renewable Energy Directive III sets a 42.5% renewable energy target by 2030 and phases out the use of palm oil feedstocks. Germany banned carry-over of prior-year greenhouse-gas certificates starting in 2025, forcing obligated parties to purchase more advanced biofuels immediately. Anti-dumping duties on Chinese biodiesel reroute trade and raise premiums for domestic HVO, encouraging local capacity additions. The complex policy mix fosters technological innovation while keeping volume growth moderate due to feedstock constraints.
Asia-Pacific posts the highest regional CAGR at 16.78%. Indonesia’s B40 mandate absorbs 13.15 million kiloliters of biodiesel annually and saves USD 15 billion in foreign exchange, while supporting the incomes of smallholder palm farmers . India’s march toward 20% ethanol by 2025 boosts demand for grain and molasses ethanol and seeds the market for 1,000 compressed-biogas plants. China’s joint ventures, such as BP’s stake in Jiaao’s upcoming SAF line, signal intent to decarbonize aviation. Ample agricultural residues, rising oil-price exposure, and supportive fiscal incentives combine to make Asia an unrivaled growth engine for the global biofuels market.
List of Companies Covered in this Report:
- Abengoa Bioenergy SA
- Archer Daniels Midland Co.
- BP p.l.c.
- Cargill Inc.
- Chevron Renewable Energy Group Inc.
- Cosan S.A. / Raízen
- Eni S.p.A. (Eni Sustainable Mobility)
- Gevo Inc.
- Green Plains Inc.
- LanzaTech Global Inc.
- Neste Oyj
- POET LLC
- Petrobras
- Shell p.l.c.
- TotalEnergies SE
- Valero Energy Corp. (Diamond Green Diesel)
- Verbio Vereinigte BioEnergie AG
- Wilmar International Ltd.
- Aemetis Inc.
- Amyris Inc.
- Clariant AG
- Enerkem Inc.
- Pacific Ethanol (Alto Ingredients)
- Ørsted A/S (Power-to-X Bio-methanol)
- Pacific Biodiesel Technologies
Additional Benefits:
- The market estimate (ME) sheet in Excel format
- 3 months of analyst support
Table of Contents
1 Introduction
1.1 Study Assumptions & Market Definition
1.2 Scope of the Study
2 Research Methodology
3 Executive Summary
4 Market Landscape
4.1 Market Overview
4.2 Market Drivers
4.2.1 Transport-sector Blend Mandates Intensifying in Asia & South America
4.2.2 Net-Zero–Aligned Corporate PPAs Driving Renewable Diesel Demand in North America
4.2.3 SAF (Sustainable Aviation Fuel) Tax Incentives in the EU & U.S. Inflation Reduction Act
4.2.4 Phasing-Out of Palm-based Feedstocks Prompting Algae & Waste-Oil Investments in EU
4.2.5 Emergence of Bio-naphtha for Petro-Chem Feedstock Decarbonisation
4.3 Market Restraints
4.3.1 Volatile Feedstock Prices (Soy, Rapeseed, UCO) Squeezing Producer Margins
4.3.2 Infrastructure Bottlenecks in Collecting Agri-Residues in India & Indonesia
4.3.3 Indirect Land-Use-Change (ILUC) Sustainability Caps in Europe
4.3.4 Competition from Drop-in e-Fuels in Long-haul Aviation
4.4 Supply-Chain Analysis
4.5 Regulatory & Technological Outlook
4.6 Porter’s Five Forces
4.6.1 Bargaining Power of Suppliers
4.6.2 Bargaining Power of Buyers
4.6.3 Threat of New Entrants
4.6.4 Threat of Substitutes
4.6.5 Competitive Rivalry
5 Market Size & Growth Forecasts (Value & Volume)
5.1 By Fuel Type
5.1.1 Bioethanol
5.1.2 Biodiesel (FAME)
5.1.3 Renewable Diesel / HVO
5.1.4 Sustainable Aviation Fuel (SAF)
5.1.5 Bio-naphtha and Other Drop-in Biofuels
5.2 By Generation
5.2.1 First-Generation (Sugar & Starch)
5.2.2 Second-Generation (Cellulosic)
5.2.3 Third-Generation (Algae-based)
5.2.4 Fourth-Generation (Synthetic Biology/Photobiological)
5.3 By Feedstock
5.3.1 Sugar Crops (Sugarcane, Sugar Beet)
5.3.2 Starch Crops (Corn, Wheat, Cassava)
5.3.3 Oilseeds (Soy, Rapeseed, Palm)
5.3.4 Used Cooking Oil and Animal Fat
5.3.5 Lignocellulosic Agri-Residues
5.3.6 Algae
5.4 By Technology
5.4.1 Fermentation
5.4.2 Trans-esterification
5.4.3 Hydrotreatment (HVO/SAF)
5.4.4 Gasification and FT-Synthesis
5.4.5 Pyrolysis and Upgrading
5.5 By End-use Sector
5.5.1 Road Transport
5.5.2 Aviation
5.5.3 Marine
5.5.4 Power Generation and Heating
5.6 By Geography
5.6.1 North America
5.6.1.1 United States
5.6.1.2 Canada
5.6.1.3 Mexico
5.6.2 Europe
5.6.2.1 Germany
5.6.2.2 France
5.6.2.3 United Kingdom
5.6.2.4 Denmark
5.6.2.5 Rest of Europe
5.6.3 Asia-Pacific
5.6.3.1 China
5.6.3.2 India
5.6.3.3 Indonesia
5.6.3.4 Japan
5.6.3.5 Rest of Asia-Pacific
5.6.4 South America
5.6.4.1 Brazil
5.6.4.2 Argentina
5.6.4.3 Chile
5.6.4.4 Rest of South America
5.6.5 Middle East and Africa
5.6.5.1 Saudi Arabia
5.6.5.2 United Arab Emirates
5.6.5.3 South Africa
5.6.5.4 Egypt
5.6.5.5 Rest of Middle East and Africa
6 Competitive Landscape
6.1 Market Concentration
6.2 Strategic Moves (M&A, Partnerships, PPAs)
6.3 Market Share Analysis (Market Rank/Share for key companies)
6.4 Company Profiles (includes Global level Overview, Market level overview, Core Segments, Financials as available, Strategic Information, Products & Services, and Recent Developments)
6.4.1 Abengoa Bioenergy SA
6.4.2 Archer Daniels Midland Co.
6.4.3 BP p.l.c.
6.4.4 Cargill Inc.
6.4.5 Chevron Renewable Energy Group Inc.
6.4.6 Cosan S.A. / Raízen
6.4.7 Eni S.p.A. (Eni Sustainable Mobility)
6.4.8 Gevo Inc.
6.4.9 Green Plains Inc.
6.4.10 LanzaTech Global Inc.
6.4.11 Neste Oyj
6.4.12 POET LLC
6.4.13 Petrobras
6.4.14 Shell p.l.c.
6.4.15 TotalEnergies SE
6.4.16 Valero Energy Corp. (Diamond Green Diesel)
6.4.17 Verbio Vereinigte BioEnergie AG
6.4.18 Wilmar International Ltd.
6.4.19 Aemetis Inc.
6.4.20 Amyris Inc.
6.4.21 Clariant AG
6.4.22 Enerkem Inc.
6.4.23 Pacific Ethanol (Alto Ingredients)
6.4.24 Ørsted A/S (Power-to-X Bio-methanol)
6.4.25 Pacific Biodiesel Technologies
7 Market Opportunities & Future Outlook
7.1 White-space & Unmet-Need Assessment
7.2 Next-Gen Electro-Bio-Refineries Integrating Green H₂