Automotive On-board Charger - Market Share Analysis, Industry Trends & Statistics, Growth Forecasts (2026 - 2031)
自動車用オンボード充電器市場レポートは、車両タイプ(乗用車および商用車)、パワートレインタイプ(バッテリー電気自動車およびプラグインハイブリッド電気自動車)、電力定格(3.3 KW未満、3.3~11 KW、および11 KW超)、販売チャネル(OEMインストールおよびアフターマーケット)、および地域別にセグメント化されています。
The Automotive On-Board Charger Market Report is Segmented by Vehicle Type (Passenger Cars and Commercial Vehicles), Powertrain Type (Battery Electric Vehicles and Plug-In Hybrid Electric Vehicles), Power Rating (Less Than 3. 3 KW, 3. 3–11 KW, and More Than 11 KW), Sales Channel (OEM-Installed and Aftermarket), and Geography.
| 出版 | Mordor Intelligence |
| 出版年月 | 2026年02月 |
| ページ数 | 240 |
| 価格 | 記載以外のライセンスについてはお問合せください |
| シングルユーザ | USD 4,750 |
| 種別 | 英文調査報告書 |
| 商品番号 | SMR-1343913439 |

自動車用オンボード充電器市場は、2025年の71億7,000万米ドルから2026年には81億7,000万米ドルに成長し、2026年から2031年にかけて年平均成長率(CAGR)13.92%で成長し、2031年には156億8,000万米ドルに達すると予測されています。主要経済圏における電気自動車導入義務の急増、800V車両プラットフォームへの急速な移行、そしてワイドバンドギャップ半導体の価格の着実な低下は、仕様のアップグレードサイクルを相乗的に強化し、高出力充電ソリューションに対する需要全体を押し上げています。自動車メーカーは、欧州および一部のアジア市場で三相住宅用グリッドを活用し、11~22kWユニットを標準化しています。北米のOEMは、コスト感度と連邦政府のインセンティブのバランスを取り、国内向け充電器の生産とISO 15118への準拠を優先しています。従来のバリューチェーンを迂回してトラクションと組み合わせたアーキテクチャを追求する半導体専門企業からシェアを守るため、ティア1サプライヤーは競争の勢いを強めています。同時に、政策立案者はアルミニウムハウジングの安全性とリサイクル性に関する規制を厳格化し、段階的な再設計要件を設けてサプライヤーの収益拡大を図っています。これらの構造的な力が相まって、車載充電器市場は今後10年間、2桁成長を維持しています。
セグメント分析
- 2025年には乗用車が車載充電器市場規模の65.82%を占めたにもかかわらず、商用車は2025~2031年の間に14.05%という最も高いCAGRを達成しました。車両基地中心のデューティサイクルでは、停車時間を最小限に抑える車両群が優遇されます。そのため、物流事業者は夜間のエネルギースループットを最大化し、公共サービスの需要応答に参加するために、22kWの双方向充電器を指定しています。
- 乗用車は、対応可能なナンバープレート基盤の拡大により、引き続き出荷台数全体の牽引役となるものの、プラットフォームの共通化によってオプション価格の自由度が制限されるにつれて、単価の貢献は減少する。安全規制、サイバーセキュリティ義務、リサイクル性規制の融合により、フリート固有のソリューションに対する非経常的なエンジニアリング支出が増加し、専門サプライヤーにマージンバッファーが提供される。フリートはまた、充電器利用状況ダッシュボードや予防保守アラートといった付加価値分析技術を先駆的に導入しており、統合型車載充電器(OBC)製品の価格面での差別化を図っている。結果として、車種別の動向は成長軌道にばらつきを生じさせるものの、全体としては車載充電器市場全体の売上高を2桁成長に維持している。
- バッテリー電気自動車(EV)は2025年に車載充電器市場の76.18%のシェアを獲得し、2031年まで年平均成長率(CAGR)14.02%で首位を維持する見込みです。純電動スケートボード型アーキテクチャは、リアアクスル上部の容積を解放し、OBC、トラクションインバータ、DC-DCステージが標準の冷却ループを共有する集中型パワーエレクトロニクスベイを実現します。床下燃料タンクの制約により、このパッケージングはPHEVレイアウトでは再現できないコスト削減を実現します。
- プラグインハイブリッドは、コンプライアンス遵守と地方市場のニッチ市場への対応を継続していますが、デュアルフューエルの複雑さから、コストと質量管理の観点から、車載充電器(OBC)の定格出力は7.4kW程度に制限されています。中国と欧州の規制クレジット制度は、PHEVに対するボーナス乗数を段階的に引き下げており、プレミアム充電器のアップグレードに対するビジネスケースを厳格化しています。サプライヤーは、PHEVの設計は主に派生的なものにとどめつつ、BEVフリートのファームウェアカスタマイズ(動的な位相スイッチングと高調波抑制を可能にする)を優先しています。2029年までに西欧の新車登録台数の半分をBEVが占めるようになるにつれ、サプライヤーはBEV専用OBCが総売上高の85%以上を占めると予想しており、車載充電器市場の長期的な成長見通しを強固なものにしています。
- 自動車用オンボードチャージャー市場レポートは、車両タイプ(乗用車および商用車)、パワートレインタイプ(バッテリー電気自動車およびプラグインハイブリッド電気自動車)、出力定格(3.3kW未満、3.3~11kW、11kW超)、販売チャネル(OEM装着およびアフターマーケット)、および地域別にセグメント化されています。市場予測は、金額(米ドル)と数量(ユニット)で提供されています。
Automotive On-board Charger Market Analysis
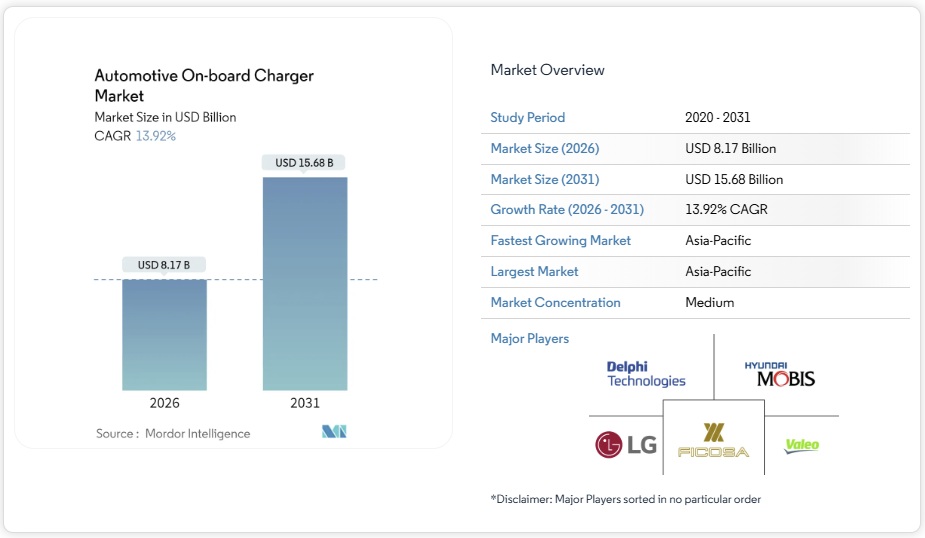
The Automotive On-board Charger Market is expected to grow from USD 7.17 billion in 2025 to USD 8.17 billion in 2026 and is forecast to reach USD 15.68 billion by 2031 at 13.92% CAGR over 2026-2031. Surging electric-vehicle adoption mandates across major economies, the rapid migration to 800 V vehicle platforms, and steady declines in wide-band-gap semiconductor pricing collectively reinforce a cycle of specification upgrades that lift overall demand for higher-power charging solutions. Automakers leverage three-phase residential grids in Europe and selected Asian markets to standardize 11–22 kW units. North American OEMs balance cost sensitivities against federal incentives, prioritizing domestic charger production and ISO 15118 compliance. Competitive momentum intensifies as tier-1 suppliers defend share against semiconductor specialists that bypass traditional value chains to pursue traction-combined architectures. At the same time, policymakers tighten safety and recyclability rules on aluminum housings, creating incremental redesign requirements that expand supplier addressable revenue. Together, these structural forces sustain double-digit growth for the Automotive on-board charger market through the decade.
Global Automotive On-board Charger Market Trends and Insights
Aggressive Global EV Adoption Targets & Purchase Incentives
National zero-emission mandates and purchase subsidies elevate the baseline specification of on-board chargers as OEMs race to deliver compelling total-cost-of-ownership propositions. China’s new-energy vehicle sales goal for 2025, the European Union’s half of fleet-wide CO₂-reduction requirement for 2030, and California’s Advanced Clean Cars II program together accelerate model launches that embed 11 kW or 22 kW AC capability as standard equipment . With South Korea aiming for a significant increase in EV adoption by the end of the decade, Hyundai Mobis is set to ramp up production of integrated charging control units (ICCU) starting in the latter half of the decade. This move underscores a regional demand surge, contributing to a price drop for SiC devices. Meanwhile, subsidy frameworks are increasingly offering home-charging vouchers. This tactic not only shortens the payback period for consumers investing in higher-power wallboxes but also validates OEMs’ investments in advanced features like bi-directional energy flow and ISO 15118 authentication for on-board chargers.
Rapid Switch To 800 V Vehicle Architectures Enabling 11–22 kW OBCs
The migration toward 800 V electrical systems reshapes cost-performance frontiers by enabling higher power densities without proportional increases in copper mass or thermal overhead. Hyundai’s E-GMP and GM’s Ultium demonstrate quick charging scenarios, making 22 kW AC capability a natural complement for residential energy arbitrage . Suppliers such as FORVIA HELLA integrate Infineon CoolSiC modules into compact housings, achieving maximum efficiency and reducing cooling plate area by one-third, freeing under-hood volume for auxiliary electronics. Early adopters leverage reduced charge times to command pricing premiums and secure valuable compliance credits in markets that tie incentive eligibility to minimum charging performance thresholds. As tier-1s pre-qualify 800 V-ready designs, secondary adopters face compressed design windows, intensifying the demand for turnkey reference platforms. The net effect elevates base-grade power ratings and scales the Automotive on-board charger market beyond its historical 3.3–7.4 kW spine.
Persistently High Wide-Band-Gap Substrate Costs in 22 kW Three-Phase OBCs
Despite record foundry expansions, SiC boule yields under three-fifths and GaN epi-wafer lead times surpassing 30 weeks prolong elevated substrate economics. Automotive-grade 650 V SiC MOSFET die still commands a 3–4 times premium over planar silicon IGBTs, limiting high-power three-phase designs to premium badges and commercial fleets. Heat-spreading plates and EMI shielding further inflate system material costs, offsetting some of the density gains from wide-band-gap adoption. For value-oriented C-segment crossovers, each USD 0.02 / W price delta translates to roughly USD 45 in incremental BOM, pressuring retail margins in price-elastic markets. OEMs thus defer 22 kW option codes outside Europe until cost curves decline, creating a temporary ceiling on the penetration rate of next-gen chargers in the Automotive on-board charger market.
Other drivers and restraints analyzed in the detailed report include:
- Declining SiC/GaN Device Prices Lifting OBC Power Density
- Mandatory ISO 15118 / Plug-and-Charge & V2G Readiness Clauses
- OEM Hesitancy To Up-Spec AC Chargers As DC Ultra-Fast Networks Accelerate
For complete list of drivers and restraints, kindly check the Table Of Contents.
Segment Analysis
Commercial vehicles contributed the fastest 14.05% CAGR during 2025-2031, even though passenger cars controlled 65.82% of the Automotive on-board charger market size in 2025. Depot-centric duty cycles reward fleets that minimize dwell times; thus, logistics operators specify 22 kW bi-directional chargers to maximize overnight energy throughput and participate in utility demand-response.
Passenger cars will continue to anchor absolute shipments because of larger addressable license-plate bases, yet their unit-value contribution tapers as platform commonization curbs option-pricing latitude. The convergence of safety regulations, cybersecurity mandates, and recyclability rules amplifies non-recurring engineering outlays for fleet-specific solutions, giving specialized suppliers a margin buffer. Fleets also pioneer value-added analytics such as charger-utilization dashboards and preventive-maintenance alerts that monetarily differentiate integrated OBC offerings. Consequently, vehicle-type dynamics shape divergent growth trajectories but collectively keep the broader Automotive on-board charger market on a double-digit revenue track.
Battery electric vehicles captured 76.18% of the Automotive on-board charger market share in 2025 and maintain the lead with a 14.02% CAGR through 2031. Pure-electric skateboard architectures free volume above the rear axle, enabling centralized power-electronics bays where OBCs, traction inverters, and DC-DC stages share a standard coolant loop. Due to under-floor fuel-tank constraints, this packaging unlocks cost collaborations that PHEV layouts cannot replicate.
Plug-in hybrids continue to serve compliance and rural-market niches, but their dual-fuel complexity caps OBC ratings near 7.4 kW to manage cost and mass. Regulatory credit systems in China and Europe progressively lower bonus multipliers for PHEVs, tightening the business case for premium charging upgrades. Suppliers prioritize firmware customization for BEV fleets—enabling dynamic phase switching and harmonic mitigation—while keeping PHEV designs largely derivative. As BEVs cross half of new-car registrations in Western Europe by 2029, suppliers expect BEV-dedicated OBCs to represent more than 85% of total revenue, solidifying long-term growth prospects for the Automotive on-board charger market.
The Automotive On-Board Charger Market Report is Segmented by Vehicle Type (Passenger Cars and Commercial Vehicles), Powertrain Type (Battery Electric Vehicles and Plug-In Hybrid Electric Vehicles), Power Rating (Less Than 3. 3 KW, 3. 3–11 KW, and More Than 11 KW), Sales Channel (OEM-Installed and Aftermarket), and Geography. The Market Forecasts are Provided in Terms of Value (USD) and Volume (Units).
Geography Analysis
Asia-Pacific led with 37.35% share of the Automotive on-board charger market size in 2025 and continues to outpace peers at a 14.07% CAGR through 2031, buoyed by China’s GB38031-2025 battery-safety mandate and record EV adoption incentives. By the close of 2023, mainland installations boasted millions of public and private charging units. This milestone set density thresholds, making home charging feasible for high-rise apartments with shared three-phase risers. In a move to address recycling quotas on aluminum housings, the Chinese Ministry of Industry and Information Technology spurred material-substitution initiatives.
Europe, holding the second spot, continues to witness vigorous growth. This momentum is primarily fueled by AFIR’s mandates on ISO 15118 compatibility and the requisite density of charging stations along the Trans-European Transport Network. Germany and France are weaving nuclear and renewable energy into their grids to stabilize grid-carbon intensity. This integration empowers utilities to roll out dynamic tariff products, capitalizing on the vehicle-to-grid capabilities of mid-to-high capacity chargers.
North America is reaping the benefits of the Inflation Reduction Act’s advanced-manufacturing tax credits. Additionally, NEVI-funded corridor developments are bolstering the region’s infrastructure. However, the adoption of higher-capacity chargers remains limited outside luxury brands, primarily due to the constraints of single-phase residential services. In response, OEMs offer dual chargers with higher output capacities, though market penetration is still modest.
List of Companies Covered in this Report:
- BorgWarner Inc.
- Hyundai Mobis
- LG Electronics
- STMicroelectronics
- Ficosa International S.A.
- Valeo SE
- Delta Energy Systems AG
- Toyota Industries Corp.
- Brusa Elektronik AG
- VisIC Technologies
- Infineon Technologies AG
- Eaton Corp.
- DENSO Corp.
- Panasonic Industry
- TDK Corp.
- Onsemi
- Stercom Power Solutions
- Delta-Q Technologies
Additional Benefits:
- The market estimate (ME) sheet in Excel format
- 3 months of analyst support
Table of Contents
1 Introduction
1.1 Study Assumptions & Market Definition
1.2 Scope of the Study
2 Research Methodology
3 Executive Summary
4 Market Landscape
4.1 Market Overview
4.2 Market Drivers
4.2.1 Aggressive Global EV Adoption Targets & Purchase Incentives
4.2.2 Rapid Switch To 800 V Vehicle Architectures Enabling 11–22 kW OBCs
4.2.3 Declining SIC/GAN Device Prices Lifting OBC Power Density
4.2.4 Mandatory ISO 15118 / Plug-&-Charge & V2G Readiness Clauses In EU & US Funding Schemes
4.2.5 Tier-1/OEM Migration To Traction-Integrated & Bidirectional OBCs (3-In-1 E-Axle)
4.2.6 PV-Integrator Channel In Emerging Markets Bundling Rooftop Solar + OBC-Ready EV Packages
4.3 Market Restraints
4.3.1 Persistently High Wide-Band-Gap Substrate Costs In 22 Kw Three-Phase OBCs
4.3.2 OEM Hesitancy To Up-Spec AC Chargers As DC Ultra-Fast (≥350 Kw) Roll-Outs Accelerate
4.3.3 Grid-Connection Bottlenecks For Residential 11 Kw Upgrades In Dense Cities
4.3.4 Impending Scrap-Recycling Regulation In China Taxing Large OBC Aluminum Housings
4.4 Value / Supply-Chain Analysis
4.5 Regulatory Landscape
4.6 Technological Outlook
4.7 Porter’s Five Forces
4.7.1 Threat of New Entrants
4.7.2 Bargaining Power of Buyers/Consumers
4.7.3 Bargaining Power of Suppliers
4.7.4 Threat of Substitute Products
4.7.5 Intensity of Competitive Rivalry
5 Market Size & Growth Forecasts (Value (USD) and Volume (Units))
5.1 By Vehicle Type
5.1.1 Passenger Cars
5.1.2 Commercial Vehicles
5.2 By Powertrain Type
5.2.1 Battery Electric Vehicles (BEVs)
5.2.2 Plug-in Hybrid Electric Vehicles (PHEVs)
5.3 By Power Rating
5.3.1 Less than 3.3 kW
5.3.2 3.3–11 kW
5.3.3 More than 11 kW
5.4 By Sales Channel
5.4.1 OEM-installed
5.4.2 Aftermarket
5.5 By Geography
5.5.1 North America
5.5.1.1 United States
5.5.1.2 Canada
5.5.1.3 Mexico
5.5.2 South America
5.5.2.1 Brazil
5.5.2.2 Argentina
5.5.2.3 Rest of South America
5.5.3 Europe
5.5.3.1 Germany
5.5.3.2 United Kingdom
5.5.3.3 France
5.5.3.4 Italy
5.5.3.5 Russia
5.5.3.6 Rest of Europe
5.5.4 Asia Pacific
5.5.4.1 China
5.5.4.2 Japan
5.5.4.3 India
5.5.4.4 South Korea
5.5.4.5 Rest of Asia Pacific
5.5.5 Middle East & Africa
5.5.5.1 Saudi Arabia
5.5.5.2 UAE
5.5.5.3 Turkey
5.5.5.4 South Africa
5.5.5.5 Egypt
5.5.5.6 Nigeria
5.5.5.7 Rest of Middle East and Africa
6 Competitive Landscape
6.1 Market Concentration
6.2 Strategic Moves
6.3 Market Share Analysis
6.4 Company Profiles (includes Global Level Overview, Market Level Overview, Core Segments, Financials as Available, Strategic Information, Market Rank/Share for Key Companies, Products and Services, SWOT Analysis, and Recent Developments)
6.4.1 BorgWarner Inc.
6.4.2 Hyundai Mobis
6.4.3 LG Electronics
6.4.4 STMicroelectronics
6.4.5 Ficosa International S.A.
6.4.6 Valeo SE
6.4.7 Delta Energy Systems AG
6.4.8 Toyota Industries Corp.
6.4.9 Brusa Elektronik AG
6.4.10 VisIC Technologies
6.4.11 Infineon Technologies AG
6.4.12 Eaton Corp.
6.4.13 DENSO Corp.
6.4.14 Panasonic Industry
6.4.15 TDK Corp.
6.4.16 Onsemi
6.4.17 Stercom Power Solutions
6.4.18 Delta-Q Technologies
7 Market Opportunities & Future Outlook
7.1 White-space & unmet-need assessment