UI/UX - Market Share Analysis, Industry Trends & Statistics, Growth Forecasts (2026 - 2031)
UI/UX 市場レポートは、展開モデル (クラウドベースおよびオンプレミス)、組織規模 (大企業、中規模企業など)、最終用途産業 (電子商取引および小売、ヘルスケアおよびライフサイエンス、BFSI など)、プラットフォーム (モバイル アプリケーション、Web アプリケーション、デスクトップ ソフトウェアなど)、および地域別にセグメント化されています。
The UI/UX Market Report is Segmented by Deployment Model (Cloud-Based, and On-Premises), Organization Size (Large Enterprises, Mid-Sized Enterprises, and More), End-Use Industry (E-Commerce and Retail, Healthcare and Life Sciences, BFSI, and More), Platform (Mobile Applications, Web Applications, Desktop Software, and More), and Geography.
| 出版 | Mordor Intelligence |
| 出版年月 | 2026年02月 |
| ページ数 | 121 |
| 価格 | 記載以外のライセンスについてはお問合せください |
| シングルユーザ | USD 4,750 |
| 種別 | 英文調査報告書 |
| 商品番号 | SMR-13199 |

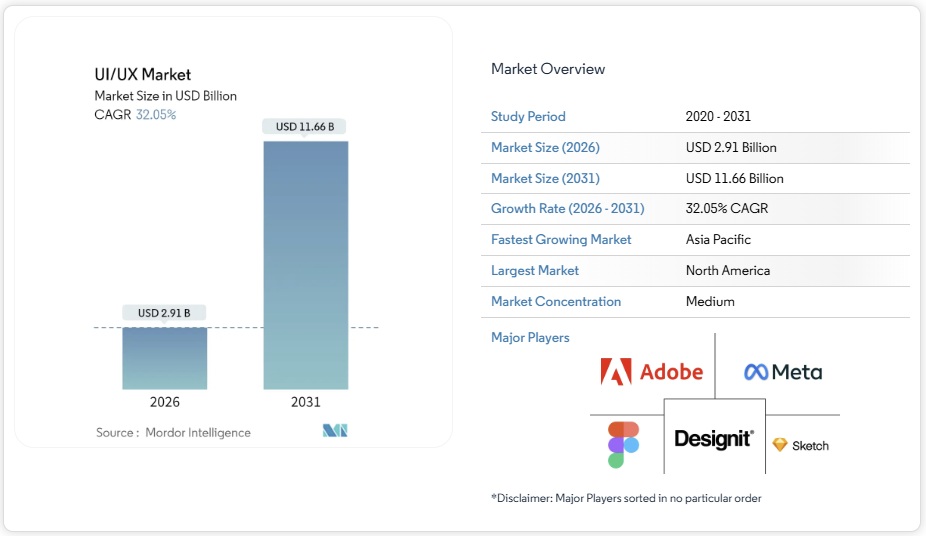
UI/UXデザイン市場は、2025年の22億米ドルから2026年には29億1,000万米ドルに成長し、2026年から2031年にかけて年平均成長率(CAGR)32.05%で成長し、2031年には116億6,000万米ドルに達すると予測されています。企業がデジタルエクスペリエンスを単なるサポート業務から競争優位性の中核的な源泉へと高めることで、力強い成長が期待されます。欧州アクセシビリティ法などの規制要件、クラウドベースの共同設計プラットフォームの普及、モバイルファーストのカスタマージャーニーへの急速な転換により、プラットフォームのアップグレードとサービス支出が加速しています。大企業は引き続き全体的な需要を支えていますが、中規模企業は投資規模を急速に拡大しており、高度な設計機能の民主化を示しています。eコマース、銀行、医療機関は、アクセシビリティ、パーソナライゼーション、生成AI機能を統合した設計システムに過去最大の予算を割り当てています。ツールベンダーとコンサルタント会社間の競争の激化により統合が進む一方、人材不足とサブスクリプション費用により事業拡大は抑制されているものの、阻害されることはない。
セグメント分析
- クラウドセグメントは、2025年にUI/UXデザイン市場の68.35%のシェアを獲得し、2031年まで年平均成長率(CAGR)34.68%で成長すると予測されており、共同ワークフローが戦略的に不可欠な要素であることを浮き彫りにしています。この変化は、リアルタイムの共同制作、バージョン管理、プラグアンドプレイAIサービスに依存する、世界中に分散した製品チームによって推進されています。Figmaの差し迫った上場は、純粋なクラウドデリバリーに対する投資家の信頼を浮き彫りにしています。また、欧州アクセシビリティ法への準拠は、監査可能なアップデートのために、企業にコンポーネントを共有ライブラリに一元管理するよう促しています。
- 厳格なデータ主権ルールを適用する防衛、医療、公共部門の機関では、オンプレミス導入が依然として続いていますが、クラウドセキュリティ認証の成熟により、オンプレミス導入への抵抗は弱まりつつあります。サブスクリプション経済は、設備投資を運用費用に変換し、アクティブユーザーや利用量の急増に合わせてコストを調整します。ベンダーがコアデザインエディター上に分析、アセットストレージ、ユーザーテストモジュールをアップセルすることで、UI/UXデザイン市場は恩恵を受けています。統合ロードマップには、クラウドデザインデータをDevOpsパイプラインにストリーミングするAPIがますます多く含まれており、イテレーションサイクルの短縮とホスト環境への優位性につながっています。
- 大企業は2025年も収益シェアの51.05%を維持しました。これは、数百もの製品にまたがるスケーラブルなデザインシステムを必要とする複雑なポートフォリオを反映しています。一方、中規模企業は支出を33.92%のCAGRで拡大しており、これはあらゆる規模の企業の中で最も高い伸び率です。これは、かつてはフォーチュン500企業に限定されていた高度なツールセットへのアクセスが民主化されていることを示しています。これらの企業では、レガシー制約による導入の遅れが少ないため、コンポーネント駆動開発とビジュアル回帰テストが急速に成熟しています。
- 中規模企業向けUI/UXデザイン市場が拡大するにつれ、プラットフォームベンダーは、リソースに制約のある顧客のニーズに応えるため、段階的な価格設定とモジュール型のアドオンを提供しています。また、中規模市場は、代理店がクライアントに代わって管理されたサブスクリプション契約に基づき、ボードやプロトタイプを管理するアウトソーシング型のデザイン・アズ・ア・サービス(DaaS)モデルも推進しています。中小企業はまだ導入の初期段階ですが、AIを活用したテンプレートによって学習曲線が短縮され、大きなメリットが期待できます。このように、多様な規模の組織がUI/UXデザイン市場全体のリスクを分散させ、階層化された成長経路を生み出しています。
- UI/UX市場レポートは、導入モデル(クラウドベース、オンプレミス)、組織規模(大企業、中規模企業など)、最終用途産業(Eコマース、小売、ヘルスケア、ライフサイエンス、BFSIなど)、プラットフォーム(モバイルアプリケーション、Webアプリケーション、デスクトップソフトウェアなど)、および地域別にセグメント化されています。市場予測は金額(USD)で提供されます。
UI/UX Market Analysis
The UI/UX design market is expected to grow from USD 2.20 billion in 2025 to USD 2.91 billion in 2026 and is forecast to reach USD 11.66 billion by 2031 at 32.05% CAGR over 2026-2031. Strong growth arises as enterprises elevate digital experience from a support task to a core source of competitive advantage. Regulatory mandates such as the European Accessibility Act, broader adoption of cloud-based collaborative design platforms, and the rapid pivot to mobile-first customer journeys are accelerating platform upgrades and service spending. Large enterprises continue to anchor overall demand, yet mid-sized firms are scaling investment faster, signaling democratization of advanced design capabilities. E-commerce, banking, and healthcare organizations allocate record budgets to design systems that knit together accessibility, personalization, and generative-AI functions. Intensifying competition among tool vendors and consultancies is fostering consolidation, while the talent crunch and subscription costs temper, but do not derail, the expansion.
Global UI/UX Market Trends and Insights
Proliferation of Digital-Transformation Programs
Large-scale modernization projects are recasting design as a strategic capability, rather than a tactical service. JPMorgan Chase allocated USD 17 billion to technology investments in 2024, including USD 4 billion for the development of consumer and community banking products. Fueled by these returns, enterprises embed design leadership into their transformation roadmaps rather than outsourcing projects on a project-by-project basis. Continuous iteration anchored in real user data sustains demand for full-suite design platforms and services. Spending resilience remains intact during economic slowdowns because senior executives treat superior UX as a defensive moat against disruption. As a result, the UI/UX design market benefits from multiyear budget visibility and higher refresh frequency of design systems.
Surge in Mobile-Commerce Adoption
Mobile channels are forecast to contribute 59% of global e-commerce sales in 2025, yet cart-abandonment rates hover near 74.7% due to subpar mobile UX. Retailers therefore prioritize mobile-native design that leverages biometric login, contextual search, and device-level personalization. Figma recorded a 46% jump in design-tool spending among Asia-Pacific enterprises during 2024 as merchants retool checkout flows for super-app ecosystems. Chinese and Indonesian platforms integrate shopping, payments, and social engagement in one interface, prompting Western brands to mimic the model. Heightened design complexity stimulates demand for prototyping tools able to replicate native gestures and micro-interactions. These factors collectively expand the UI/UX design market by attracting merchants that previously viewed UX initiatives as optional upgrades.
Shortage of Skilled UI/UX Talent
Demand for experienced designers outstrips supply by up to 4 times in major tech hubs, lengthening hiring cycles to six months for senior roles. Specialized skill sets such as accessibility design and AR/VR interface creation compound scarcity, driving wage inflation that squeezes start-ups and non-profits. Academic programs struggle to update syllabi fast enough, leaving graduates underprepared for data-driven, cross-functional work environments. This deficiency fuels acquisitions of boutique studios as large consultancies buy teams wholesale to secure expertise. Although platforms embed AI to automate routine tasks, a human-centered strategy continues to require deep talent, constraining the pace at which the UI/UX design market can scale.
Other drivers and restraints analyzed in the detailed report include:
- Enterprise Focus on Customer-Experience KPIs
- Cloud-Based Collaborative Design Platforms
- High Subscription Cost of Premium Tool Suites
For complete list of drivers and restraints, kindly check the Table Of Contents.
Segment Analysis
The cloud segment captured 68.35% of the UI/UX design market share in 2025 and is forecast to rise at a 34.68% CAGR through 2031, underscoring collaborative workflows as a strategic necessity. The shift is propelled by globally distributed product teams that depend on real-time co-creation, version control, and plug-and-play AI services. Figma’s imminent listing highlights investor confidence in pure-cloud delivery, while European Accessibility Act compliance pushes firms to centralize components in shared libraries for auditable updates.
On-premises deployments persist in defense, healthcare, and public-sector agencies that enforce strict data-sovereignty rules; however, maturing cloud security certifications continue to erode resistance. Subscription economics convert capital expenditure into operating expense, tailoring cost to active users and usage spikes. The UI/UX design market benefits as vendors upsell analytics, asset-storage, and user-testing modules layered atop core design editors. Integration roadmaps increasingly involve APIs that stream cloud design data into DevOps pipelines, shortening iteration cycles and reinforcing the preference for hosted environments.
Large enterprises retained 51.05% revenue share in 2025, reflecting complex portfolios that demand scalable design systems across hundreds of products. Yet mid-sized organizations are expanding spend at a 33.92% CAGR, the highest rate among any size cohort, signaling democratized access to sophisticated toolsets once limited to Fortune 500 peers. Component-driven development and visual regression testing mature quickly in these firms because fewer legacy constraints slow adoption.
As UI/UX design market size for mid-sized enterprises climbs, platform vendors tailor tiered pricing and modular add-ons to suit resource-constrained buyers. The mid-market also fuels outsourced design-as-a-service models whereby agencies maintain boards and prototypes on behalf of clients under managed subscriptions. Small businesses remain nascent adopters but stand to benefit from AI-assisted templates that trim learning curves. Collectively, diverse organization sizes diffuse risk across the UI/UX design market and create layered growth pathways.
The UI/UX Market Report is Segmented by Deployment Model (Cloud-Based, and On-Premises), Organization Size (Large Enterprises, Mid-Sized Enterprises, and More), End-Use Industry (E-Commerce and Retail, Healthcare and Life Sciences, BFSI, and More), Platform (Mobile Applications, Web Applications, Desktop Software, and More), and Geography. The Market Forecasts are Provided in Terms of Value (USD).
Geography Analysis
North America accounted for 39.20% of 2025 revenue and continues to define many global best practices. Silicon Valley giants pioneer interface conventions and cultivate the deepest talent pool, which shapes expectations in other regions. Federal accessibility rules and stringent privacy frameworks foster demand for compliance-oriented design audits. Venture financing remains abundant for design-first start-ups, and M&A activity sees consultancies purchasing studios to close skill gaps. Although growth moderates as penetration matures, replacement cycles of legacy systems sustain steady spend within the UI/UX design market.
Asia-Pacific is projected to register the highest 33.30% CAGR to 2031 as China, India, and Southeast Asian economies leapfrog desktop paradigms and move directly to mobile-native and AI-infused workflows. Chinese super-apps embed shopping, payments, and social feeds inside unified experiences, creating novel UX blueprints that Western firms imitate. Government programs across South Korea, Singapore, and Indonesia allocate significant budgets to nurture design talent and digital-creative clusters. The region’s colossal digital-commerce volumes and youthful demographic accelerate experimentation in micro-interactions, social commerce, and integrated loyalty ecosystems.
Europe demonstrates balanced expansion propelled by the June 2025 enforcement of the European Accessibility Act, which compels organizations to retrofit products for inclusive use. The regulation prompts cross-border enterprises to standardize accessible components, often through cloud-based libraries that propagate updates instantly. European automotive and manufacturing leaders also require specialized in-vehicle and industrial-IoT interfaces, broadening use cases. South America plus the Middle East and Africa emerge as frontier markets. Digital-payments adoption, mobile broadband expansion, and smart-city initiatives heighten awareness of user experience as a pillar of service quality, gradually enlarging the UI/UX design market footprint across these regions.
List of Companies Covered in this Report:
- Adobe Inc.
- Figma, Inc.
- Sketch B.V.
- InVisionApp, Inc.
- Axure Software Solutions Inc.
- Balsamiq Studios LLC
- Proto.io Inc.
- UXPin Inc.
- Justinmind Inc.
- International Business Machines Corporation
- Oracle Corporation
- SAP SE
- Microsoft Corporation
- Google LLC
- Meta Platforms, Inc.
- Apple Inc.
- Atlassian Corporation Plc
- Designit A/S
- IDEO LP
- Ramotion LLC
- UX Studio Zrt.
- Nielsen Norman Group Inc.
- HCL Technologies Limited
- Cognizant Technology Solutions Corporation
Additional Benefits:
- The market estimate (ME) sheet in Excel format
- 3 months of analyst support
Table of Contents
1 INTRODUCTION
1.1 Study Assumptions and Market Definition
1.2 Scope of the Study
2 RESEARCH METHODOLOGY
3 EXECUTIVE SUMMARY
4 MARKET LANDSCAPE
4.1 Market Overview
4.2 Market Drivers
4.2.1 Proliferation of digital-transformation programs
4.2.2 Surge in mobile-commerce adoption
4.2.3 Enterprise focus on CX KPIs and NPS
4.2.4 Cloud-based collaborative design platforms
4.2.5 Accessibility legislation (WCAG 3.0) redesign mandates
4.2.6 Generative-AI infused design workflows
4.3 Market Restraints
4.3.1 Shortage of skilled UI/UX talent
4.3.2 High subscription cost of premium tool suites
4.3.3 Data-privacy limits on behavioral analytics
4.3.4 Interoperability gaps across AR/VR and classic tooling
4.4 Industry Value Chain Analysis
4.5 Regulatory Landscape
4.6 Technological Outlook
4.7 Porter’s Five Forces Analysis
4.7.1 Bargaining Power of Suppliers
4.7.2 Bargaining Power of Buyers
4.7.3 Threat of New Entrants
4.7.4 Threat of Substitutes
4.7.5 Competitive Rivalry
5 MARKET SIZE AND GROWTH FORECASTS (VALUE)
5.1 By Deployment Model
5.1.1 Cloud-based
5.1.2 On-premises
5.2 By Organization Size
5.2.1 Large Enterprises
5.2.2 Mid-sized Enterprises
5.2.3 Small and Micro Enterprises
5.3 By End-use Industry
5.3.1 E-commerce and Retail
5.3.2 Healthcare and Life Sciences
5.3.3 Banking, Financial Services and Insurance (BFSI)
5.3.4 Education and EdTech
5.3.5 IT and Telecom
5.3.6 Media and Entertainment
5.3.7 Government and Public Sector
5.3.8 Other End-use Industries
5.4 By Platform
5.4.1 Mobile Applications
5.4.2 Web Applications
5.4.3 Desktop Software
5.4.4 Voice and Conversational Interfaces
5.4.5 AR/VR and Spatial Interfaces
5.4.6 Automotive and IoT Displays
5.5 By Geography
5.5.1 North America
5.5.2 South America
5.5.3 Europe
5.5.4 Asia-Pacific
5.5.5 Middle East and Africa
6 COMPETITIVE LANDSCAPE
6.1 Market Concentration
6.2 Strategic Moves
6.3 Market Share Analysis
6.4 Company Profiles (includes Global-level Overview, Market-level Overview, Core Segments, Financials as available, Strategic Information, Market Rank/Share for key companies, Products and Services, Recent Developments)
6.4.1 Adobe Inc.
6.4.2 Figma, Inc.
6.4.3 Sketch B.V.
6.4.4 InVisionApp, Inc.
6.4.5 Axure Software Solutions Inc.
6.4.6 Balsamiq Studios LLC
6.4.7 Proto.io Inc.
6.4.8 UXPin Inc.
6.4.9 Justinmind Inc.
6.4.10 International Business Machines Corporation
6.4.11 Oracle Corporation
6.4.12 SAP SE
6.4.13 Microsoft Corporation
6.4.14 Google LLC
6.4.15 Meta Platforms, Inc.
6.4.16 Apple Inc.
6.4.17 Atlassian Corporation Plc
6.4.18 Designit A/S
6.4.19 IDEO LP
6.4.20 Ramotion LLC
6.4.21 UX Studio Zrt.
6.4.22 Nielsen Norman Group Inc.
6.4.23 HCL Technologies Limited
6.4.24 Cognizant Technology Solutions Corporation
7 MARKET OPPORTUNITIES AND FUTURE OUTLOOK
7.1 White-space and Unmet-need Assessment