Green Ammonia - Market Share Analysis, Industry Trends & Statistics, Growth Forecasts (2026 - 2031)
グリーンアンモニア市場レポート:用途別(農業、船舶燃料、発電、水素キャリア、その他の用途(工業原料など))、地域別(アジア太平洋、北米、ヨーロッパ、南米、中東およびアフリカ)
Green Ammonia Market Report: Application (Agriculture, Marine Fuel, Power Generation, Hydrogen Carrier, and Other Applications (Industrial Feedstock and More)), and Geography (Asia-Pacific, North America, Europe, South America, and the Middle East and Africa)
| 出版 | Mordor Intelligence |
| 出版年月 | 2025年02月 |
| ページ数 | 120 |
| 価格 | 記載以外のライセンスについてはお問合せください |
| シングルユーザ | USD 4,750 |
| 種別 | 英文調査報告書 |
| 商品番号 | SMR-15632 |

2026年のグリーンアンモニア市場規模は0.48百万トンと推定され、2025年の0.27百万トンから増加し、2031年には8.69百万トンに達すると予測されており、2026年から2031年にかけて年平均成長率(CAGR)78.35%で成長すると見込まれています。欧州、日本、インドにおける政策支援の強化、資源豊富な地域における再生可能電力コストが1kWhあたり0.02米ドルまで低下していること、そしてグリーンアンモニアが肥料と炭素フリー燃料の両方に利用できるという二重の用途があることが、普及を加速させています。海事脱炭素化義務、特に欧州連合が2024年から排出量取引制度に海運を含めることは、アンモニア燃料船に対する早期の需要を生み出しており、ドイツ、日本、韓国の水素戦略はグリーンアンモニアを主要な水素キャリアとして位置付けています。プロジェクトレベルでは、再生可能エネルギー発電、大規模電解、アンモニア合成を組み合わせた統合プラントが規模の経済を実現しています。一方、ブルーアンモニアとの競争は続いているものの、グリーンアンモニア市場は天然ガス価格の変動に左右されないことや、将来の炭素価格上昇によるプレミアム収入が見込めることから恩恵を受けている。
セグメント分析
- 農業分野は2025年時点でグリーンアンモニア市場の87.25%を占め、2031年まで年平均成長率(CAGR)84.1%で拡大すると予測されています。この統計は、新たなエネルギー用途が出現する中でも、肥料需要が依然として最重要課題であることを示しています。食料不安を抱える地域では、エネルギー自給型の栄養ソリューションが求められており、包括的な補助金制度によって地域生産設備の投資回収期間が短縮されています。
- 船舶燃料は現在、控えめな水準にとどまっていますが、確定した造船受注やバンカリングターミナルの開設発表は、2028年までに転換期を迎えることを示唆しています。日本における火力発電所で最大20%のアンモニアを混焼する発電試験は、発電所の稼働率向上と単位コスト削減につながるクロスオーバー需要を示しています。ドイツと韓国の輸入戦略に支えられた水素キャリア分野は、再生可能エネルギーのホットスポットと産業消費拠点を結ぶ長距離輸送を可能にしています。化学原料および鉄鋼脱炭素化は、ニッチながらも高付加価値の販路を創出し、収益構成を多様化させるとともに、グリーンアンモニア産業を商品サイクル変動から守る緩衝材となる。
- グリーンアンモニア市場レポートは、用途別(農業、船舶燃料、発電、水素キャリア、その他の用途)および地域別(アジア太平洋、北米、欧州、南米、中東・アフリカ)に分類されている。
Green Ammonia Market Analysis
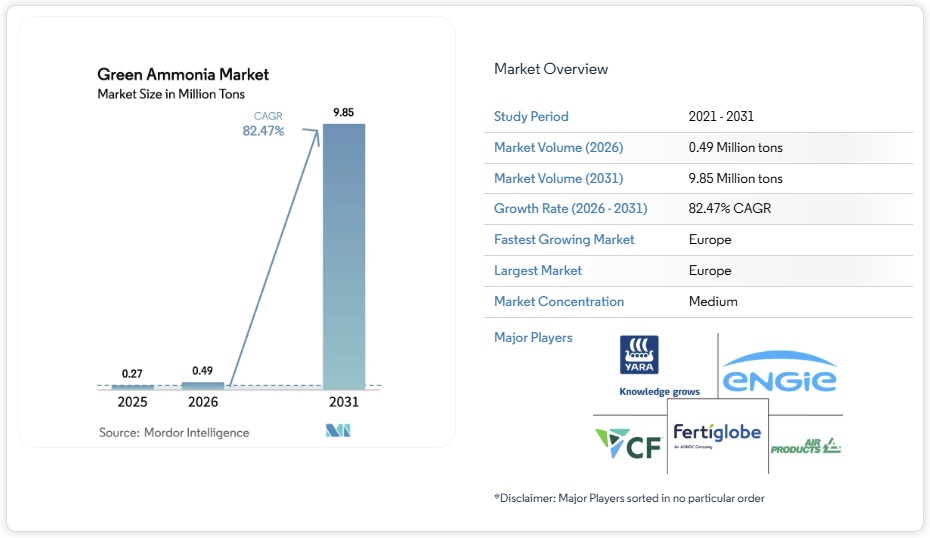
Green Ammonia market size in 2026 is estimated at 0.48 million tons, growing from 2025 value of 0.27 million tons with 2031 projections showing 8.69 million tons, growing at 78.35% CAGR over 2026-2031. Intensifying policy support in Europe, Japan and India, falling renewable electricity costs toward USD 0.02 per kWh in resource-rich regions, and the dual utility of green ammonia as fertilizer and carbon-free fuel collectively accelerate adoption. Maritime decarbonization mandates, particularly the European Union’s inclusion of shipping in its Emissions Trading System from 2024, create early demand for ammonia-powered vessels, while hydrogen strategies in Germany, Japan and South Korea position green ammonia as a key hydrogen carrier. At the project level, integrated plants that combine renewable generation, large-scale electrolysis and ammonia synthesis are unlocking economies of scale. Meanwhile, competition from blue ammonia continues, yet the green ammonia market benefits from independence from natural-gas volatility and the prospect of future carbon-pricing premiums.
Global Green Ammonia Market Trends and Insights
Increasing Fertilizer Demand from Food-Insecure Nations
Developing economies are prioritizing domestic production of green ammonia to reduce fertilizer import dependence and strengthen food security. The Russia-Ukraine conflict exposed vulnerabilities in conventional fertilizer trade, prompting Kenya, Nigeria, and similar nations to announce gigawatt-scale renewable-to-ammonia projects to stabilize supply chains. The African Union’s 2063 neutrality goals foster public-private ventures that link wind and solar resources to smallholder cooperatives. Multilateral lenders have allocated USD 2.3 billion to sustainable fertilizer programs, channeling concessional finance into electrolysis capacity. Countries with high solar and wind potential can achieve delivered costs that undercut imported gray ammonia, shifting the competitive balance. As food-import bills rise, agricultural ministries increasingly bundle fertilizer policy with energy-independence targets, accelerating offtake agreements that underpin financial close for new plants. This momentum contributes strongly to green ammonia market expansion across Africa and South Asia.
Decarbonization Policies Accelerating Green Fuels in Shipping
The International Maritime Organization’s target to halve emissions by 2050 and the EU carbon-pricing extension are catalyzing ammonia fuel adoption. Maersk, NYK Line, and other carriers have placed orders for ammonia-ready vessels, planning commercial operation before 2030. Japan’s Ministry of Economy, Trade and Industry co-funds ammonia engines and mandates 20% ammonia co-firing in power plants, creating overlapping fuel demand. Interim IMO guidelines issued in 2025 clarify safety protocols, triggering investment in bunkering hubs at Rotterdam and Singapore. Port authorities that integrate bunkering infrastructure with renewable-hydrogen backhaul capture early-mover advantages, reinforcing regional clusters.
High Capital Requirements for Electrolysis and Haber-Bosch Retrofits
Electrolyzer packages account for up to half of the total installed cost, at USD 800-1,200 per kW for alkaline units. A 1 million-ton-per-year green ammonia complex demands 500-1,000 MW of electrolyzers, translating to USD 400-1,200 million before adding Haber-Bosch synthesis and renewable generation assets. Continuous ammonia output requires firm renewable power or battery buffer systems, adding 10-15% to capital expenditure. Project finance hinges on 15-25-year power-purchase and offtake contracts—structures still uncommon in emerging markets. Despite incentives like the US Inflation Reduction Act and Europe’s Innovation Fund, higher technology risk premiums are significantly increasing the levelized costs. This rise is causing delays in final investment decisions, highlighting a significant challenge for the green ammonia market.
Other drivers and restraints analyzed in the detailed report include:
- Growing Demand for Green Ammonia as a Hydrogen Carrier
- Increasing Procurement of Green and Low-Carbon Fertilizers
- Safety and Toxicity Hurdles for Maritime Bunkering
For complete list of drivers and restraints, kindly check the Table Of Contents.
Segment Analysis
Agriculture commanded 87.25% of the green ammonia market share in 2025, and the segment is expanding at an 84.1% CAGR through 2031. The statistic underscores the continued primacy of fertilizer demand even as new energy applications emerge. Food-insecure regions seek energy-independent nutrient solutions, and bundled subsidy schemes shorten payback periods on local production assets.
Marine fuel holds a modest baseline today, yet confirmed shipbuilding orders and bunkering terminal announcements indicate an inflection by 2028. Power generation trials in Japan, co-firing up to 20% ammonia in thermal plants, illustrate crossover demand that raises plant load factors and cuts per-unit costs. The hydrogen-carrier segment, backed by import strategies in Germany and South Korea, offers long-haul linkage between renewable hot-spots and industrial consumption centers. Chemical feedstock and steel decarbonization add niche but premium-valued outlets, broadening the revenue mix and cushioning the green ammonia industry against commodity-cycle volatility.
The Green Ammonia Market Report is Segmented by Application (Agriculture, Marine Fuel, Power Generation, Hydrogen Carrier, Other Applications), and Geography (Asia-Pacific, North America, Europe, South America, Middle East and Africa). The Market Forecasts are Provided in Terms of Volume (tons).
Geography Analysis
Europe’s leadership, with a 35.35% green ammonia market share in 2025 and an 84.9% CAGR, rests on comprehensive policy alignment that internalizes carbon prices and rewards renewable content. Norway’s SkiGA offshore-wind-to-ammonia project will supply 100,000 tons per year, setting a regional benchmark for integrated value chains. Germany’s dedicated import terminal at Rotterdam complements domestic electrolysis build-out, ensuring redundancy in supply for industrial users.
Asia-Pacific plays a significant role as a regional contributor. Japan targets 30 million tons of ammonia demand by 2050, combining maritime and power-station offtake, while China pilots multi-GW renewable ammonia plants under provincial stimulus packages. South Korea’s public-private coalition aligns 13 firms and five institutes around production and import logistics, and India’s 550,000-ton annual subsidy scheme catalyzes megaprojects such as AM Green’s 1 million-ton complex in Andhra Pradesh. These initiatives collectively underpin strong regional growth, with Asia-Pacific facilities positioned both for domestic uptake and exports. North America benefits from the Inflation Reduction Act’s production tax credits, evidenced by CF Industries’ Louisiana joint venture targeting 1.4 million tons annual capacity. The Middle East and Africa are emerging as export-oriented hubs; the UAE secured the first H2Global pilot shipment to Germany, validating long-distance trade economics. Brazil’s Ceará state aggregates several projects leveraging onshore wind and port proximity, broadening South America’s stake in the global green ammonia market. Across these continents, comparative advantage hinges on renewable resource endowment, policy incentives and shipping distances to demand centers, factors that will shape future investment allocation.
List of Companies Covered in this Report:
- ACME Group
- Air Products and Chemicals Inc.
- AM Green
- Casale SA
- CF Industries Holdings Inc.
- Engie SA
- ENOWA
- Fertiglobe
- Fortescue
- Greenko Group
- Iberdrola, S.A.
- ITM Power plc
- KAPSOM plc
- MAN Energy Solutions
- Nel
- Ocior
- Ørsted AS
- Proton Ventures
- Siemens Energy
- Technip Energies N.V.
- thyssenkrupp Uhde GmbH
- Yara
Additional Benefits:
- The market estimate (ME) sheet in Excel format
- 3 months of analyst support
Table of Contents
1 Introduction
1.1 Study Assumptions and Market Definition
1.2 Scope of the Study
2 Research Methodology
3 Executive Summary
4 Market Landscape
4.1 Market Overview
4.2 Market Drivers
4.2.1 Increasing fertilizer demand from food-insecure nations
4.2.2 Decarbonization policies accelerating green fuels in shipping
4.2.3 Growing demand for green ammonia as a hydrogen carrier
4.2.4 Increasing procurement of green and low-carbon fertilizers
4.2.5 Increasing usage in power generation and grid stability
4.3 Market Restraints
4.3.1 High capital requirements for electrolysis and Haber-Bosch retrofits
4.3.2 Safety and toxicity hurdles for maritime bunkering
4.3.3 Blue-ammonia cost competition where gas and carbon capture storage (CCS) are cheap
4.4 Value Chain Analysis
4.5 Porter’s Five Forces
4.5.1 Bargaining Power of Suppliers
4.5.2 Bargaining Power of Buyers
4.5.3 Threat of New Entrants
4.5.4 Threat of Substitutes
4.5.5 Degree of Competition
5 Market Size and Growth Forecasts (Volume)
5.1 By Application
5.1.1 Agriculture
5.1.2 Marine Fuel
5.1.3 Power Generation
5.1.4 Hydrogen Carrier
5.1.5 Other Applications (Industrial Feedstock, etc.)
5.2 By Geography
5.2.1 Asia-Pacific
5.2.1.1 China
5.2.1.2 Japan
5.2.1.3 India
5.2.1.4 South Korea
5.2.1.5 ASEAN Countries
5.2.1.6 Rest of Asia-Pacific
5.2.2 North America
5.2.2.1 United States
5.2.2.2 Canada
5.2.2.3 Mexico
5.2.3 Europe
5.2.3.1 Germany
5.2.3.2 United Kingdom
5.2.3.3 France
5.2.3.4 Italy
5.2.3.5 Spain
5.2.3.6 Russia
5.2.3.7 NORDIC Countries
5.2.3.8 Rest of Europe
5.2.4 South America
5.2.4.1 Brazil
5.2.4.2 Argentina
5.2.4.3 Rest of South America
5.2.5 Middle East and Africa
5.2.5.1 Saudi Arabia
5.2.5.2 South Africa
5.2.5.3 Rest of Middle East and Africa
6 Competitive Landscape
6.1 Market Concentration
6.2 Strategic Moves
6.3 Market Share(%)/Ranking Analysis
6.4 Company Profiles (includes Global level Overview, Market level overview, Core Segments, Financials as available, Strategic Information, Market Rank/Share for key companies, Products & Services, and Recent Developments)
6.4.1 ACME Group
6.4.2 Air Products and Chemicals Inc.
6.4.3 AM Green
6.4.4 Casale SA
6.4.5 CF Industries Holdings Inc.
6.4.6 Engie SA
6.4.7 ENOWA
6.4.8 Fertiglobe
6.4.9 Fortescue
6.4.10 Greenko Group
6.4.11 Iberdrola, S.A.
6.4.12 ITM Power plc
6.4.13 KAPSOM plc
6.4.14 MAN Energy Solutions
6.4.15 Nel
6.4.16 Ocior
6.4.17 Ørsted AS
6.4.18 Proton Ventures
6.4.19 Siemens Energy
6.4.20 Technip Energies N.V.
6.4.21 thyssenkrupp Uhde GmbH
6.4.22 Yara
7 Market Opportunities and Future Outlook
7.1 White-space and Unmet-need Assessment
7.2 Growing research on affordable production of green ammonia