Biogas - Market Share Analysis, Industry Trends & Statistics, Growth Forecasts (2026 - 2031)
バイオガス市場レポートは、原料(農業残渣、家畜の堆肥、食品および飲料廃棄物など)、プロセス技術(湿式嫌気性消化、乾式嫌気性消化、埋立地ガス回収)、プラント容量(0.5MW未満、0.5~2MW、2MW以上)、用途(発電、熱発生、車両燃料/RNGなど)、および地域(北米、ヨーロッパ、アジア太平洋、南米など)別にセグメント化されています。
The Biogas Market Report is Segmented by Feedstock (Agri Residues, Livestock Manure, Food and Beverage Waste, and More), Process Technology (Wet Anaerobic, Dry Anaerobic Digestion, and Landfill Gas Recovery), Plant Capacity (Below 0. 5 MW, 0. 5 To 2 MW, Above 2 MW), Application (Electricity Generation, Heat Generation, Vehicle Fuel/RNG, and More), and Geography (North America, Europe, Asia-Pacific, South America, and More).
| 出版 | Mordor Intelligence |
| 出版年月 | 2026年02月 |
| ページ数 | 180 |
| 価格 | 記載以外のライセンスについてはお問合せください |
| シングルユーザ | USD 4,750 |
| 種別 | 英文調査報告書 |
| 商品番号 | SMR-1345413454 |

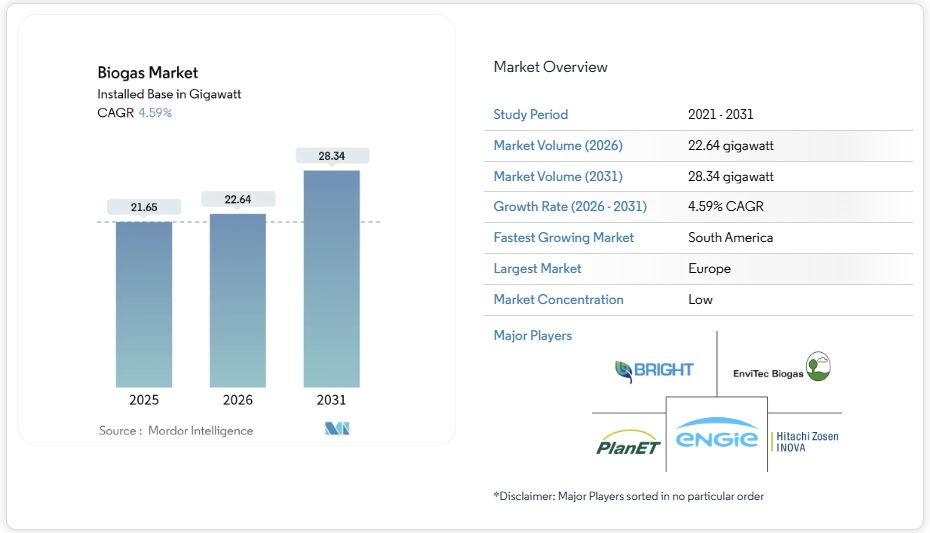
バイオガス市場は2025年に21.65ギガワットと評価され、予測期間(2026~2031年)中に4.59%のCAGRで成長し、2026年の22.64ギガワットから2031年には28.34ギガワットに達すると推定されています。
政策インセンティブの成熟化、発電専用発電所から再生可能天然ガス(RNG)へのアップグレードへの転換、そして企業の脱炭素化へのコミットメントの高まりが、投資基準を再構築しつつあります。輸送燃料の義務化は、乳製品や食品廃棄物から発生するガスのネガティブカーボン特性を評価し、公益企業は太陽光や風力発電を主体とする送電網の安定化を図るため、ディスパッチ可能なバイオガスを統合しています。欧州は固定価格買い取り制度(FIT)と送電網対応のバイオメタンインフラによって先行者利益を維持していますが、南米の2030年までの年平均成長率(CAGR)10%は、新たな政策枠組みが後発地域への参入を加速させる可能性を浮き彫りにしています。0.5~2MWの中規模発電設備は依然として発電容量の増加を牽引していますが、分散型発電のインセンティブによって接続待ち時間が短縮される地域では、0.5MW未満のコミュニティ発電所が急速に拡大しています。競争は依然として激しく、EnviTec Biogasなどの既存の統合企業は自前で設備投資を行うことでシェアを維持していますが、新規参入企業はモジュール式のアップグレードやCO2回収設備のアドオンに注力することで、収益性の向上とプレミアムなオフテイク契約の確保を目指しています。
Biogas Market Analysis
The Biogas Market was valued at 21.65 gigawatt in 2025 and estimated to grow from 22.64 gigawatt in 2026 to reach 28.34 gigawatt by 2031, at a CAGR of 4.59% during the forecast period (2026-2031).
Maturing policy incentives, a pivot from power-only plants to renewable natural gas (RNG) upgrading, and rising corporate decarbonization commitments are re-shaping investment criteria. Transport fuel mandates reward the negative-carbon attributes of dairy and food-waste gas, while utilities integrate dispatchable biogas to stabilize solar- and wind-heavy grids. Europe retains first-mover advantage because of feed-in tariffs and grid-ready biomethane infrastructure, but South America’s 10% CAGR through 2030 underlines how fresh policy frameworks can accelerate late-entry regions. Mid-scale 0.5-2 MW facilities still dominate capacity additions, yet sub-0.5 MW community plants are scaling quickly where distributed-generation incentives cut connection queues. Competitive intensity remains high: established integrators such as EnviTec Biogas defend their share by self-funding capacity, whereas new entrants focus on modular upgrading and carbon capture add-ons to lift yields and secure premium offtake contracts.
Global Biogas Market Trends and Insights
Supportive Government Incentives & Renewable Energy Mandates
Production-based tax credits are replacing legacy feed-in tariffs, lengthening revenue visibility for developers. The 2025 U.S. biogas credit pivots projects toward RNG upgrading rather than electricity sales. India’s Compressed Bio-Gas scheme backs 5,000 plants with fixed offtake, and Poland’s FEnIKS program allocates USD 93 million, leveraging European Union funds to crowd-in further capital. These evolving instruments favor distributed plants that unlock rural income, close nutrient loops, and stabilize the grid.
Decarbonization Targets of Utilities & Corporates
Utilities now value biogas as a firming resource that fills evening demand gaps when solar output fades. Corporates procure RNG to cut Scope 3 emissions and lock in verifiable carbon credits. Negative-carbon intensity scores in California let dairy RNG trade at premiums 3-4 times fossil gas, raising project internal rates of return. Third-party verification frameworks elevate demand for plants with transparent methane-capture accounting.
High Capex Relative to Solar & Wind Projects
Installed costs of USD 3,000-5,000/kW outstrip utility-scale solar, complicating debt terms. EnviTec Biogas offsets this by self-funding EUR 100 million to add 300 GWh capacity, capturing economies of scale that smaller developers cannot. Because of feedstock volatility and operational complexity, lenders typically demand 15-20% equity.
Other drivers and restraints analyzed in the detailed report include:
- Landfill Diversion & Circular-Economy Waste Directives
- Rising Demand for Renewable Natural Gas in Transport
- Sub-optimal Feedstock Logistics in Rural Areas
For complete list of drivers and restraints, kindly check the Table Of Contents.
Segment Analysis
Livestock manure delivered 37.25% of feedstock input in 2025 and anchors long-term supply agreements with farms. Yet food-waste volumes expand 7.12% CAGR as cities adopt landfill bans that shift organics toward digesters, adding tipping-fee revenue to energy income. Agricultural residues and sewage sludge are flexible co-digestion recipes that smooth seasonal imbalances.
Digesters blending manure with food scraps regularly hit 827 L/kg volatile solids yields, thanks to balanced C:N ratios. Municipal policy support means urban waste haulers actively seek digester partners, letting operators lock multi-year gate-fee contracts that strengthen balance sheets.
Wet digestion systems owned 59.10% of 2025 installations, reflecting decades-long supplier ecosystems and lower capex. Dry digestion grows 7.55% CAGR to 2031 because it tolerates 25-35% solids and uses less water, ideal for arid locations or high-solids waste.
Technology selection correlates with feedstock profile: poultry litter, yard trimmings, or packaged food waste increasingly favors dry twin-digester lines that cut preprocessing steps and water bills. Two-stage thermophilic setups achieve up to 43% higher energy recovery, yet only sophisticated operators absorb the extra control-system costs. The biogas market, therefore, segments around fit-for-purpose designs rather than a single dominant process.
The Biogas Market Report is Segmented by Feedstock (Agri Residues, Livestock Manure, Food and Beverage Waste, and More), Process Technology (Wet Anaerobic, Dry Anaerobic Digestion, and Landfill Gas Recovery), Plant Capacity (Below 0. 5 MW, 0. 5 To 2 MW, Above 2 MW), Application (Electricity Generation, Heat Generation, Vehicle Fuel/RNG, and More), and Geography (North America, Europe, Asia-Pacific, South America, and More).
Geography Analysis
Europe held 65.10% of the biogas market share 2025 as legacy feed-in tariffs and standardized biomethane injection codes derisk projects for lenders. Germany alone hosts more than 400 plants, and the REPowerEU goal of 35 bcm of biomethane by 2030 further lifts pipeline-quality gas demand. Denmark illustrates diversification: six biogas-to-marine-fuel plants supply liquefied bio-LNG to shipping lanes, marrying waste valorization with IMO carbon rules.
South America records the fastest expansion at 9.45% CAGR through 2031 as Brazil’s Petrobras issues biomethane tenders and Argentina adds 82 MW in 2024 under agricultural-waste incentives. However, pipeline access and credit risk still hamper scale-up, so developers often cluster near sugarcane mills or meat-packing hubs where waste is abundant and offtake immediate.
North America stands at an inflection point: over 2,500 U.S. sites generated 1.4 million scfm in 2024, and agricultural projects exceeded landfill gas for the first time. Canada’s Clean Fuel Regulations mimic California’s LCFS, widening premium RNG catchment. In Asia-Pacific, India targets 5,000 compressed biogas plants by 2030, supported by guaranteed offtake, while China embeds biogas within rural revitalization plans, pairing digesters with grid-connected micro-grids for village electrification.
List of Companies Covered in this Report:
- Engie SA
- DMT International
- IES Biogas
- EnviTec Biogas AG
- Weltec Biopower GmbH
- Hitachi Zosen Inova AG
- AEV Energy GmbH
- AAT Abwasser- und Abfalltechnik GmbH
- BEKON GmbH
- Nijhuis Saur Industries
- Xebec Adsorption Inc.
- Bright Renewables BV
- Scandinavian Biogas Fuels International AB
- Naskeo Environnement
- PlanET Biogas Group
- BTS Biogas SRL
- BioConstruct GmbH
- Wärtsilä Corporation
- Greenlane Renewables Inc.
- Clarke Energy
Additional Benefits:
- The market estimate (ME) sheet in Excel format
- 3 months of analyst support
Table of Contents
1 Introduction
1.1 Study Assumptions & Market Definition
1.2 Scope of the Study
2 Research Methodology
3 Executive Summary
4 Market Landscape
4.1 Market Overview
4.2 Market Drivers
4.2.1 Supportive government incentives & renewable energy mandates
4.2.2 Decarbonisation targets of utilities & corporates
4.2.3 Landfill diversion & circular-economy waste directives
4.2.4 Rising demand for renewable natural gas (RNG) in transport
4.2.5 Monetisation of digestate as certified bio-fertiliser
4.2.6 Co-digestion synergies with wastewater treatment plants
4.3 Market Restraints
4.3.1 High capex relative to solar & wind projects
4.3.2 Sub-optimal feedstock logistics in rural areas
4.3.3 Price volatility of conventional natural gas affecting RNG offtake
4.3.4 Limited grid-injection infrastructure in emerging markets
4.4 Supply-Chain Analysis
4.5 Regulatory Landscape
4.6 Technological Outlook
4.7 Porter’s Five Forces
4.7.1 Bargaining Power of Suppliers
4.7.2 Bargaining Power of Consumers
4.7.3 Threat of New Entrants
4.7.4 Threat of Substitutes
4.7.5 Intensity of Competitive Rivalry
5 Market Size & Growth Forecasts
5.1 By Feedstock
5.1.1 Agricultural Residues
5.1.2 Livestock Manure
5.1.3 Sewage Sludge
5.1.4 Food and Beverage Waste
5.1.5 Energy Crops
5.2 By Process Technology
5.2.1 Wet Anaerobic Digestion
5.2.2 Dry Anaerobic Digestion
5.2.3 Landfill Gas Recovery
5.3 By Plant Capacity
5.3.1 Below 0.5 MW
5.3.2 0.5 to 2 MW
5.3.3 Above 2 MW
5.4 By Application
5.4.1 Electricity Generation
5.4.2 Heat Generation
5.4.3 Vehicle Fuel/RNG
5.4.4 Combined Heat and Power (CHP)
5.5 By Geography
5.5.1 North America
5.5.1.1 United States
5.5.1.2 Canada
5.5.1.3 Rest of North America
5.5.2 Europe
5.5.2.1 Germany
5.5.2.2 United Kingdom
5.5.2.3 Italy
5.5.2.4 France
5.5.2.5 Czech Republic
5.5.2.6 Rest of Europe
5.5.3 Asia Pacific
5.5.3.1 China
5.5.3.2 Japan
5.5.3.3 Thailand
5.5.3.4 South Korea
5.5.3.5 Malaysia
5.5.3.6 Indonesia
5.5.3.7 Australia
5.5.3.8 Rest of Asia Pacific
5.5.4 South America
5.5.4.1 Brazil
5.5.4.2 Argentina
5.5.4.3 Chile
5.5.4.4 Rest of South America
5.5.5 Middle East and Africa
5.5.5.1 Israel
5.5.5.2 Iran
5.5.5.3 South Africa
5.5.5.4 Egypt
5.5.5.5 Rest of Middle East and Africa
6 Competitive Landscape
6.1 Market Concentration
6.2 Strategic Moves (M&A, Partnerships, PPAs)
6.3 Market Share Analysis (Market Rank/Share for key companies)
6.4 Company Profiles (includes Global level Overview, Market level overview, Core Segments, Financials as available, Strategic Information, Products & Services, and Recent Developments)
6.4.1 Engie SA
6.4.2 DMT International
6.4.3 IES Biogas
6.4.4 EnviTec Biogas AG
6.4.5 Weltec Biopower GmbH
6.4.6 Hitachi Zosen Inova AG
6.4.7 AEV Energy GmbH
6.4.8 AAT Abwasser- und Abfalltechnik GmbH
6.4.9 BEKON GmbH
6.4.10 Nijhuis Saur Industries
6.4.11 Xebec Adsorption Inc.
6.4.12 Bright Renewables BV
6.4.13 Scandinavian Biogas Fuels International AB
6.4.14 Naskeo Environnement
6.4.15 PlanET Biogas Group
6.4.16 BTS Biogas SRL
6.4.17 BioConstruct GmbH
6.4.18 Wärtsilä Corporation
6.4.19 Greenlane Renewables Inc.
6.4.20 Clarke Energy
7 Market Opportunities & Future Outlook
7.1 White-space & Unmet-need Assessment