Agrivoltaics - Market Share Analysis, Industry Trends & Statistics, Growth Forecasts (2026 - 2031)
アグリボルタイクス市場レポートは、システム設計(ダイナミックパネルおよび固定パネル)、テクノロジー(単面、両面、および半透明)、作物(果物、野菜、およびその他)、配置(温室、地上設置型、および遮光ネット)、用途(草地農業、園芸および耕作、屋内農業など)、および地理(北米、ヨーロッパ、アジア太平洋、南米、および中東およびアフリカ)別にセグメント化されています。
The Agrivoltaics Market Report is Segmented by System Design (Dynamic Panel and Fixed Panel), Technology (Monofacial, Bifacial, and Translucent), Crop (Fruits, Vegetables, and Others), Placement (Greenhouses, Ground Mounted, and Shading Nets), Application (Grassland Farming, Horticulture and Arable Farming, Indoor Farming, and More), and Geography (North America, Europe, Asia-Pacific, South America, and Middle East and Africa).
| 出版 | Mordor Intelligence |
| 出版年月 | 2026年02月 |
| ページ数 | 150 |
| 価格 | 記載以外のライセンスについてはお問合せください |
| シングルユーザ | USD 4,750 |
| 種別 | 英文調査報告書 |
| 商品番号 | SMR-13444 |

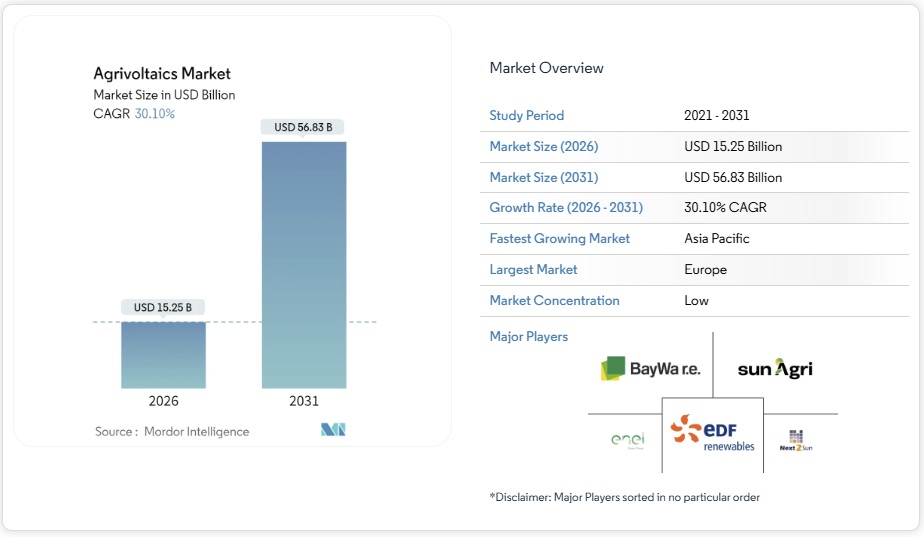
アグリボルタイクス(農業用ボルタイクス)市場は2025年に117億2,000万米ドル規模となり、2026年は152億5,000万米ドルになることが見込まれ、026年から2031年にかけて年平均成長率30.1%で成長し、2031年には568億3,000万米ドルに達するとMordor Intelligenceでは予測しています。
Mordor Intelligence(モードーインテリジェンス)「アグリボルタイクス – 市場シェア分析、業界動向と統計、成長予測 2026-2031年 – Agrivoltaics – Market Share Analysis, Industry Trends & Statistics, Growth Forecasts (2026 – 2031)」は営農型太陽光発電とも呼ばれるアグリボルタイクスの世界市場を調査し、主要セグメント別に分析・予測を行っています。
調査対象セグメント
- システム設計
- ダイナミックパネル
- 据置型ソーラーパネル
- 技術
- 単面型
- 両面型
- 半透明型
- 作物
- 果物
- 野菜
- その他
- 設置場所
- 温室
- 地上設置型
- 遮光ネット
- 用途
- 草地栽培
- 園芸・耕作
- 屋内栽培
- 花粉媒介者の生息地
- 地域
- 北米
- 米国
- カナダ
- メキシコ
- 欧州
- ドイツ
- 英国
- フランス
- イタリア
- 北欧諸国
- ロシア
- その他の欧州
- アジア太平洋地域
- 中国
- インド
- 日本
- 韓国
- ASEAN諸国
- その他のアジア太平洋地域
- 南米
- ブラジル
- アルゼンチン
- その他の南米
- 中東&アフリカ
- サウジアラビア
- アラブ首長国連邦(UAE)
- 南アフリカ
- エジプト
- その他の中東&アフリカ
- 北米
この軌道は、土地利用経済の根本的な変化に起因しています。作物と電力からの二重の収入源は、従来の太陽光発電に比べて15~25%の資本プレミアムを正当化するようになりました。中国が水産養殖、畑作物、家畜を商業規模で統合する500以上のプロジェクトを展開したことを受けて、アジア太平洋地域は2024年の収益の69.19%を占めています。欧州では、生産性の高い農地での大規模アレイ設置を禁止する一方で、高架式の二重利用システムは適用除外とする規制の下で太陽光発電が加速しています。一方、北米では、農業活動を維持するマルチギガワット規模の事業が急速に推進されています。現在の展開では、両面モジュール、固定傾斜式ラック、地上設置型レイアウトが主流ですが、精密農業データによって従来の太陽光発電では実現できない収穫量増加と節水効果が定量化されるにつれて、ダイナミックトラッカー、温室屋根、半透明ラミネートが急速に普及しています。
セグメント分析
- 固定傾斜型アレイは、そのシンプルさと耐久性から、2025年には農業用太陽光発電市場の69.62%のシェアを占めました。動的追尾型は、ハードウェア価格が8~12%に低下する中で、年平均成長率31.25%で成長しています。動的追尾型は、太陽光の角度を最適化し、霜が降りやすい果樹園に可変遮光を提供します。フラウンホーファーISEの軽量で作物に取り付け可能なモジュールは、精密農業機器と連携した次世代設計の先駆けです。動的追尾型は、ベリーやレタスなどの高付加価値分野で既に利用されており、市場モデルによると、2030年までにシェア35~40%に達すると予想されています。
- 草地放牧では、季節調整なしに均一な日陰が飼料品質を向上させるため、固定配置が依然として主流となっています。トラッカーの運用・保守コストが低下し、リアルタイムの農業制御が拡大するにつれ、生産者は、作物や家畜の特定の要件に合わせてパネルの可動性を調整できるバランスの取れた設計ミックスを期待しており、アグリボルタイクス市場における資本ギャップはさらに縮小しています。
- 両面発電モジュールは2025年の出荷量の74.52%を占め、年平均成長率(CAGR)31.02%で成長しています。中国における量産と垂直設置型の急速な普及により、両面発電アレイは作物の葉、土壌、雪などから裏面からの光を吸収できるようになり、追加の土地を必要とせずに1ヘクタールあたりのkWh出力を増加させることができます。英国でのフィールドテストでは、垂直設置型の単面発電モジュールと比較して1日あたり7.87%高い出力、傾斜設置型の単面発電モジュールと比較して25.38%高い出力が記録され、その性能優位性が実証されました。
- 単面受光型パネルは依然として低アルベド地域で使用されていますが、パリティ価格設定により、2028年までに新規農業用太陽光発電設備のすべてが両面受光型パネルに移行する可能性があります。5~5.5%の光利用効率を実現する半透明ラミネートは、温室でPAR光需要と電力自給のバランスをとる上で注目を集めています。技術ロードマップでは、タンデムペロブスカイト-シリコン両面受光型セルが予測されており、モジュール効率は30%を超え、農業用太陽光発電市場における1エーカー当たりの規模優位性がさらに高まります。
- アグリボルタイクス市場レポートは、システム設計(ダイナミックパネルおよび固定パネル)、テクノロジー(単面、両面、および半透明)、作物(果物、野菜、およびその他)、配置(温室、地上設置型、および遮光ネット)、用途(草地農業、園芸および耕作、屋内農業など)、および地理(北米、ヨーロッパ、アジア太平洋、南米、および中東およびアフリカ)別にセグメント化されています。
Agrivoltaics Market Analysis
Agrivoltaics market size in 2026 is estimated at USD 15.25 billion, growing from 2025 value of USD 11.72 billion with 2031 projections showing USD 56.83 billion, growing at 30.1% CAGR over 2026-2031.
This trajectory stems from a fundamental shift in land-use economics: dual revenue streams from crops and electricity now warrant a 15-25% capital premium over conventional solar. Asia-Pacific holds 69.19% of 2024 revenue after China deployed more than 500 projects that integrate aquaculture, field crops, and livestock at a commercial scale. Europe accelerates under mandates that prohibit utility-scale arrays on productive farmland yet exempt elevated dual-use systems, while North America fast-tracks multi-gigawatt ventures that preserve farming operations. Bifacial modules, fixed-tilt racking, and ground-mounted layouts dominate current rollouts, but dynamic trackers, greenhouse roofs, and semi-transparent laminates are growing rapidly as precision agriculture data quantifies yield gains and water savings that conventional photovoltaics cannot deliver.
Global Agrivoltaics Market Trends and Insights
Subsidy-linked Feed-in Tariffs Widen Adoption
Dedicated feed-in tariffs guarantee cash flows that offset the 15-20% capital premium over ground-mount arrays. Italy’s incentive covering 1.04 GW by 2026 catalyzes farmer-led ventures rather than pure-utility procurement. France followed with a 450 MW cooperative project driven by 35 growers. Japan’s 2040 renewables road map prioritizes rooftop and agrivoltaic capacity, reinforcing long-run policy visibility. Early projects create performance data that lowers subsequent risk premiums, creating a virtuous adoption cycle across Europe and Asia-Pacific.
Declining Bifacial Module Prices Lift Returns
Global bifacial module costs have fallen 25-30% since 2024, raising energy density without raising land costs. Yield gains of 15-25% over monofacial panels, enhanced by snow albedo in cold climates, strengthen project economics. China’s 200 GW of 2024 bifacial capacity underpins further price compression, and vertical bifacial arrays in the United Kingdom show 25.38% output gains over tilted systems. The cost trajectory suggests grid-parity agrivoltaics within three to five years, even in high-value farmland.
High Capital Expenditure Limits Early Projects
Elevated mounting structures and wider row spacing raise project capex by 15-25% versus ground-mount solar. Financing hurdles persist as lenders gauge combined crop and power revenues, although German analyses show diversified annual profits of EUR 15,000-235,000 by farm scale. Learning-curve savings from bifacial and tracking adoption are expected to reach parity by 2027.
Other drivers and restraints analyzed in the detailed report include:
- Dual-use Land Mandates Spur Structural Demand
- Crop Micro-climate Yield Premiums Validate Value
- Unclear Zoning Frameworks Slow Permitting
For complete list of drivers and restraints, kindly check the Table Of Contents.
Segment Analysis
Fixed-tilt arrays held 69.62% of the agrivoltaics market share in 2025, due to their simplicity and durability. Dynamic trackers are growing at a 31.25% CAGR as hardware premiums narrow to 8-12%; they optimize sun angles and offer variable shading for frost-prone orchards. Fraunhofer ISE’s lightweight, crop-mounted modules signal next-generation designs that align with precision-farming equipment. Dynamic installations are already serving high-value segments, such as berries and lettuce, and market models suggest they can reach a 35-40% share by 2030.
Fixed configurations still dominate grassland grazing, where uniform shade enhances forage quality without seasonal adjustments. As tracker O&M costs decrease and real-time agronomic control expands, producers expect a balanced design mix that tailors panel mobility to specific crop or livestock requirements, further reducing the capital gap for the agrivoltaics market.
Bifacial modules commanded 74.52% of 2025 shipments and are advancing at 31.02% CAGR. Mass production in China and the rapid diffusion of vertical racking enable bifacial arrays to harvest light from the rear side, such as from crop canopies, soil, or snow, thereby increasing kWh per hectare without requiring additional land. UK field tests record 7.87% higher daily output than vertical monofacial setups and 25.38% better than tilted monofacial baselines, validating the performance edge.
Monofacial panels remain in low-albedo areas, but parity pricing may flip all new agrivoltaic capacity to bifacial by 2028. Semi-transparent laminates, which deliver 5-5.5% light utilization efficiency, are gaining traction for greenhouses, balancing PAR light needs with electrical autonomy. Technology roadmaps foresee tandem perovskite-silicon bifacial cells, enabling module efficiencies of over 30%, thereby amplifying the agrivoltaics market size advantage per acre.
The Agrivoltaics Market Report is Segmented by System Design (Dynamic Panel and Fixed Panel), Technology (Monofacial, Bifacial, and Translucent), Crop (Fruits, Vegetables, and Others), Placement (Greenhouses, Ground Mounted, and Shading Nets), Application (Grassland Farming, Horticulture and Arable Farming, Indoor Farming, and More), and Geography (North America, Europe, Asia-Pacific, South America, and Middle East and Africa).
Geography Analysis
Asia-Pacific retained 68.70% of global revenue during 2025, propelled by China’s 500-plus operational sites spanning aquaculture, rice paddies, and goat pastures. Shandong’s fish-pond systems increased shrimp yields by 50% while converting idle water surfaces into power plants. Japan mandates dual-use models to achieve its 40-50% renewable electricity goal by 2040, financing sheltered rooftop and farmland arrays. India’s low-cost steel canopies suit smallholder plots, while South Korea quantifies biofuel potential from agri-PV integration.
Europe is the fastest-growing region at a 31.60% CAGR. Italy’s ban on ground-mount solar panels over fertile soil, coupled with a EUR 1.7 billion incentive fund, is funneling developers into agrivoltaics. France’s Terr’Arbouts, covering 7 km² with 35 farmer partners, and Germany’s SUNfarming-SPIE 753 MW park illustrate scale readiness. Snow-rich Nordic nations exploit bifacial rear-side gains during low-sun winters, reinforcing continental momentum.
North America scales via mixed-use mega-sites. Ohio’s 800 MW solar-plus-300 MW storage complex reserves two-thirds of the acreage for crops, signaling regulatory acceptance. Vermont’s vertical design retains 90% farmland utility. The Federal LASSO Prize funding combines cattle grazing with solar energy, and the USDA–DOE research alliance generates agronomic datasets that mitigate risk and increase capital inflows. Mexico’s indigenous pilot arrays demonstrate that agrivoltaics can reduce diesel pump costs and enhance maize yields in marginalized communities.
South America and the Middle East & Africa remain nascent. Colombia’s early-stage sites and Qatar’s semi-transparent lettuce greenhouses highlight exploratory but promising footholds. These regions may experience cost declines post-2027, mirroring the diffusion curves of rooftop solar.
List of Companies Covered in this Report:
- Sun’Agri
- Enel Green Power
- BayWa r.e.
- Fraunhofer ISE
- Next2Sun
- Insolight
- REM TEC
- Kyocera Corporation
- Acciona Energía
- EDF Renewables
- Zimmermann PV-Stahlbau
- Scatec ASA
- Arava Power Company
- Ameresco
- ENGIE SA
- R.Power Group
- TNO
- Hevel Solar
- Local Agri-solar Cooperatives
Additional Benefits:
- The market estimate (ME) sheet in Excel format
- 3 months of analyst support
Global Agrivoltaics Market Report Scope
- By System Design
- Dynamic Panel
- Fixed Panel
- By Technology
- Monofacial
- Bifacial
- Translucent
- By Crop
- Fruits
- Vegetables
- Others
- By Placement
- Greenhouses
- Ground Mounted
- Shading Nets
- By Application
- Grassland Farming
- Horticulture and Arable Farming
- Indoor Farming
- Pollinator Habitat
- By Geography
- North America
- United States
- Canada
- Mexico
- Europe
- Germany
- United Kingdom
- France
- Italy
- NORDIC Countries
- Russia
- Rest of Europe
- Asia-Pacific
- China
- India
- Japan
- South Korea
- ASEAN Countries
- Rest of Asia-Pacific
- South America
- Brazil
- Argentina
- Rest of South America
- Middle East and Africa
- Saudi Arabia
- United Arab Emirates
- South Africa
- Egypt
- Rest of Middle East and Africa
- North America
Table of Contents
1 Introduction
1.1 Study Assumptions & Market Definition
1.2 Scope of the Study
2 Research Methodology
3 Executive Summary
4 Market Landscape
4.1 Market Overview
4.2 Market Drivers
4.2.1 Subsidy-linked FiT programs (EU, Asia)
4.2.2 Declining bifacial PV module prices
4.2.3 Dual-use land mandates in land-scarce nations
4.2.4 Crop micro-climate yield premiums Over 10 %
4.2.5 Carbon-credit stacking in agri-solar PPAs
4.2.6 Ag insurance discounts for shade-reduced evapotranspiration
4.3 Market Restraints
4.3.1 High capex vs. ground-mount PV
4.3.2 Unclear agri-zoning regulations
4.3.3 Module soiling from crop residues
4.3.4 Agronomic-PV labor skill gap
4.4 Supply-Chain Analysis
4.5 Regulatory Landscape
4.6 Technological Outlook
4.7 Porter’s Five Forces
4.7.1 Threat of New Entrants
4.7.2 Bargaining Power of Buyers
4.7.3 Bargaining Power of Suppliers
4.7.4 Threat of Substitutes
4.7.5 Competitive Rivalry
5 Market Size & Growth Forecasts
5.1 By System Design
5.1.1 Dynamic Panel
5.1.2 Fixed Panel
5.2 By Technology
5.2.1 Monofacial
5.2.2 Bifacial
5.2.3 Translucent
5.3 By Crop
5.3.1 Fruits
5.3.2 Vegetables
5.3.3 Others
5.4 By Placement
5.4.1 Greenhouses
5.4.2 Ground Mounted
5.4.3 Shading Nets
5.5 By Application
5.5.1 Grassland Farming
5.5.2 Horticulture and Arable Farming
5.5.3 Indoor Farming
5.5.4 Pollinator Habitat
5.6 By Geography
5.6.1 North America
5.6.1.1 United States
5.6.1.2 Canada
5.6.1.3 Mexico
5.6.2 Europe
5.6.2.1 Germany
5.6.2.2 United Kingdom
5.6.2.3 France
5.6.2.4 Italy
5.6.2.5 NORDIC Countries
5.6.2.6 Russia
5.6.2.7 Rest of Europe
5.6.3 Asia-Pacific
5.6.3.1 China
5.6.3.2 India
5.6.3.3 Japan
5.6.3.4 South Korea
5.6.3.5 ASEAN Countries
5.6.3.6 Rest of Asia-Pacific
5.6.4 South America
5.6.4.1 Brazil
5.6.4.2 Argentina
5.6.4.3 Rest of South America
5.6.5 Middle East and Africa
5.6.5.1 Saudi Arabia
5.6.5.2 United Arab Emirates
5.6.5.3 South Africa
5.6.5.4 Egypt
5.6.5.5 Rest of Middle East and Africa
6 Competitive Landscape
6.1 Market Concentration
6.2 Strategic Moves (M&A, Partnerships, PPAs)
6.3 Market Share Analysis (Market Rank/Share for key companies)
6.4 Company Profiles (includes Global level Overview, Market level overview, Core Segments, Financials as available, Strategic Information, Products & Services, and Recent Developments)
6.4.1 Sun’Agri
6.4.2 Enel Green Power
6.4.3 BayWa r.e.
6.4.4 Fraunhofer ISE
6.4.5 Next2Sun
6.4.6 Insolight
6.4.7 REM TEC
6.4.8 Kyocera Corporation
6.4.9 Acciona Energía
6.4.10 EDF Renewables
6.4.11 Zimmermann PV-Stahlbau
6.4.12 Scatec ASA
6.4.13 Arava Power Company
6.4.14 Ameresco
6.4.15 ENGIE SA
6.4.16 R.Power Group
6.4.17 TNO
6.4.18 Hevel Solar
6.4.19 Local Agri-solar Cooperatives
7 Market Opportunities & Future Outlook
7.1 White-Space & Unmet-Need Assessment