Acoustic Camera - Market Share Analysis, Industry Trends & Statistics, Growth Forecasts (2026 - 2031)
The Acoustic Camera Market Report is Segmented by Array Type (2-D Arrays and More), Measurement Type (Near-Field and More), Frequency Band (Low-Frequency Below 10 KHz and More), Deployment Platform (Hand-Held, Tripod/Fixed-mount, and More), Application (Noise Source Identification, and More), End-User Industry (Automotive and Mobility, and More), and Geography.
音響カメラ市場レポートは、アレイタイプ(2Dアレイなど)、測定タイプ(近傍場など)、周波数帯域(10KHz未満の低周波など)、展開プラットフォーム(手持ち、三脚/固定マウントなど)、アプリケーション(騒音源の特定など)、エンドユーザー業界(自動車およびモビリティなど)、および地域別にセグメント化されています。
| 出版 | Mordor Intelligence |
| 出版年月 | 2026年02月 |
| ページ数 | 120 |
| 価格 | 記載以外のライセンスについてはお問合せください |
| シングルユーザ | USD 4,750 |
| 種別 | 英文調査報告書 |
| 商品番号 | SMR-14862 |

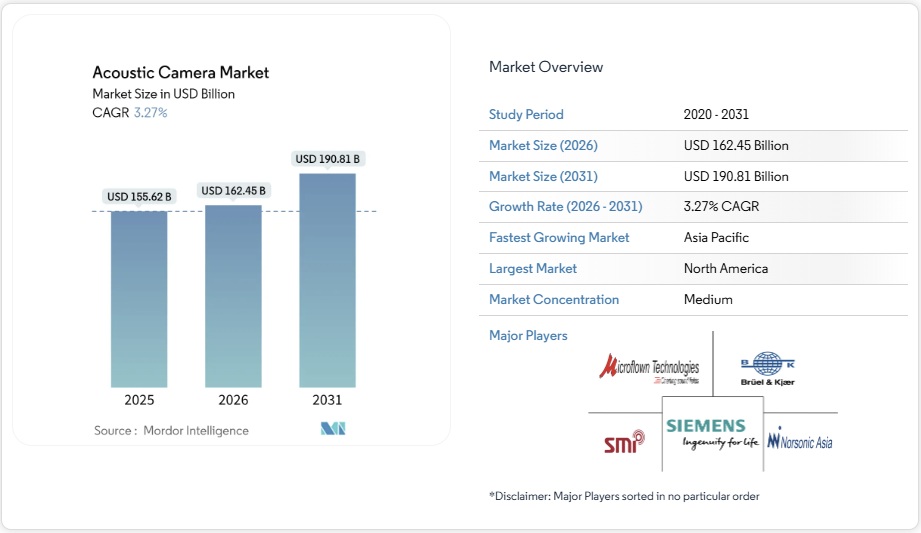
音響カメラ市場は、2025年の1,604億1,000万米ドルから2026年には1,657億3,000万米ドルに成長し、2026年から2031年にかけて年平均成長率(CAGR)3.32%で成長し、2031年には1,950億8,000万米ドルに達すると予測されています。MEMSマイクアレイのコスト削減と小型エッジAIプロセッサの登場により、システムの部品コストは5,000米ドルを下回り、音響画像処理は研究室から工場や街路へと移行しています。地方自治体は騒音規制カメラを導入し、自動車エンジニアは電気自動車のNVH(騒音・振動・ハーシュネス)試験をデジタル化し、公益企業はビームフォーミングモジュールと予知保全プラットフォームを組み合わせています。エッジアナリティクスは現在、デバイス上で実行されるため、クラウド帯域幅とレイテンシを削減すると同時に、リモート資産でのユースケースを拡大しています。競争活動は規模ではなくアルゴリズムの効率性とソフトウェア エコシステムに集中しており、ニッチなイノベーターが多様なテスト機器の大手企業と肩を並べることができます。
セグメント分析
- 2Dアーキテクチャは、実証済みの信頼性と低価格により、2025年も音響カメラ市場の52.40%のシェアを維持しました。これらは、工場のリーク調査や自動車部品の点検において主流となっています。一方、3Dユニットは、車内騒音マッピング、都市型空中移動試験、複雑な機械筐体における全音場定位の要求に伴い、16.03%のCAGRで成長しています。192個のマイクを搭載したOctagonシステムは、20Hzから10kHzの帯域にわたる分解能を備えています。MEMSコストの低下に伴い、3Dプラットフォーム向け音響カメラ市場は、主流の製品との差を縮めると予想されています。人工知能(AI)によるパターン認識はヒット率を向上させ、より小さな開口部でも従来の性能に匹敵する性能を実現しています。システムインテグレーターはCADダッシュボードにリアルタイムの可視化機能を組み込むことで、エンジニアは音響処理を数日ではなく数分で反復処理できます。このワークフローの短縮は、航空宇宙分野や高級車分野でのプレミアム価格を正当化しています。プロトタイプの 3D アレイは 2024 年に 60,000 米ドル未満で出荷され、中堅サプライヤーや大学の研究室でより広く採用される軌道を示しています。
- 明確な基準と管理された環境のおかげで、近距離場セットアップは2025年に売上高の60.30%を占めました。チャンバー試験、ギアボックス分析、ベンチトップR&Dは依然として主要なユースケースです。遠距離場の需要は、風力タービンの騒音監査、スマートシティのサウンドマッピング、航空機の通過試験などに伴い、年平均成長率14.55%で増加しています。最小分散歪み応答アルゴリズムは、交通量の多い背景でも50m以上離れた音源を分離できるようになりました。その結果、長距離システム向け音響カメラ市場規模は2031年までに倍増すると予測されています。インフラ管理者は、音響指標を施設の設計図に重ねて表示する地理空間ダッシュボードにデータを統合し、修理要員を迅速に派遣できるようにしています。
- 現場オペレーターは、IP65以上の堅牢な筐体と、4GまたはLoRaWAN経由でアラートを中継する低消費電力のエッジプロセッサを重視しています。設置の容易さとクラウドAPIを重視するベンダーは、自治体の入札や再生可能エネルギー発電所の入札で優位に立っています。
- 音響カメラ市場は、アレイタイプ(2Dアレイ、3Dアレイ)、測定タイプ(近距離場、遠距離場)、アプリケーション(ノイズ源特定、リーク検出など)、エンドユーザー産業(自動車およびモビリティなど)、地域別にセグメント化されています。
Acoustic Camera Market Analysis
The acoustic camera market is expected to grow from USD 160.41 billion in 2025 to USD 165.73 billion in 2026 and is forecast to reach USD 195.08 billion by 2031 at 3.32% CAGR over 2026-2031. Cost reductions in MEMS microphone arrays and the arrival of compact edge-AI processors have lowered system bills-of-materials below USD 5,000, moving acoustic imaging from research laboratories into factory floors and city streets. Municipal authorities are deploying noise-enforcement cameras, automotive engineers are digitizing NVH testing for electric vehicles, and utilities are pairing beamforming modules with predictive-maintenance platforms. Edge analytics now runs on-device, trimming cloud bandwidth and latency while widening use cases in remote assets. Competitive activity centers on algorithm efficiency and software ecosystems rather than scale, allowing niche innovators to stand alongside diversified test-instrument majors.
Global Acoustic Camera Market Trends and Insights
Tightening Global Urban-Noise Regulations
Municipal agencies are moving from point sound-level meters to spatial imaging that links violations to individual vehicles. European and North American cities installed camera-based noise radars during 2024, and solutions such as SoundVue deliver Class 1 accuracy that satisfies legal-evidence requirements. The European Union targets a 30% cut in transport noise by 2030, spurring long-term procurement of rugged outdoor acoustic cameras. Preference is shifting toward permanent roadside units over mobile trailers, anchoring multi-year hardware demand and service contracts.
Rapid NVH Digitalization in E-Mobility Platforms
Electric powertrains silence combustion masking, unveiling tonal signatures from motors, inverters, and HVAC ducts. Automakers boosted acoustic test budgets during 2024; Hyundai adopted 3-D scanning rigs for full interior mapping. Real-time beamforming lets engineers visualize radiation patterns under actual driving, closing corrective loops before start-of-production. Growing fleets of commercial vans and city buses adopt the same methodologies to meet comfort and regional noise-homologation rules.
High Upfront Capex for 3-D MEMS-Array Rigs
Research-grade 3-D configurations can exceed USD 100,000 because hundreds of phase-matched microphones, precision housings, and high-bandwidth converters raise material and assembly costs. Optical MEMS microphones now deliver 80 dB SNR, yet process tooling and yield learning curves postpone sweeping price drops. Small enterprises lean on shared-service laboratories or rent 3-D systems until modular arrays below USD 50,000 proliferate.
Other drivers and restraints analyzed in the detailed report include:
- Shift from Handheld Sound-Level Meters to Imaging Sensors on Smart Factories
- Rising Aerospace Cabin-Comfort Certification Thresholds
- Scarcity of Field-Calibration Standards Across Regions
For complete list of drivers and restraints, kindly check the Table Of Contents.
Segment Analysis
2-D architectures retained 52.40% share of the acoustic camera market in 2025 owing to proven reliability and lower pricing. They dominate plant leak surveys and automotive component checks. Meanwhile, 3-D units are moving at a 16.03% CAGR as cabin noise mapping, urban-air-mobility trials, and complex machinery enclosures call for full-volume localization. The Octagon system with 192 microphones demonstrates resolution across 20 Hz to 10 kHz bands. As MEMS costs ease, the acoustic camera market size for 3-D platforms is expected to close the gap with mainstream options. Artificial-intelligence pattern recognition is improving hit rates, allowing smaller apertures to match legacy performance.System integrators embed real-time visualization within CAD dashboards, so engineers iterate acoustic treatments in minutes rather than days. This workflow compression justifies premiums in aerospace and luxury vehicle segments. Prototype 3-D arrays shipped in 2024 at under USD 60,000, signalling a trajectory toward broader adoption among mid-tier suppliers and university labs.
Near-field setups commanded 60.30% revenue in 2025 thanks to clear standards and controlled environments. Chamber testing, gearbox analysis, and benchtop RandD remain anchor use cases. Far-field demand is climbing at a 14.55% CAGR in step with wind turbine noise audits, smart city sound mapping, and aircraft pass-by trials. Minimum variance distortion less response algorithms now separate sources more than 50 m away despite heavy background traffic. As a result, the acoustic camera market size for long-range systems is projected to double through 2031. Infrastructure managers integrate data into geospatial dashboards that overlay acoustic metrics on facility blueprints for quick dispatch of repair crews.
Field operators value rugged enclosures rated IP65 or higher and low-power edge processors that relay alerts over 4G or LoRaWAN. Vendors emphasizing ease of installation and cloud APIs are winning bids in municipal tenders and renewable-energy farms.
The Acoustic Camera Market Segmented by Array Type (2-D Arrays, 3-D Arrays), Measurement Type (Near-Field, Far-Field), Application (Noise Source Identification, Leak Detection and More), End-User Industry (Automotive & Mobility and More), Geography. The Market Forecasts are Provided in Terms of Value (USD).
Geography Analysis
Europe held 30.60% of the acoustic camera market in 2025, anchored by stringent environmental regulations and a sophisticated automotive supply chain. German OEMs run full-vehicle NVH programs that cascade camera data into digital twins, while French municipalities engage multi-year urban noise-camera pilots to secure 30% transport noise cuts by 2030. Funding instruments from Horizon Europe accelerate academic-industry consortia that refine 3-D beamforming software.APAC is set for a 14.08% CAGR. China legislated acoustic vehicle alerting systems under GB/T 37153-2018, pushing tier-one suppliers to validate loudspeaker signatures with imaging tools. Smart-city programs in Shenzhen and Singapore embed permanent acoustic mapping nodes at intersections. Japanese electronics plants, known for Six Sigma quality, fit cameras over pick-and-place lines to catch vacuum-leak hiss, driving consistent regional orders. India’s expanding metro-rail footprint is specifying acoustic leak detection on compressed-air braking systems.
North America retains an influential role as aerospace primes comply with FAA noise certification and as OSHA broadens exposure guidelines. Industrial end users integrate acoustic cameras with vibration, thermal, and power-quality sensors in unified dashboards. Oil and gas producers in the Gulf Coast mount cameras on robotic crawlers for storage tank inspections, mitigating confined-space entry risks.South America and the Middle East and Africa form nascent but promising territories. Mining operators in Chile test portable imagers to pinpoint vent fan resonance, while Gulf utilities trial cameras for desert power-line inspections where visual drones struggle with glare and sand. Uptake here is expected to trail advanced regions by two to three years yet remains additive to global volumes.
List of Companies Covered in this Report:
- Hottinger Brel and Kjr Sound and Vibration Measurement A/S
- gfai tech GmbH
- Teledyne FLIR LLC
- SM Instruments Inc.
- Fluke Corporation
- CAE Software and Systems GmbH
- Norsonic AS
- Microflown Technologies BV
- SINUS Messtechnik GmbH
- Sorama BV
- Polytec GmbH
- Visisonics Corporation
- Signal Interface Group LLC
- NL Acoustics Oy
- Ziegler-Instruments GmbH
- Siemens Digital Industries Software
Additional Benefits:
- The market estimate (ME) sheet in Excel format
- 3 months of analyst support
Table of Contents
1 INTRODUCTION
1.1 Study Assumptions and Market Definition
1.2 Scope of the Study
2 RESEARCH METHODOLOGY
3 EXECUTIVE SUMMARY
4 MARKET LANDSCAPE
4.1 Market Overview
4.2 Market Drivers
4.2.1 Tightening global urban-noise regulations
4.2.2 Rapid NVH digitalisation in e-mobility platforms
4.2.3 Shift from handheld sound-level meters to imaging sensors on smart factories
4.2.4 Rising aerospace cabin-comfort certification thresholds
4.2.5 Edge-AI beamforming modules enable sub-$5 k BOM acoustic cameras*
4.2.6 Integration into autonomous-robot inspection payloads*
4.3 Market Restraints
4.3.1 High upfront capex for 3D MEMS-array rigs
4.3.2 Scarcity of field-calibration standards across regions
4.3.3 Patent thickets around delay-and-sum beam-forming IP*
4.3.4 Limited ruggedised options for harsh-weather utilities*
4.4 Value / Supply-Chain Analysis
4.5 Regulatory Landscape
4.6 Technological Outlook
4.7 Porter’s Five Forces Analysis
4.7.1 Threat of New Entrants
4.7.2 Bargaining Power of Buyers
4.7.3 Bargaining Power of Suppliers
4.7.4 Threat of Substitutes
4.7.5 Competitive Rivalry
5 MARKET SIZE AND GROWTH FORECASTS (VALUE)
5.1 By Array Type
5.1.1 2-D Arrays
5.1.2 3-D Arrays
5.2 By Measurement Type
5.2.1 Near-Field
5.2.2 Far-Field
5.3 By Application
5.3.1 Noise Source Identification
5.3.2 Leak Detection
5.3.3 Mechanical Fault Diagnostics
5.3.4 Others (Bio-acoustics, RandD)
5.4 By End-user Industry
5.4.1 Automotive and Mobility
5.4.2 Aerospace and Defense
5.4.3 Electronics and Semiconductor
5.4.4 Energy and Power
5.4.5 Other Industries
5.5 By Geography
5.5.1 North America
5.5.1.1 United States
5.5.1.2 Canada
5.5.2 Europe
5.5.2.1 Germany
5.5.2.2 United Kingdom
5.5.2.3 France
5.5.2.4 Rest of Europe
5.5.3 Asia-Pacific
5.5.3.1 China
5.5.3.2 Japan
5.5.3.3 India
5.5.3.4 Rest of Asia-Pacific
5.5.4 Middle East and Africa
5.5.4.1 United Arab Emirates
5.5.4.2 Saudi Arabia
5.5.4.3 South Africa
5.5.4.4 Rest of Middle East and Africa
5.5.5 South America
5.5.5.1 Brazil
5.5.5.2 Argentina
5.5.5.3 Rest of South America
6 COMPETITIVE LANDSCAPE
6.1 Market Concentration
6.2 Strategic Moves
6.3 Market Share Analysis
6.4 Company Profiles (includes Global level Overview, Market level overview, Core Segments, Financials as available, Strategic Information, Market Rank/Share, Products and Services, Recent Developments)
6.4.1 Hottinger Brel and Kjr Sound and Vibration Measurement A/S
6.4.2 gfai tech GmbH
6.4.3 Teledyne FLIR LLC
6.4.4 SM Instruments Inc.
6.4.5 Fluke Corporation
6.4.6 CAE Software and Systems GmbH
6.4.7 Norsonic AS
6.4.8 Microflown Technologies BV
6.4.9 SINUS Messtechnik GmbH
6.4.10 Sorama BV
6.4.11 Polytec GmbH
6.4.12 Visisonics Corporation
6.4.13 Signal Interface Group LLC
6.4.14 NL Acoustics Oy
6.4.15 Ziegler-Instruments GmbH
6.4.16 Siemens Digital Industries Software
7 MARKET OPPORTUNITIES AND FUTURE OUTLOOK
7.1 White-space and Unmet-Need Assessment