Robotaxi Market Size, Share & Trends Analysis Report
Robotaxi Market Size, Share & Trends Analysis Report By Propulsion Type, By Component Type, By Level of Autonomy, By Vehicle Type, By Service Type, By Application, By Region, And Segment Forecasts (2026 - 2033)
ロボタクシー市場規模、シェア、トレンド分析レポート:推進タイプ別、コンポーネントタイプ別、自律性レベル別、車両タイプ別、サービスタイプ別、用途別、地域別、予測(2026年~2033年)
| 出版 | Grand View Research |
| 出版年月 | 2026年01月 |
| ページ数 | 130 |
| 価格 | 記載以外のライセンスについてはお問合せください |
| シングルユーザ | USD 4,950 |
| 種別 | 英文調査報告書 |
| 商品番号 | SMR-8435 |

世界のロボタクシー市場規模は2025年に6億1,000万米ドルと推定され、2033年までに1,472億5,000万米ドルに達し、2026年から2033年にかけて99.1%のCAGRで成長すると予測されています。ロボタクシー業界の成長は、特にレベル4およびレベル5の自動化システムの開発に関する自律走行車(AV)技術の大きな進歩によって推進されています。
主要な市場動向と洞察
- ロボタクシー業界は北米が主導権を握り、2025年には90.0%のシェアを占めました。
- 米国のロボタクシー市場は2025年も圧倒的な地位を維持しました。
- 推進力別では、電気自動車セグメントが2025年に市場を支配し、市場シェアの84.9%を占めました。
- コンポーネント別では、LiDARセグメントが2025年に最大の市場シェアを占めました。
- 用途別では、乗客セグメントが2025年に最大の市場シェアを占めました。
このレポートは、世界、地域、国レベルでの収益成長を予測し、2021年から2033年までの各サブセグメントにおける最新の業界動向の分析を提供します。この調査のために、Grand View Researchは、推進タイプ、コンポーネントタイプ、自律性レベル、車両タイプ、サービスタイプ、用途、および地域に基づいて、世界のロボタクシー市場レポートをセグメント化しました。
Robotaxi Market Summary
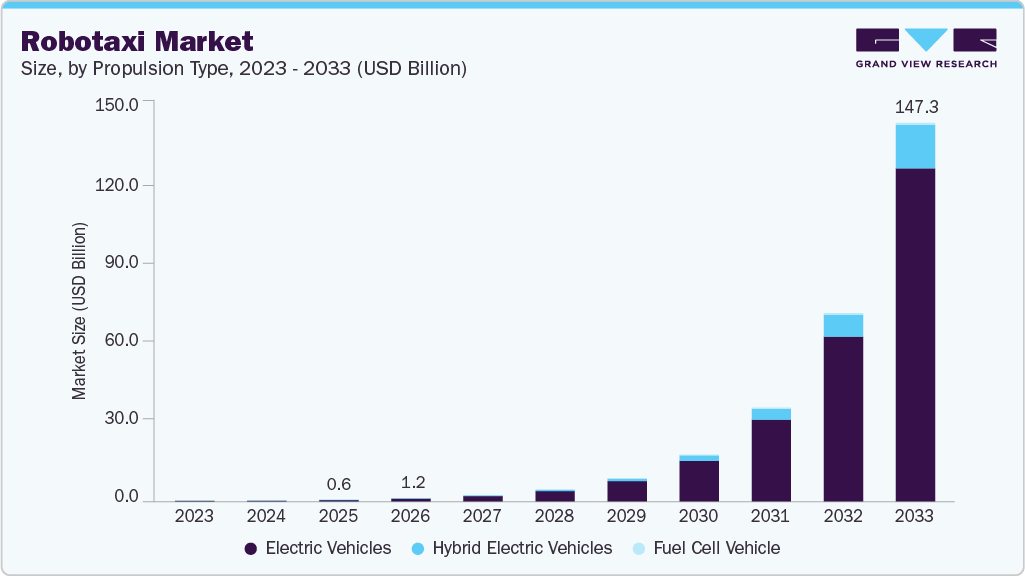
The global robotaxi market size was estimated at USD 0.61 billion in 2025 and is projected to reach USD 147.25 billion by 2033, growing at a CAGR of 99.1% from 2026 to 2033. The growth of the robotaxi industry is driven by significant advancements in autonomous vehicle (AV) technology, especially regarding the development of Level 4 and Level 5 automation systems.
Key Market Trends & Insights
- North America dominated the robotaxi industry and accounted for a share of 90.0% in 2025
- The U.S. robotaxi market held a dominant position in 2025.
- By propulsion type, the electric vehicles segment dominated the market in 2025, accounting for 84.9% of the market share.
- By component type, the LiDAR segment held the largest market share in 2025.
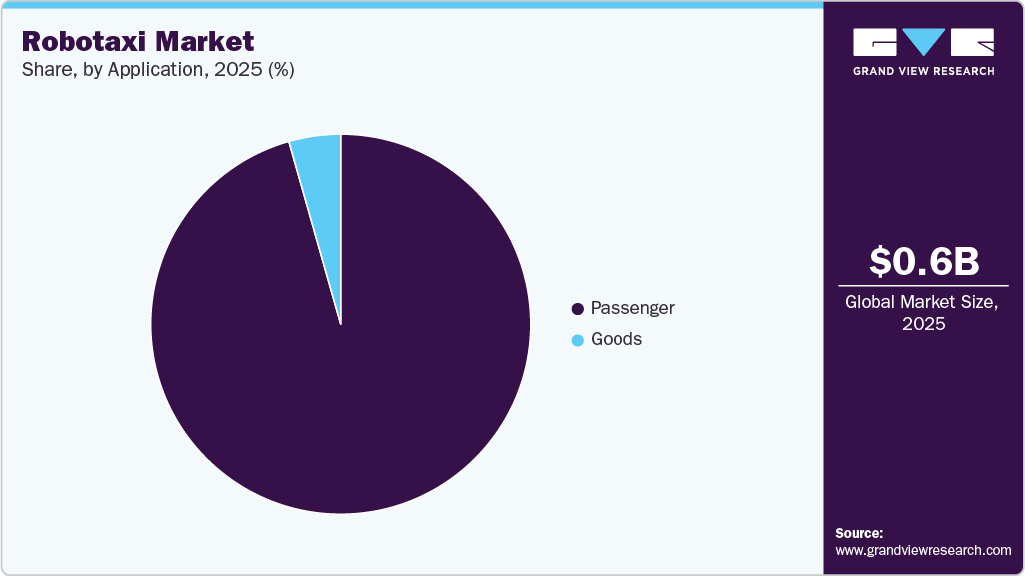
- By application, the passenger segment held the largest market share in 2025.
Market Size & Forecast
- 2025 Market Size: USD 0.61 Billion
- 2033 Projected Market Size: USD 147.25 Billion
- CAGR (2026-2033): 99.1%
- North America: Largest market in 2025
- Asia Pacific: Fastest growing market
One of the most pivotal trends in the robotaxi market is the rapid advancement of autonomous driving technology, particularly artificial intelligence, machine learning, LiDAR, radar, and high-resolution sensor fusion. These innovations significantly enhance a vehicle’s ability to perceive and navigate complex urban environments, improving safety, reliability, and operational efficiency. As AI algorithms become smarter through real-time data learning and predictive analytics, robotaxis can handle dynamic traffic scenarios with greater precision, reducing accidents and building consumer trust. Lower hardware costs for these critical systems are also making commercial robotaxi fleets more economically viable, enabling broader deployment in more cities worldwide.
The global shift toward shared mobility is driving the demand for robotaxis as part of broader Mobility-as-a-Service (MaaS) frameworks. Consumers, particularly in urban areas, are moving away from traditional car ownership toward flexible, on-demand transportation options. Robo-taxis provide a seamless user experience, including real-time vehicle booking, digital payments, and efficient routing. The convenience and cost-effectiveness of this model are especially attractive in congested cities where parking is limited, and traffic is a daily concern.
Rapid global urbanization and rising traffic congestion are strong catalysts for the adoption of robotaxis. Robo-taxis can be integrated into public transportation networks to provide first- and last-mile connectivity, enhancing urban mobility systems. MaaS platforms that incorporate robotaxis help reduce traffic volumes, lower emissions, and optimize transportation assets. As more cities implement digital mobility strategies, robotaxis are expected to play a critical role in creating smarter, user-centric transportation networks.
Supportive regulatory frameworks and government-led pilot programs are key drivers of growth for the robotaxi market. Countries such as the U.S., China, Germany, and the UAE are actively fostering environments that support the testing and deployment of autonomous vehicles. Regulations regarding data sharing, safety protocols, and liability management are evolving to meet the unique needs of autonomous ride-hailing. For example, California and Arizona in the U.S. have been pioneers in allowing real-world testing and limited commercial operations of robotaxis. Additionally, public-private partnerships are forming to develop smart infrastructure, including autonomous lanes, dedicated pickup zones, and vehicle-to-infrastructure (V2I) communication systems. Government incentives and grants are further promoting innovation in autonomous mobility. Although regulatory challenges remain in many areas, progress is being made toward the global harmonization of standards.
Robo-taxis are increasingly being developed as electric vehicles (EVs), aligning with global goals for cleaner transportation and reduced carbon emissions. Electrification offers dual benefits for fleet operators-lower fuel and maintenance costs, as well as compliance with tightening emission regulations in urban areas. As cities implement low-emission zones and net-zero mobility targets, electric robotaxis are emerging as ideal solutions for sustainable urban transit. Automakers and tech firms are designing battery-electric robotaxi models optimized for range, ride comfort, and fleet operation. Companies like Tesla, Hyundai, and GM are aligning their autonomous strategies with EV production to create a future-proof transportation model. Moreover, government subsidies for EVs and investments in charging infrastructure are facilitating the deployment of electric robotaxis. The synergy between autonomy and electrification not only enhances vehicle efficiency but also meets the growing consumer demand for environmentally responsible mobility options.
Propulsion Type Insights
The electric vehicles segment dominated the market in 2025, accounting for 84.9% of the market share. Electric vehicles (EVs) are the dominant propulsion type in the robotaxi Industry, driven by their alignment with global sustainability goals and the economic advantages they offer to fleet operators. EVs have significantly reduced operating costs by reducing fuel and maintenance requirements, making them highly suitable for high-usage, autonomous ride-hailing applications. Governments in key regions such as the U.S., China, and the EU are providing strong regulatory support in the form of tax incentives, emissions regulations, and investment in EV charging infrastructure. Technological advancements in battery performance, such as increased range, faster charging, and longer lifecycles, have further enhanced the viability of electric robotaxis for continuous urban operations. As cities strive for net-zero transportation systems and expand low-emission zones, EV-based robotaxi fleets are becoming a central element of smart urban mobility strategies.
The hybrid electric vehicles segment is expected to grow at the fastest CAGR over the forecast period. Hybrid electric vehicles (HEVs) are emerging as a viable transitional segment in the robotaxi market, particularly in regions where electric infrastructure is underdeveloped or longer travel ranges are necessary. HEVs combine internal combustion engines with electric propulsion, providing the flexibility to operate in areas lacking dense EV charging networks. This makes them particularly appealing for semi-urban or intercity robotaxi services, where reliability and range are major concerns. Moreover, HEVs enable fleet operators to begin transitioning to greener mobility without relying entirely on high-voltage charging infrastructure. As the adoption of autonomous vehicles expands beyond major metropolitan areas, HEVs offer a practical interim solution that bridges the gap between traditional fuel-based vehicles and fully electric fleets. Although not as environmentally optimal as EVs, the reduced emissions and improved fuel efficiency of hybrids still positively contribute to sustainability goals.
Component Type Insights
The LiDAR segment held the largest market share in 2025. LiDAR sensors provide robust depth perception and spatial awareness, making them critical for safe navigation in complex urban environments and an essential requirement for Level 4 and Level 5 autonomy. As autonomous driving systems evolve, the need for detailed environmental mapping and sensor input redundancy is increasing, further solidifying LiDAR’s role as a core component of robo-taxi architectures. Leading companies are investing in cost reduction, miniaturization, and solid-state LiDAR to make these systems more commercially viable for fleet-wide deployment. Regulatory bodies also favor the inclusion of LiDAR in safety-critical applications, reinforcing its dominance. The reliability, accuracy, and evolving affordability of LiDAR systems establish them as a foundational technology in next-generation autonomous mobility.
The camera segment is expected to grow at the fastest CAGR of 100.4% during the forecast period. Cameras provide high-resolution visual data that is crucial for tasks such as traffic sign recognition, lane detection, and pedestrian tracking, particularly in well-lit, structured environments. They are considerably more cost-effective than LiDAR, making them appealing to automakers looking to balance performance with affordability in mass-market robo-taxi deployments. Additionally, camera systems are becoming increasingly reliable when combined with AI-based perception algorithms that facilitate real-time decision-making. As sensor fusion gains traction, cameras are playing a complementary role alongside LiDAR and radar to establish a comprehensive situational awareness stack.
Level Of Autonomy Insights
The Level 4 segment held the largest market in 2025. Vehicles operating at Level 4 can perform all driving tasks without human intervention in specific scenarios, such as mapped city centers, business districts, or dedicated shuttle routes. Companies like Waymo, Cruise, and Baidu Apollo are already piloting or commercially deploying Level 4 robo-taxi services in cities like Phoenix, San Francisco, and Beijing. Regulatory frameworks and public acceptance are more favorable toward Level 4 deployments due to their confined operational design domains (ODDs), which help mitigate safety and liability concerns. The controlled nature of Level 4 environments allows for more predictable system performance, making it the most practical and scalable model for near-term robotaxi growth.
The Level 5 segment is expected to grow at the CAGR of 112.0% from 2029 to 2033. Level 5 autonomy represents the ultimate goal of the robotaxi market, characterized by full automation without the need for steering wheels, pedals, or human oversight, and capable of operating under all conditions and environments. While it remains in the emerging stage, Level 5 is attracting significant interest as technological innovations in artificial intelligence, edge computing, and real-time environmental perception continue to accelerate. Companies are investing in long-term R&D to address the remaining challenges, such as complex edge-case scenarios, unpredictable weather conditions, and regulatory standardization across regions. The appeal of Level 5 lies in its promise of complete flexibility, offering truly driverless mobility that can operate 24/7 in any location. While widespread deployment is not imminent, advancements in simulation, testing protocols, and global collaboration between tech companies and policymakers are gradually paving the way for Level 5 robotaxis.
Vehicle Type Insights
The cars segment dominated the robotaxi market in 2025. Autonomous passenger cars are well-suited for urban ride-hailing services, where compact design and easy maneuverability are essential for navigating dense city environments. Their smaller size makes them ideal for curbside pickups, tight turns, and navigating existing road networks without requiring significant urban planning changes. Leading robotaxi companies such as Waymo, Cruise, and Zoox have primarily focused on car-based models for their pilot programs and early commercial operations. The familiarity of car designs also promotes higher user acceptance and regulatory approval. Additionally, cars are generally more energy-efficient per trip and simpler to service and maintain than larger vehicles.
The shuttles/vans segment is projected to grow at the fastest CAGR over the forecast period. Shuttles and vans are emerging as a promising segment in the robo-taxi market, particularly for high-capacity and shared mobility use cases. These vehicles are gaining traction for transporting multiple passengers efficiently across short to medium distances, such as within university campuses, airport terminals, corporate parks, and urban transit hubs. With their larger interior space and modular seating configurations, shuttles and vans can accommodate group travel and offer better per-passenger economics for fleet operators. They are especially relevant in scenarios where transportation demand is predictable and route-based, making them ideal for first-mile/last-mile connectivity. As cities invest in smart mobility infrastructure and promote sustainable public transportation, autonomous shuttles are expected to play an increasingly important role.
Service Type Insights
The car rental segment dominated the robotaxi market in 2025. The car rental segment dominates the robotaxi service landscape, primarily driven by its convenience, flexibility, and alignment with current ride-hailing models. Users prefer on-demand mobility services that enable them to summon autonomous vehicles directly to their location via mobile apps, mimicking traditional ride-share experiences. This door-to-door approach minimizes wait times and offers seamless point-to-point connectivity, making it ideal for urban commuters and business travelers. Key players like Waymo and Cruise have embraced this model in their pilot and commercial deployments, concentrating on dynamic fleet distribution based on real-time demand. Furthermore, the car rental model facilitates scalable operations, flexible pricing, and improved fleet utilization.
The station-based segment is projected to grow at the fastest CAGR over the forecast period. The station-based segment is emerging as a structured alternative to traditional car rental-style robotaxi services, particularly in planned urban developments, smart campuses, and transport-integrated city zones. In this model, autonomous vehicles operate between fixed pickup and drop-off stations, offering predictable routes, lower logistical complexity, and easier integration with existing public transport systems. Station-based robotaxis are well-suited for repetitive, high-volume routes such as airport shuttles, business districts, and residential communities. This approach also eases regulatory concerns, as operations are limited to pre-approved routes and zones. While it lacks the flexibility of the car rental model, it offers benefits in terms of operational control, cost management, and safety monitoring.
Application Insights
The passenger segment held the largest market share in 2025. The passenger segment dominates the robotaxi industry, driven by increasing demand for on-demand urban mobility and the growth of autonomous ride-hailing services in major cities. Robo-taxis are primarily designed to offer convenient, safe, and cost-effective transportation for individuals and groups, particularly in congested urban areas where traditional car ownership is declining. Companies such as Waymo, Baidu, and Cruise have focused their initial deployments on passenger mobility, offering user-friendly ride-hailing apps and seamless door-to-door transport. The scalability, reduced cost per ride, and elimination of human drivers enhance the appeal of robotaxis for everyday commuting, airport transfers, and city travel. Furthermore, the increasing emphasis on smart cities and sustainable transport infrastructure continues to facilitate the rollout of autonomous passenger vehicles as part of broader urban mobility strategies.
robotaxi-market-share
Key Robotaxi Companies:
The following key companies have been profiled for this study on the robotaxi market.
- Waymo LLC
- Baidu, Inc.
- WeRide Inc.
- Pony AI Inc.
- Tesla Inc.
- Zoox, Inc.
- Didi Chuxing Technology Co., Ltd.
- EasyMile
- Aptiv
- Uber Technologies Inc.
Robotaxi Market Report Scope
| Report Attribute | Details |
| Market size value in 2026 | USD 1.19 billion |
| Revenue forecast in 2033 | USD 147.25 billion |
| Growth rate | CAGR of 99.1% from 2026 to 2033 |
| Base year for estimation | 2025 |
| Historical data | 2021- 2024 |
| Forecast period | 2026 – 2033 |
| Quantitative units | Revenue in USD million/billion and CAGR from 2026 to 2033 |
| Report coverage | Revenue forecast, company ranking, competitive landscape, growth factors, and trends |
| Segments covered | Propulsion type, component type, level of autonomy, vehicle type, service type, application, region |
| Regional scope | North America; Europe; Asia Pacific; Latin America; Middle East & Africa |
| Country scope | U.S.; Canada; Mexico; Germany; UK; France; China; Japan; India; South Korea; Australia; Brazil; KSA; UAE; South Africa |
| Key companies profiled | Waymo LLC; Baidu, Inc.; WeRide Inc.; Pony AI Inc.; Tesla Inc.; Zoox, Inc.; Didi Chuxing Technology Co., Ltd.; EasyMile; Aptiv; Uber Technologies Inc. |
| Customization scope | Free report customization (equivalent up to 8 analysts working days) with purchase. Addition or alteration to country, regional & segment scope. |
Global Robotaxi Market Report Segmentation
This report forecasts revenue growth at global, regional, and country levels and provides an analysis of the latest industry trends in each of the sub-segments from 2021 to 2033. For this study, Grand View Research has segmented the global robotaxi market report based on propulsion type, component type, level of autonomy, vehicle type, service type, application, and region.
- Propulsion Type Outlook (Revenue, USD Million, 2021 – 2033)
- Electric Vehicles
- Hybrid Electric Vehicles
- Fuel Cell Vehicle
- Component Type Outlook (Revenue, USD Million, 2021 – 2033)
- LiDAR
- Radar
- Camera
- Sensor
- Level of Autonomy Outlook (Revenue, USD Million, 2021 – 2033)
- Level 4
- Level 5
- Vehicle Type Outlook (Revenue, USD Million, 2021 – 2033)
- Cars
- Shuttles/Vans
- Service Type Outlook (Revenue, USD Million, 2021 – 2033)
- Car Rental
- Station-based
- Application Outlook (Revenue, USD Million, 2021 – 2033)
- Passenger
- Goods
- Regional Outlook (Revenue, USD Million, 2021 – 2033)
- North America
- U.S.
- Canada
- Mexico
- Europe
- Germany
- UK
- France
- Asia Pacific
- China
- Japan
- India
- South Korea
- Australia
- Latin America
- Brazil
- Middle East and Africa (MEA)
- KSA
- UAE
- South Africa
- North America
Table of Contents
Chapter 1. Methodology and Scope
1.1. Market Segmentation and Scope
1.2. Research Methodology
1.2.1. Information Procurement
1.3. Information or Data Analysis
1.4. Methodology
1.5. Research Scope and Assumptions
1.6. Market Formulation & Validation
1.7. Country Based Segment Share Calculation
1.8. List of Data Sources
Chapter 2. Executive Summary
2.1. Market Outlook
2.2. Segment Outlook
2.3. Competitive Insights
Chapter 3. Robotaxi Market Variables, Trends, & Scope
3.1. Market Lineage Outlook
3.2. Market Dynamics
3.2.1. Market Driver Analysis
3.2.2. Market Restraint Analysis
3.2.3. Industry Challenge
3.3. Robotaxi Market Analysis Tools
3.3.1. Industry Analysis – Porter’s
3.3.1.1. Bargaining power of the suppliers
3.3.1.2. Bargaining power of the buyers
3.3.1.3. Threats of substitution
3.3.1.4. Threats from new entrants
3.3.1.5. Competitive rivalry
3.3.2. PESTEL Analysis
3.3.2.1. Political landscape
3.3.2.2. Economic landscape
3.3.2.3. Social landscape
3.3.2.4. Technological landscape
3.3.2.5. Environmental landscape
3.3.2.6. Legal landscape
Chapter 4. Robotaxi Market: Propulsion Type Estimates & Trend Analysis
4.1. Segment Dashboard
4.2. Robotaxi Market: Propulsion Type Movement Analysis, 2025 & 2033 (USD Million)
4.3. Electric Vehicles
4.3.1. Electric Vehicles Market Revenue Estimates and Forecasts, 2021 – 2033 (USD Million)
4.4. Hybrid Electric Vehicles
4.4.1. Hybrid Electric Vehicles Market Revenue Estimates and Forecasts, 2021 – 2033 (USD Million)
4.5. Fuel Cell Vehicles
4.5.1. Fuel Cell Vehicles Market Revenue Estimates and Forecasts, 2021 – 2033 (USD Million)
Chapter 5. Robotaxi Market: Component Type Estimates & Trend Analysis
5.1. Segment Dashboard
5.2. Robotaxi Market: Component Type Movement Analysis, 2025 & 2033 (USD Million)
5.3. LiDAR
5.3.1. LiDAR Market Revenue Estimates and Forecasts, 2021 – 2033 (USD Million)
5.4. Radar
5.4.1. Radar Market Revenue Estimates and Forecasts, 2021 – 2033 (USD Million)
5.5. Camera
5.5.1. NFV Market Revenue Estimates and Forecasts, 2021 – 2033 (USD Million)
5.6. Sensors
5.6.1. Sensors Market Revenue Estimates and Forecasts, 2021 – 2033 (USD Million)
Chapter 6. Robotaxi Market: Level of Autonomy Estimates & Trend Analysis
6.1. Segment Dashboard
6.2. Robotaxi Market: Level of Autonomy Movement Analysis, 2025 & 2033 (USD Million)
6.3. Level 4
6.3.1. Level 4 Market Revenue Estimates and Forecasts, 2021 – 2033 (USD Million)
6.4. Level 5
6.4.1. Level 5 Market Revenue Estimates and Forecasts, 2021 – 2033 (USD Million)
Chapter 7. Robotaxi Market: Vehicle Type Estimates & Trend Analysis
7.1. Segment Dashboard
7.2. Robotaxi Market: Vehicle Type Movement Analysis, 2025 & 2033 (USD Million)
7.3. Cars
7.3.1. Cars Market Revenue Estimates and Forecasts, 2021 – 2033 (USD Million)
7.4. Shuttles/Vans
7.4.1. Shuttles/Vans Market Revenue Estimates and Forecasts, 2021 – 2033 (USD Million)
Chapter 8. Robotaxi Market: Service Type Estimates & Trend Analysis
8.1. Segment Dashboard
8.2. Robotaxi Market: Service Type Movement Analysis, 2025 & 2033 (USD Million)
8.3. Car Rental
8.3.1. Car Rental Market Revenue Estimates and Forecasts, 2021 – 2033 (USD Million)
8.4. Shuttles/Vans
8.4.1. Shuttles/Vans Market Revenue Estimates and Forecasts, 2021 – 2033 (USD Million)
Chapter 9. Robotaxi Market: Application Estimates & Trend Analysis
9.1. Segment Dashboard
9.2. Robotaxi Market: Application Movement Analysis, 2025 & 2033 (USD Million)
9.3. Passengers
9.3.1. Passengers Market Revenue Estimates and Forecasts, 2021 – 2033 (USD Million)
9.4. Goods
9.4.1. Goods Market Revenue Estimates and Forecasts, 2021 – 2033 (USD Million)
Chapter 10. Robotaxi Market: Regional Estimates & Trend Analysis
10.1. Robotaxi Market Share, By Region, 2025 & 2033 (USD Million)
10.2. North America
10.2.1. North America Robotaxi Market Estimates and Forecasts, 2021 – 2033 (USD Million)
10.2.2. U.S.
10.2.2.1. U.S. Robotaxi Market Estimates and Forecasts, 2021 – 2033 (USD Million)
10.2.3. Canada
10.2.3.1. Canada Robotaxi Market Estimates and Forecasts, 2021 – 2033 (USD Million)
10.2.4. Mexico
10.2.4.1. Mexico Robotaxi Market Estimates and Forecasts, 2021 – 2033 (USD Million)
10.3. Europe
10.3.1. Europe Robotaxi Market Estimates and Forecasts, 2021 – 2033 (USD Million)
10.3.2. UK
10.3.2.1. UK Robotaxi Market Estimates and Forecasts, 2021 – 2033 (USD Million)
10.3.3. Germany
10.3.3.1. Germany Robotaxi Market Estimates and Forecasts, 2021 – 2033 (USD Million)
10.3.4. France
10.3.4.1. France Robotaxi Market Estimates and Forecasts, 2021 – 2033 (USD Million)
10.4. Asia Pacific
10.4.1. Asia Pacific Robotaxi Market Estimates and Forecasts, 2021 – 2033 (USD Million)
10.4.2. China
10.4.2.1. China Robotaxi Market Estimates and Forecasts, 2021 – 2033 (USD Million)
10.4.3. Japan
10.4.3.1. Japan Robotaxi Market Estimates and Forecasts, 2021 – 2033 (USD Million)
10.4.4. India
10.4.4.1. India Robotaxi Market Estimates and Forecasts, 2021 – 2033 (USD Million)
10.4.5. South Korea
10.4.5.1. South Korea Robotaxi Market Estimates and Forecasts, 2021 – 2033 (USD Million)
10.4.6. Australia
10.4.6.1. Australia Robotaxi Market Estimates and Forecasts, 2021 – 2033 (USD Million)
10.5. Latin America
10.5.1. Latin America Robotaxi Market Estimates and Forecasts, 2021 – 2033 (USD Million)
10.5.2. Brazil
10.5.2.1. Brazil Robotaxi Market Estimates and Forecasts, 2021 – 2033 (USD Million)
10.6. Middle East and Africa
10.6.1. Middle East and Africa Robotaxi Market Estimates and Forecasts, 2021 – 2033 (USD Million)
10.6.2. UAE
10.6.2.1. UAE Robotaxi Market Estimates and Forecasts, 2021 – 2033 (USD Million)
10.6.3. KSA
10.6.3.1. KSA Robotaxi Market Estimates and Forecasts, 2021 – 2033 (USD Million)
10.6.4. South Africa
10.6.4.1. South Africa Robotaxi Market Estimates and Forecasts, 2021 – 2033 (USD Million)
Chapter 11. Competitive Landscape
11.1. Company Categorization
11.2. Company Market Positioning
11.3. Company Heat Map Analysis
11.4. Company Profiles/Listing
11.4.1. Waymo LLC
11.4.1.1. Participant’s Overview
11.4.1.2. Financial Performance
11.4.1.3. Product Benchmarking
11.4.1.4. Strategic Initiatives
11.4.2. Baidu, Inc.
11.4.2.1. Participant’s Overview
11.4.2.2. Financial Performance
11.4.2.3. Product Benchmarking
11.4.2.4. Strategic Initiatives
11.4.3. Didi Chuxing Technology Co., Ltd.
11.4.3.1. Participant’s Overview
11.4.3.2. Financial Performance
11.4.3.3. Product Benchmarking
11.4.3.4. Strategic Initiatives
11.4.4. WeRide Inc.
11.4.4.1. Participant’s Overview
11.4.4.2. Financial Performance
11.4.4.3. Product Benchmarking
11.4.4.4. Strategic Initiatives
11.4.5. EasyMile
11.4.5.1. Participant’s Overview
11.4.5.2. Financial Performance
11.4.5.3. Product Benchmarking
11.4.5.4. Strategic Initiatives
11.4.6. Tesla Inc.
11.4.6.1. Participant’s Overview
11.4.6.2. Financial Performance
11.4.6.3. Product Benchmarking
11.4.6.4. Strategic Initiatives
11.4.7. Aptiv
11.4.7.1. Participant’s Overview
11.4.7.2. Financial Performance
11.4.7.3. Product Benchmarking
11.4.7.4. Strategic Initiatives
11.4.8. Uber Technologies Inc.
11.4.8.1. Participant’s Overview
11.4.8.2. Financial Performance
11.4.8.3. Product Benchmarking
11.4.8.4. Strategic Initiatives
11.4.9. Pony AI Inc.
11.4.9.1. Participant’s Overview
11.4.9.2. Financial Performance
11.4.9.3. Product Benchmarking
11.4.9.4. Strategic Initiatives
11.4.10. Zoox, Inc
11.4.10.1. Participant’s Overview
11.4.10.2. Financial Performance
11.4.10.3. Product Benchmarking
11.4.10.4. Strategic Initiatives
List of Tables
Table 1 Global Robotaxi Market size estimates & forecasts 2021 – 2033 (USD Million)
Table 2 Global Robotaxi Market, by region 2021 – 2033 (USD Million)
Table 3 Global Robotaxi Market, by Propulsion Type 2021 – 2033 (USD Million)
Table 4 Global Robotaxi Market, By Component Type 2021 – 2033 (USD Million)
Table 5 Global Robotaxi Market, by Level of Autonomy 2021 – 2033 (USD Million)
Table 6 Global Robotaxi Market, by Vehicle Type 2021 – 2033 (USD Million)
Table 7 Global Robotaxi Market, by Service Type 2021 – 2033 (USD Million)
Table 8 Global Robotaxi Market, by Application 2021 – 2033 (USD Million)
Table 9 Electric Vehicles market, by region 2021 – 2033 (USD Million)
Table 10 Hybrid Electric Vehicles market, by region 2021 – 2033 (USD Million)
Table 11 Fuel Cell Vehicles market, by region 2021 – 2033 (USD Million)
Table 12 LiDAR market, by region 2021 – 2033 (USD Million)
Table 13 Radar market, by region 2021 – 2033 (USD Million)
Table 14 Camera market, by region 2021 – 2033 (USD Million)
Table 15 Sensors market, by region 2021 – 2033 (USD Million)
Table 16 Level 4 market, by region 2021 – 2033 (USD Million)
Table 17 Level 5 market, by region 2021 – 2033 (USD Million)
Table 18 Cars market, by region 2021 – 2033 (USD Million)
Table 19 Shuttles/Vans market, by region 2021 – 2033 (USD Million)
Table 20 Car Rental market, by region 2021 – 2033 (USD Million)
Table 21 Station-based market, by region 2021 – 2033 (USD Million)
Table 22 Passenger market, by region 2021 – 2033 (USD Million)
Table 23 Goods market, by region 2021 – 2033 (USD Million)
Table 24 North America Robotaxi Market, by Propulsion Type 2021 – 2033 (USD Million)
Table 25 North America Robotaxi Market, By Component Type 2021 – 2033 (USD Million)
Table 26 North America Robotaxi Market, by Level of Autonomy 2021 – 2033 (USD Million)
Table 27 North America Robotaxi Market, by Vehicle Type 2021 – 2033 (USD Million)
Table 28 North America Robotaxi Market, by Service Type 2021 – 2033 (USD Million)
Table 29 North America Robotaxi Market, by Application 2021 – 2033 (USD Million)
Table 30 U.S. Robotaxi Market, by Propulsion Type 2021 – 2033 (USD Million)
Table 31 U.S. Robotaxi Market, By Component Type 2021 – 2033 (USD Million)
Table 32 U.S. Robotaxi Market, by Level of Autonomy 2021 – 2033 (USD Million)
Table 33 U.S. Robotaxi Market, by Vehicle Type 2021 – 2033 (USD Million)
Table 34 U.S. Robotaxi Market, by Service Type 2021 – 2033 (USD Million)
Table 35 U.S. Robotaxi Market, by Application 2021 – 2033 (USD Million)
Table 36 Canada Robotaxi Market, by Propulsion Type 2021 – 2033 (USD Million)
Table 37 Canada Robotaxi Market, By Component Type 2021 – 2033 (USD Million)
Table 38 Canada Robotaxi Market, by Level of Autonomy 2021 – 2033 (USD Million)
Table 39 Canada Robotaxi Market, by Vehicle Type 2021 – 2033 (USD Million)
Table 40 Canada Robotaxi Market, by Service Type 2021 – 2033 (USD Million)
Table 41 Canada Robotaxi Market, by Application 2021 – 2033 (USD Million)
Table 42 Mexico Robotaxi Market, by Propulsion Type 2021 – 2033 (USD Million)
Table 43 Mexico Robotaxi Market, By Component Type 2021 – 2033 (USD Million)
Table 44 Mexico Robotaxi Market, by Level of Autonomy 2021 – 2033 (USD Million)
Table 45 Mexico Robotaxi Market, by Vehicle Type 2021 – 2033 (USD Million)
Table 46 Mexico Robotaxi Market, by Service Type 2021 – 2033 (USD Million)
Table 47 Mexico Robotaxi Market, by Application 2021 – 2033 (USD Million)
Table 48 Europe Robotaxi Market, by Propulsion Type 2021 – 2033 (USD Million)
Table 49 Europe Robotaxi Market, By Component Type 2021 – 2033 (USD Million)
Table 50 Europe Robotaxi Market, by Level of Autonomy 2021 – 2033 (USD Million)
Table 51 Europe Robotaxi Market, by Vehicle Type 2021 – 2033 (USD Million)
Table 52 Europe Robotaxi Market, by Service Type 2021 – 2033 (USD Million)
Table 53 Europe Robotaxi Market, by Application 2021 – 2033 (USD Million)
Table 54 UK Robotaxi Market, by Propulsion Type 2021 – 2033 (USD Million)
Table 55 UK Robotaxi Market, By Component Type 2021 – 2033 (USD Million)
Table 56 UK Robotaxi Market, by Level of Autonomy 2021 – 2033 (USD Million)
Table 57 UK Robotaxi Market, by Vehicle Type 2021 – 2033 (USD Million)
Table 58 UK Robotaxi Market, by Service Type 2021 – 2033 (USD Million)
Table 59 UK Robotaxi Market, by Application 2021 – 2033 (USD Million)
Table 60 Germany Robotaxi Market, by Propulsion Type 2021 – 2033 (USD Million)
Table 61 Germany Robotaxi Market, By Component Type 2021 – 2033 (USD Million)
Table 62 Germany Robotaxi Market, by Level of Autonomy 2021 – 2033 (USD Million)
Table 63 Germany Robotaxi Market, by Vehicle Type 2021 – 2033 (USD Million)
Table 64 Germany Robotaxi Market, by Service Type 2021 – 2033 (USD Million)
Table 65 Germany Robotaxi Market, by Application 2021 – 2033 (USD Million)
Table 66 France Robotaxi Market, by Propulsion Type 2021 – 2033 (USD Million)
Table 67 France Robotaxi Market, By Component Type 2021 – 2033 (USD Million)
Table 68 France Robotaxi Market, by Level of Autonomy 2021 – 2033 (USD Million)
Table 69 France Robotaxi Market, by Vehicle Type 2021 – 2033 (USD Million)
Table 70 France Robotaxi Market, by Service Type 2021 – 2033 (USD Million)
Table 71 France Robotaxi Market, by Application 2021 – 2033 (USD Million)
Table 72 Asia Pacific Robotaxi Market, by Propulsion Type 2021 – 2033 (USD Million)
Table 73 Asia Pacific Robotaxi Market, By Component Type 2021 – 2033 (USD Million)
Table 74 Asia Pacific Robotaxi Market, by Level of Autonomy 2021 – 2033 (USD Million)
Table 75 Asia Pacific Robotaxi Market, by Vehicle Type 2021 – 2033 (USD Million)
Table 76 Asia Pacific Robotaxi Market, by Service Type 2021 – 2033 (USD Million)
Table 77 Asia Pacific Robotaxi Market, by Application 2021 – 2033 (USD Million)
Table 78 China Robotaxi Market, by Propulsion Type 2021 – 2033 (USD Million)
Table 79 China Robotaxi Market, By Component Type 2021 – 2033 (USD Million)
Table 80 China Robotaxi Market, by Level of Autonomy 2021 – 2033 (USD Million)
Table 81 China Robotaxi Market, by Vehicle Type 2021 – 2033 (USD Million)
Table 82 China Robotaxi Market, by Service Type 2021 – 2033 (USD Million)
Table 83 China Robotaxi Market, by Application 2021 – 2033 (USD Million)
Table 84 India Robotaxi Market, by Propulsion Type 2021 – 2033 (USD Million)
Table 85 India Robotaxi Market, By Component Type 2021 – 2033 (USD Million)
Table 86 India Robotaxi Market, by Level of Autonomy 2021 – 2033 (USD Million)
Table 87 India Robotaxi Market, by Vehicle Type 2021 – 2033 (USD Million)
Table 88 India Robotaxi Market, by Service Type 2021 – 2033 (USD Million)
Table 89 India Robotaxi Market, by Application 2021 – 2033 (USD Million)
Table 90 Japan Robotaxi Market, by Propulsion Type 2021 – 2033 (USD Million)
Table 91 Japan Robotaxi Market, By Component Type 2021 – 2033 (USD Million)
Table 92 Japan Robotaxi Market, by Level of Autonomy 2021 – 2033 (USD Million)
Table 93 Japan Robotaxi Market, by Vehicle Type 2021 – 2033 (USD Million)
Table 94 Japan Robotaxi Market, by Service Type 2021 – 2033 (USD Million)
Table 95 Japan Robotaxi Market, by Application 2021 – 2033 (USD Million)
Table 96 Australia Robotaxi Market, by Propulsion Type 2021 – 2033 (USD Million)
Table 97 Australia Robotaxi Market, By Component Type 2021 – 2033 (USD Million)
Table 98 Australia Robotaxi Market, by Level of Autonomy 2021 – 2033 (USD Million)
Table 99 Australia Robotaxi Market, by Vehicle Type 2021 – 2033 (USD Million)
Table 100 Australia Robotaxi Market, by Service Type 2021 – 2033 (USD Million)
Table 101 Australia Robotaxi Market, by Application 2021 – 2033 (USD Million)
Table 102 South Korea Robotaxi Market, by Propulsion Type 2021 – 2033 (USD Million)
Table 103 South Korea Robotaxi Market, By Component Type 2021 – 2033 (USD Million)
Table 104 South Korea Robotaxi Market, by Level of Autonomy 2021 – 2033 (USD Million)
Table 105 South Korea Robotaxi Market, by Vehicle Type 2021 – 2033 (USD Million)
Table 106 South Korea Robotaxi Market, by Service Type 2021 – 2033 (USD Million)
Table 107 South Korea Robotaxi Market, by Application 2021 – 2033 (USD Million)
Table 108 Latin America Robotaxi Market, by Propulsion Type 2021 – 2033 (USD Million)
Table 109 Latin America Robotaxi Market, By Component Type 2021 – 2033 (USD Million)
Table 110 Latin America Robotaxi Market, by Level of Autonomy 2021 – 2033 (USD Million)
Table 111 Latin America Robotaxi Market, by Vehicle Type 2021 – 2033 (USD Million)
Table 112 Latin America Robotaxi Market, by Service Type 2021 – 2033 (USD Million)
Table 113 Latin America Robotaxi Market, by Application 2021 – 2033 (USD Million)
Table 114 Brazil Robotaxi Market, by Propulsion Type 2021 – 2033 (USD Million)
Table 115 Brazil Robotaxi Market, By Component Type 2021 – 2033 (USD Million)
Table 116 Brazil Robotaxi Market, by Level of Autonomy 2021 – 2033 (USD Million)
Table 117 Brazil Robotaxi Market, by Vehicle Type 2021 – 2033 (USD Million)
Table 118 Brazil Robotaxi Market, by Service Type 2021 – 2033 (USD Million)
Table 119 Brazil Robotaxi Market, by Application 2021 – 2033 (USD Million)
Table 120 MEA Robotaxi Market, by Propulsion Type 2021 – 2033 (USD Million)
Table 121 MEA Robotaxi Market, By Component Type 2021 – 2033 (USD Million)
Table 122 MEA Robotaxi Market, by Level of Autonomy 2021 – 2033 (USD Million)
Table 123 MEA Robotaxi Market, by Vehicle Type 2021 – 2033 (USD Million)
Table 124 MEA Robotaxi Market, by Service Type 2021 – 2033 (USD Million)
Table 125 MEA Robotaxi Market, by Application 2021 – 2033 (USD Million)
Table 126 UAE Robotaxi Market, by Propulsion Type 2021 – 2033 (USD Million)
Table 127 UAE Robotaxi Market, By Component Type 2021 – 2033 (USD Million)
Table 128 UAE Robotaxi Market, by Level of Autonomy 2021 – 2033 (USD Million)
Table 129 UAE Robotaxi Market, by Vehicle Type 2021 – 2033 (USD Million)
Table 130 UAE Robotaxi Market, by Service Type 2021 – 2033 (USD Million)
Table 131 UAE Robotaxi Market, by Application 2021 – 2033 (USD Million)
Table 132 KSA Robotaxi Market, by Propulsion Type 2021 – 2033 (USD Million)
Table 133 KSA Robotaxi Market, By Component Type 2021 – 2033 (USD Million)
Table 134 KSA Robotaxi Market, by Level of Autonomy 2021 – 2033 (USD Million)
Table 135 KSA Robotaxi Market, by Vehicle Type 2021 – 2033 (USD Million)
Table 136 KSA Robotaxi Market, by Service Type 2021 – 2033 (USD Million)
Table 137 KSA Robotaxi Market, by Application 2021 – 2033 (USD Million)
Table 138 South Africa Robotaxi Market, by Propulsion Type 2021 – 2033 (USD Million)
Table 139 South Africa Robotaxi Market, By Component Type 2021 – 2033 (USD Million)
Table 140 South Africa Robotaxi Market, by Level of Autonomy 2021 – 2033 (USD Million)
Table 141 South Africa Robotaxi Market, by Vehicle Type 2021 – 2033 (USD Million)
Table 142 South Africa Robotaxi Market, by Service Type 2021 – 2033 (USD Million)
Table 143 South Africa Robotaxi Market, by Application 2021 – 2033 (USD Million)
List of Figures
Fig. 1 Robotaxi Market segmentation
Fig. 2 Market research deployment mode
Fig. 3 Information procurement
Fig. 4 Primary research pattern
Fig. 5 Market research approaches
Fig. 6 Value chain-based sizing & forecasting
Fig. 7 Parent market analysis
Fig. 8 Market formulation & validation
Fig. 9 Robotaxi Market snapshot
Fig. 10 Robotaxi Market segment snapshot
Fig. 11 Robotaxi Market competitive landscape snapshot
Fig. 12 Market research deployment mode
Fig. 13 Market driver relevance analysis (Current & future impact)
Fig. 14 Market restraint relevance analysis (Current & future impact)
Fig. 15 Robotaxi Market: Propulsion Type outlook key takeaways (USD Million)
Fig. 16 Robotaxi Market: Propulsion Type movement analysis 2025 & 2033 (USD Million)
Fig. 17 Electric Vehicles market revenue estimates and forecasts, 2021 – 2033 (USD Million)
Fig. 18 Hybrid Electric Vehicles market revenue estimates and forecasts, 2021 – 2033 (USD Million)
Fig. 19 Fuel Cell Vehicles market revenue estimates and forecasts, 2021 – 2033 (USD Million)
Fig. 20 Robotaxi Market: Component Type outlook key takeaways (USD Million)
Fig. 21 Robotaxi Market: Component Type movement analysis 2025 & 2033 (USD Million)
Fig. 22 LiDAR market revenue estimates and forecasts, 2021 – 2033 (USD Million)
Fig. 23 Radar market revenue estimates and forecasts, 2021 – 2033 (USD Million)
Fig. 24 Camera market revenue estimates and forecasts, 2021 – 2033 (USD Million)
Fig. 25 Sensors market revenue estimates and forecasts, 2021 – 2033 (USD Million)
Fig. 26 Robotaxi Market: Level of Autonomy outlook key takeaways (USD Million)
Fig. 27 Robotaxi Market: Level of Autonomy movement analysis 2025 & 2033 (USD Million)
Fig. 28 Level 4 market revenue estimates and forecasts, 2021 – 2033 (USD Million)
Fig. 29 Level 5 market revenue estimates and forecasts, 2021 – 2033 (USD Million)
Fig. 30 Robotaxi Market: Vehicle Type outlook key takeaways (USD Million)
Fig. 31 Robotaxi Market: Vehicle Type movement analysis 2025 & 2033 (USD Million)
Fig. 32 Cars market revenue estimates and forecasts, 2021 – 2033 (USD Million)
Fig. 33 Shuttles/Vans market revenue estimates and forecasts, 2021 – 2033 (USD Million)
Fig. 34 Robotaxi Market: Service Type outlook key takeaways (USD Million)
Fig. 35 Robotaxi Market: Service Type movement analysis 2025 & 2033 (USD Million)
Fig. 36 Car Rental market revenue estimates and forecasts, 2021 – 2033 (USD Million)
Fig. 37 Station-based market revenue estimates and forecasts, 2021 – 2033 (USD Million)
Fig. 38 Robotaxi Market: Application outlook key takeaways (USD Million)
Fig. 39 Robotaxi Market: Application movement analysis 2025 & 2033 (USD Million)
Fig. 40 Passenger market revenue estimates and forecasts, 2021 – 2033 (USD Million)
Fig. 41 Goods market revenue estimates and forecasts, 2021 – 2033 (USD Million)
Fig. 42 Regional marketplace: Key takeaways
Fig. 43 Robotaxi Market: Regional outlook, 2025 & 2033, USD Million
Fig. 44 North America Robotaxi Market estimates and forecasts, 2021 – 2033 (USD Million)
Fig. 45 U.S. Robotaxi Market estimates and forecasts, 2021 – 2033 (USD Million)
Fig. 46 Canada Robotaxi Market estimates and forecasts, 2021 – 2033 (USD Million)
Fig. 47 Mexico Robotaxi Market estimates and forecasts, 2021 – 2033 (USD Million)
Fig. 48 Europe Robotaxi Market estimates and forecasts, 2021 – 2033 (USD Million)
Fig. 49 UK Robotaxi Market estimates and forecasts, 2021 – 2033 (USD Million)
Fig. 50 Germany Robotaxi Market estimates and forecasts, 2021 – 2033 (USD Million)
Fig. 51 France Robotaxi Market estimates and forecasts, 2021 – 2033 (USD Million)
Fig. 52 Asia Pacific Robotaxi Market estimates and forecasts, 2021 – 2033 (USD Million)
Fig. 53 Japan Robotaxi Market estimates and forecasts, 2021 – 2033 (USD Million)
Fig. 54 China Robotaxi Market estimates and forecasts, 2021 – 2033 (USD Million)
Fig. 55 India Robotaxi Market estimates and forecasts, 2021 – 2033 (USD Million)
Fig. 56 Australia Robotaxi Market estimates and forecasts, 2021 – 2033 (USD Million)
Fig. 57 South Korea Robotaxi Market estimates and forecasts, 2021 – 2033 (USD Million)
Fig. 58 Latin America Robotaxi Market estimates and forecasts, 2021 – 2033 (USD Million)
Fig. 59 Brazil Robotaxi Market estimates and forecasts, 2021 – 2033 (USD Million)
Fig. 60 MEA Robotaxi Market estimates and forecasts, 2021 – 2033 (USD Million)
Fig. 61 KSA Robotaxi Market estimates and forecasts, 2021 – 2033 (USD Million)
Fig. 62 UAE Robotaxi Market estimates and forecasts, 2021 – 2033 (USD Million)
Fig. 63 South Africa Robotaxi Market estimates and forecasts, 2021 – 2033 (USD Million)
Fig. 64 Strategy framework
Fig. 65 Company Categorization