Print On Demand Market Size, Share & Trends Analysis Report
プリントオンデマンド市場 - プラットフォーム(ソフトウェア、サービス)、製品別(アパレル、ホームデコレーション、ドリンクウェア、アクセサリー、その他)、地域別(北米、ヨーロッパ、アジア太平洋、ラテンアメリカ)、セグメント別予測による市場規模、成長と動向分析レポート 2026-2033年
Print On Demand Market Size, Share & Trends Analysis Report By Platform (Software, Services), By Product (Apparel, Home Décor, Drinkware, Accessories, Others), By Region (North America, Europe, Asia-Pacific, Latin America), And Segment Forecasts, 2026 - 2033
| 出版 | Grand View Research |
| 出版年月 | 2025年12月 |
| ページ数 | 150 |
| 価格 | 記載以外のライセンスについてはお問合せください |
| シングルユーザ | USD 4,950 |
| 種別 | 英文調査報告書 |
| 商品番号 | SMR-12059 |

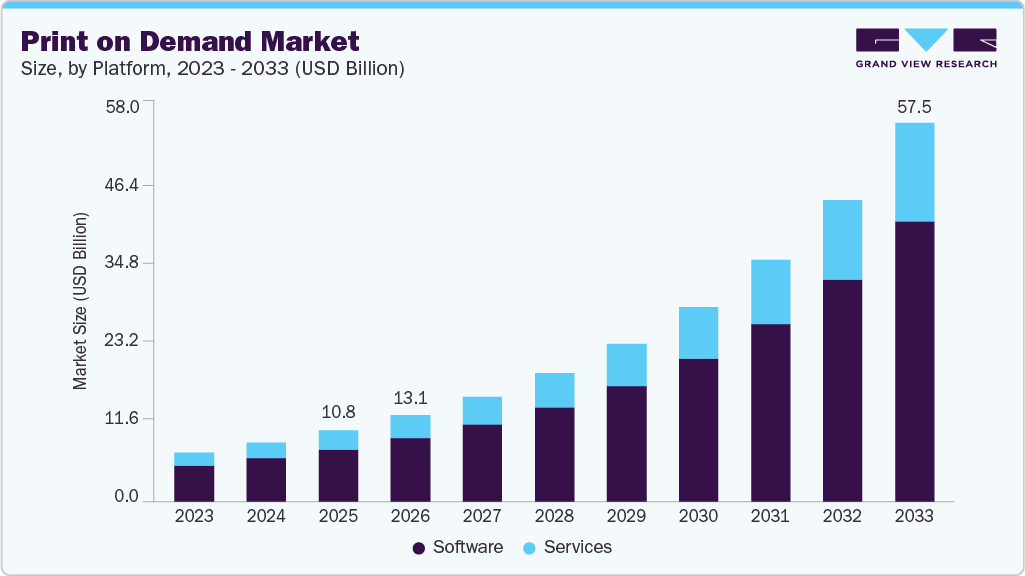
世界のプリントオンデマンド市場規模は、2025年には107億8,000万米ドルと推定され、2026年から2033年にかけて年平均成長率(CAGR)23.6%で成長し、2033年には574億9,000万米ドルに達すると予測されています。消費者の嗜好の変化や、特別な機会にカスタムメイドの製品を贈りたいという関心の高まりにより、カスタマイズやパーソナライズされたアパレル、ホームデコレーション、アクセサリー、ドリンクウェアなどの需要が高まり、市場の成長を後押ししています。
デジタル小売取引の急速な増加は、より多くの消費者がカスタマイズされた小ロット商品が主流のオンライン購買環境に移行するにつれて、オンデマンド印刷の市場成長を牽引しています。政府の電子商取引統計によると、オンライン小売支出は前年比で構造的に高い水準を維持しており、大量生産ではなく、柔軟なオンデマンド生産への需要が高まっています。 消費者がパーソナライズされたアパレル、装飾品、書籍、アクセサリーを求めるようになるにつれ、オンデマンド印刷サプライヤーは、従来の印刷会社ではコスト効率よく対応できないマイクロオーダーに対応することで戦略的優位性を獲得しています。
デジタルプリントエンジン、テキスタイルインクジェットシステム、そして積層造形技術の継続的な改良は、これらの技術が生産の高速化、色精度の向上、そしてより幅広い印刷素材に対応していることから、市場を活性化させています。政府支援によるモジュール型製造に関する調査では、機敏性、コンパクト性、そしてデジタル接続性を備えた生産ツールが、オンデマンド印刷と直接連携した、完全にカスタマイズ可能で在庫の少ないワークフローを実現していることが強調されています。これらの技術革新は、経済的な最小印刷部数を削減し、迅速な小ロット生産や高度に個別化された製品出力を必要とするブランドや機関による導入を促進しています。
Print On Demand Market Summary
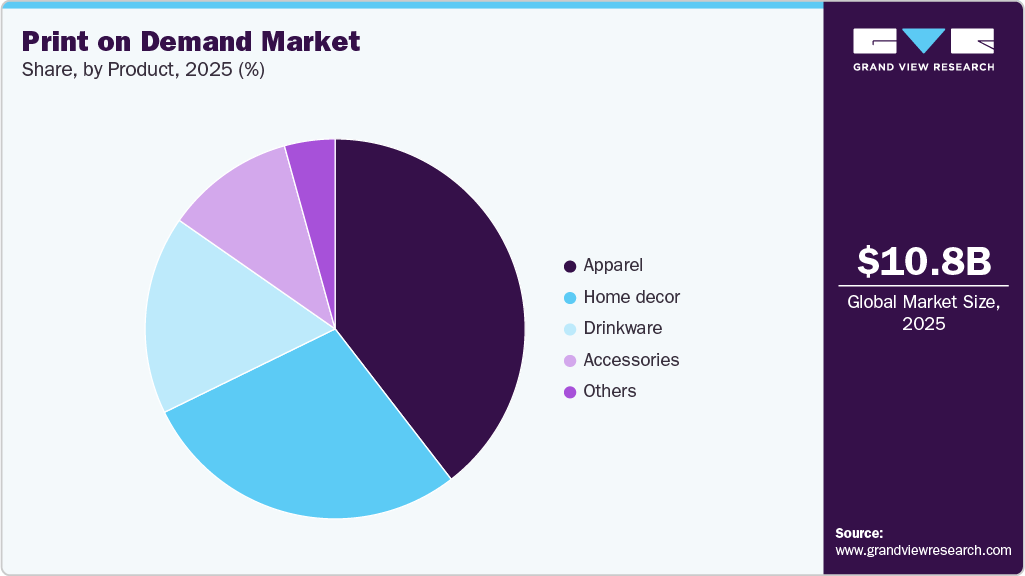
The global print on demand market size was estimated at USD 10.78 billion in 2025 and is projected to reach USD 57.49 billion by 2033, growing at a CAGR of 23.6% from 2026 to 2033. The rising demand for customized and personalized apparel, home décor, accessories, and drinkware, among others, due to changing consumer preferences and increasing interest in gifting custom-made products for special occasions, has bolstered the growth of the market.
The rapid rise in digital retail transactions is propelling the market growth of print-on-demand, as more consumers shift toward online purchasing environments where customized, small-batch goods dominate. Government e-commerce statistics show that online retail spending remains structurally higher than in previous years, reinforcing the demand for flexible, on-demand production rather than bulk manufacturing.
As shoppers increasingly seek personalized apparel, décor, books, and accessories, print-on-demand suppliers gain a strategic advantage by fulfilling micro-orders that traditional printers cannot cost-effectively serve.
Continuous improvements in digital print engines, textile inkjet systems, and additive manufacturing are boosting the market, as these technologies now support faster production, higher color accuracy, and a wider range of print materials. Government-backed research on modular manufacturing highlights how agile, compact, and digitally connected production tools are enabling fully customizable, low-inventory workflows that are directly aligned with print-on-demand operations. These technical strides reduce the minimum economic print run, encouraging adoption among brands and institutions that require rapid, short-run, or highly individualized product output.
Government environmental assessments and resource-use data reveal growing global attention to textile waste and overproduction, propelling the market growth of print-on-demand as a more sustainable alternative. Made-to-order print models eliminate the chronic issue of unsold inventory and help brands reduce waste, returns, and excess materials. As public-sector environmental agencies emphasize waste reduction and responsible material use, companies are responding by adopting print-on-demand production to align with their sustainability commitments and regulatory expectations.
print-on-demand-market-share
Government agencies and public institutions have increasingly adopted print-on-demand solutions, such as on-demand nautical charts, official print packs, and standardized procurement workflows, thereby boosting the market by validating the reliability, data standards, and delivery accuracy of print-on-demand. These official deployments demonstrate that print-on-demand systems can comply with strict quality and traceability requirements, helping commercial buyers view print-on-demand not as a novelty but as a proven, institutionally trusted production model suitable for large-scale and regulated environments.
Recent disruptions in logistics networks and paper/material availability have heightened the need for flexible production strategies, driving the global growth of print-on-demand. Since print-on-demand relies on localized, short-run production and minimal inventory, it is less vulnerable to long-haul shipping constraints and bulk material shortages. Governments monitoring supply-chain stability have repeatedly highlighted vulnerabilities in traditional manufacturing and import-dependent models, further encouraging businesses to adopt print-on-demand as a resilient, market-ready alternative.
Print on Demand Market Report Scope
| Report Attribute | Details |
| Market size value in 2026 | USD 13.06 Billion |
| Revenue forecast in 2033 | USD 57.49 Billion |
| Growth Rate | CAGR of 23.6% from 2026 to 2033 |
| Base year for estimation | 2025 |
| Historical data | 2021 – 2024 |
| Forecast period | 2026 – 2033 |
| Quantitative units | Revenue in USD Million and CAGR from 2026 to 2033 |
| Report coverage | Revenue forecast, company ranking, competitive landscape, growth factors, and trends |
| Segments covered | Platform, product, and region |
| Regional scope | North America; Europe; Asia Pacific; Latin America; Middle East & Africa |
| Country scope | U.S.; Canada; Mexico; UK; Germany; France; Italy; China; India; Japan; Australia; South Korea; Brazil; UAE; Saudi Arabia; South Africa |
| Key companies profiled | Printify, Inc.; Printful Inc.; Canva; VistaPrint (Cimpress); CustomCat; Gelato; Gooten; Printed Mint; Teelaunch; Zazzle, Inc.; RedBubble Group |
| Customization scope | Free report customization (equivalent up to 8 analysts working days) with purchase. Addition or alteration to country, regional & segment scope. |
Global Print on Demand Market Report Segmentation
This report forecasts revenue growths at global, regional, and country levels and provides an analysis of the industry trends in each of the sub-segments from 2021 to 2033. For the purpose of this study, Grand View Research has segmented the global print on demand market based on platform, product, and region.
• Platform Outlook (Revenue, USD Million, 2021 – 2033)
• Software
o Stand-alone
o Integrated
• Services
• Product Outlook (Revenue, USD Million, 2021 – 2033)
• Apparel
• Home Decor
• Drinkware
• Accessories
• Others
• Regional Outlook (Revenue, USD Million, 2021 – 2033)
• North America
o U.S.
o Canada
o Mexico
• Europe
o Germany
o UK
o France
o Italy
• Asia-Pacific
o China
o India
o Japan
o South Korea
o Australia
• Latin America
o Brazil
• Middle East & Africa
o KSA
o UAE
o South Africa
Table of Contents
Chapter 1. Methodology and Scope
1.1. Market Segmentation and Scope
1.2. Research Methodology
1.2.1. Information Procurement
1.3. Information or Data Analysis
1.4. Methodology
1.5. Research Scope and Assumptions
1.6. Market Formulation & Validation
1.7. Country Based Segment Share Calculation
1.8. List of Data Sources
Chapter 2. Executive Summary
2.1. Market Outlook
2.2. Segment Outlook
2.3. Competitive Insights
Chapter 3. Print on Demand Variables, Trends, & Scope
3.1. Market Lineage Outlook
3.2. Market Dynamics
3.2.1. Market Drivers Analysis
3.2.2. Market Restraints Analysis
3.2.3. Industry Challenge
3.3. Print on Demand Analysis Tools
3.3.1. Industry Analysis – Porter’s
3.3.1.1. Bargaining Power Of The Suppliers
3.3.1.2. Bargaining Power Of The Buyers
3.3.1.3. Threats Of Substitution
3.3.1.4. Threats From New Entrants
3.3.1.5. Competitive Rivalry
3.3.2. PESTEL Analysis
Chapter 4. Print on Demand Market: Platform Estimates & Trend Analysis
4.1. Segment Dashboard
4.2. Print on Demand Market: Platform Movement Analysis, 2025 & 2033 (USD Million)
4.3. Software
4.3.1. Software Market Revenue Estimates and Forecasts, 2021 – 2033 (USD Million)
4.3.2. Stand-alone
4.3.2.1. Software Market Revenue Estimates and Forecasts, 2021 – 2033 (USD Million)
4.3.3. Integrated
4.3.3.1. Software Market Revenue Estimates and Forecasts, 2021 – 2033 (USD Million)
4.4. Services
4.4.1. Services Market Revenue Estimates and Forecasts, 2021 – 2033 (USD Million)
Chapter 5. Print on Demand Market: Product Estimates & Trend Analysis
5.1. Segment Dashboard
5.2. Print on Demand Market: Product Movement Analysis, 2025 & 2033 (USD Million)
5.3. Apparel
5.3.1. Apparel Market Revenue Estimates and Forecasts, 2021 – 2033 (USD Million)
5.4. Home Decor
5.4.1. Home Decor Market Revenue Estimates and Forecasts, 2021 – 2033 (USD Million)
5.5. Drinkware
5.5.1. Drinkware Market Revenue Estimates and Forecasts, 2021 – 2033 (USD Million)
5.6. Accessories
5.6.1. Accessories Market Revenue Estimates and Forecasts, 2021 – 2033 (USD Million)
5.7. Others
5.7.1. Others Market Revenue Estimates and Forecasts, 2021 – 2033 (USD Million)
Chapter 6. Print on Demand Market Region Estimates & Trend Analysis
6.1. Print on Demand Market Share, By Region, 2025 & 2033, USD Million
6.2. North America
6.2.1. North America Print on Demand Market Estimates and Forecasts, 2021 – 2033 (USD Million)
6.2.2. U.S.
6.2.2.1. U.S. Print on Demand Market Estimates and Forecasts, 2021 – 2033 (USD Million)
6.2.3. Canada
6.2.3.1. Canada Print on Demand Market Estimates and Forecasts, 2021 – 2033 (USD Million)
6.2.4. Mexico
6.2.4.1. Mexico Print on Demand Market Estimates and Forecasts, 2021 – 2033 (USD Million)
6.3. Europe
6.3.1. Europe Print on Demand Market Estimates and Forecasts, 2021 – 2033 (USD Million)
6.3.2. UK
6.3.2.1. UK Print on Demand Market Estimates and Forecasts, 2021 – 2033 (USD Million)
6.3.3. Germany
6.3.3.1. Germany Print on Demand Market Estimates and Forecasts, 2021 – 2033 (USD Million)
6.3.4. France
6.3.4.1. France Print on Demand Market Estimates and Forecasts, 2021 – 2033 (USD Million)
6.3.5. Italy
6.3.5.1. Italy Print on Demand Market Estimates and Forecasts, 2021 – 2033 (USD Million)
6.4. Asia Pacific
6.4.1. Asia Pacific Print on Demand Market Estimates and Forecasts, 2021 – 2033 (USD Million)
6.4.2. China
6.4.2.1. China Print on Demand Market Estimates and Forecasts, 2021 – 2033 (USD Million)
6.4.3. India
6.4.3.1. India Print on Demand Market Estimates and Forecasts, 2021 – 2033 (USD Million)
6.4.4. Japan
6.4.4.1. Japan Print on Demand Market Estimates and Forecasts, 2021 – 2033 (USD Million)
6.4.5. Australia
6.4.5.1. Australia Print on Demand Market Estimates and Forecasts, 2021 – 2033 (USD Million)
6.4.6. South Korea
6.4.6.1. South Korea Print on Demand Market Estimates and Forecasts, 2021 – 2033 (USD Million)
6.5. Latin America
6.5.1. Latin America Print on Demand Market Estimates and Forecasts, 2021 – 2033 (USD Million)
6.5.2. Brazil
6.5.2.1. Brazil Print on Demand Market Estimates and Forecasts, 2021 – 2033 (USD Million)
6.6. MEA
6.6.1. MEA Print on Demand Market Estimates and Forecasts, 2021 – 2033 (USD Million)
6.6.2. UAE
6.6.2.1. UAE Print on Demand Market Estimates and Forecasts, 2021 – 2033 (USD Million)
6.6.3. KSA
6.6.3.1. KSA Print on Demand Market Estimates and Forecasts, 2021 – 2033 (USD Million)
6.6.4. South Africa
6.6.4.1. South Africa Print on Demand Market Estimates and Forecasts, 2021 – 2033 (USD Million)
Chapter 7. Competitive Landscape
7.1. Company Categorization
7.2. Company Market Positioning
7.3. Company Heat Map Analysis
7.4. Company Profiles/Listing
7.4.1. Printify, Inc.
7.4.1.1. Participant’s Overview
7.4.1.2. Financial Performance
7.4.1.3. Vehicle Type Benchmarking
7.4.1.4. Strategic Initiatives
7.4.2. Printful Inc.
7.4.2.1. Participant’s Overview
7.4.2.2. Financial Performance
7.4.2.3. Vehicle Type Benchmarking
7.4.2.4. Strategic Initiatives
7.4.3. Canva
7.4.3.1. Participant’s Overview
7.4.3.2. Financial Performance
7.4.3.3. Vehicle Type Benchmarking
7.4.3.4. Strategic Initiatives
7.4.4. VistaPrint (Cimpress)
7.4.4.1. Participant’s Overview
7.4.4.2. Financial Performance
7.4.4.3. Vehicle Type Benchmarking
7.4.4.4. Strategic Initiatives
7.4.5. CustomCat
7.4.5.1. Participant’s Overview
7.4.5.2. Financial Performance
7.4.5.3. Vehicle Type Benchmarking
7.4.5.4. Strategic Initiatives
7.4.6. Gelato
7.4.6.1. Participant’s Overview
7.4.6.2. Financial Performance
7.4.6.3. Vehicle Type Benchmarking
7.4.6.4. Strategic Initiatives
7.4.7. Gooten
7.4.7.1. Participant’s Overview
7.4.7.2. Financial Performance
7.4.7.3. Vehicle Type Benchmarking
7.4.7.4. Strategic Initiatives
7.4.8. Printed Mint
7.4.8.1. Participant’s Overview
7.4.8.2. Financial Performance
7.4.8.3. Vehicle Type Benchmarking
7.4.8.4. Strategic Initiatives
7.4.9. Teelaunch
7.4.9.1. Participant’s Overview
7.4.9.2. Financial Performance
7.4.9.3. Vehicle Type Benchmarking
7.4.9.4. Strategic Initiatives
7.4.10. Zazzle, Inc.
7.4.10.1. Participant’s Overview
7.4.10.2. Financial Performance
7.4.10.3. Vehicle Type Benchmarking
7.4.10.4. Strategic Initiatives
7.4.11. RedBubble Group
7.4.11.1. Participant’s Overview
7.4.11.2. Financial Performance
7.4.11.3. Vehicle Type Benchmarking
7.4.11.4. Strategic Initiatives
List of Tables
Table 1 Global Print on Demand market, by region, 2021 – 2033 (USD Million)
Table 2 Global Print on Demand market, by Platform, 2021 – 2033 (USD Million)
Table 3 Global Print on Demand market, by Product, 2021 – 2033 (USD Million)
Table 4 Global Print on Demand market, by Vehicle Type, 2021 – 2033 (USD Million)
Table 5 North America Print on Demand market, by Country, 2021 – 2033 (USD Million)
Table 6 North America Print on Demand market, by Platform, 2021 – 2033 (USD Million)
Table 7 North America Print on Demand market, by Product, 2021 – 2033 (USD Million)
Table 8 North America Print on Demand market, by Vehicle Type, 2021 – 2033 (USD Million)
Table 9 U.S. Print on Demand market, by Platform, 2021 – 2033 (USD Million)
Table 10 U.S. Print on Demand market, by Product, 2021 – 2033 (USD Million)
Table 11 Canada Print on Demand market, by Platform, 2021 – 2033 (USD Million)
Table 12 Canada Print on Demand market, by Product, 2021 – 2033 (USD Million)
Table 13 Mexico Print on Demand market, by Platform, 2021 – 2033 (USD Million)
Table 14 Mexico Print on Demand market, by Product, 2021 – 2033 (USD Million)
Table 15 Europe Print on Demand market, by Country, 2021 – 2033 (USD Million)
Table 16 Europe Print on Demand market, by Platform, 2021 – 2033 (USD Million)
Table 17 Europe Print on Demand market, by Product, 2021 – 2033 (USD Million)
Table 18 UK Print on Demand market, by Platform, 2021 – 2033 (USD Million)
Table 19 UK Print on Demand market, by Product, 2021 – 2033 (USD Million)
Table 20 Germany Print on Demand market, by Platform, 2021 – 2033 (USD Million)
Table 21 Germany Print on Demand market, by Product, 2021 – 2033 (USD Million)
Table 22 France Print on Demand market, by Platform, 2021 – 2033 (USD Million)
Table 23 France Print on Demand market, by Product, 2021 – 2033 (USD Million)
Table 24 Italy Print on Demand market, by Platform, 2021 – 2033 (USD Million)
Table 25 Italy Print on Demand market, by Product, 2021 – 2033 (USD Million)
Table 26 Asia Pacific Print on Demand market, by Country, 2021 – 2033 (USD Million)
Table 27 Asia Pacific Print on Demand market, by Platform, 2021 – 2033 (USD Million)
Table 28 Asia Pacific Print on Demand market, by Product, 2021 – 2033 (USD Million)
Table 29 China Print on Demand market, by Platform, 2021 – 2033 (USD Million)
Table 30 China Print on Demand market, by Product, 2021 – 2033 (USD Million)
Table 31 India Print on Demand market, by Platform, 2021 – 2033 (USD Million)
Table 32 India Print on Demand market, by Product, 2021 – 2033 (USD Million)
Table 33 Japan Print on Demand market, by Platform, 2021 – 2033 (USD Million)
Table 34 Japan Print on Demand market, by Product, 2021 – 2033 (USD Million)
Table 35 South Korea Print on Demand market, by Platform, 2021 – 2033 (USD Million)
Table 36 South Korea Print on Demand market, by Product, 2021 – 2033 (USD Million)
Table 37 Australia Print on Demand market, by Platform, 2021 – 2033 (USD Million)
Table 38 Australia Print on Demand market, by Product, 2021 – 2033 (USD Million)
Table 39 Latin America Print on Demand market, by Country, 2021 – 2033 (USD Million)
Table 40 Latin America Print on Demand market, by Platform, 2021 – 2033 (USD Million)
Table 41 Latin America Print on Demand market, by Product, 2021 – 2033 (USD Million)
Table 42 Brazil Print on Demand market, by Platform, 2021 – 2033 (USD Million)
Table 43 Brazil Print on Demand market, by Product, 2021 – 2033 (USD Million)
Table 44 MEA Print on Demand market, by Country, 2021 – 2033 (USD Million)
Table 45 MEA Print on Demand market, by Platform, 2021 – 2033 (USD Million)
Table 46 MEA Print on Demand market, by Product, 2021 – 2033 (USD Million)
Table 47 UAE Print on Demand market, by Platform, 2021 – 2033 (USD Million)
Table 48 UAE Print on Demand market, by Product, 2021 – 2033 (USD Million)
Table 49 KSA Print on Demand market, by Platform, 2021 – 2033 (USD Million)
Table 50 KSA Print on Demand market, by Product, 2021 – 2033 (USD Million)
Table 51 South Africa Print on Demand market, by Platform, 2021 – 2033 (USD Million)
Table 52 South Africa Print on Demand market, by Product, 2021 – 2033 (USD Million)
List of Figures
Fig. 1 Print on Demand market segmentation
Fig. 2 Market research process
Fig. 3 Information procurement
Fig. 4 Primary research pattern
Fig. 5 Market research approaches
Fig. 6 Value chain-based sizing & forecasting
Fig. 7 Parent market analysis
Fig. 8 Market formulation & validation
Fig. 9 Print on Demand market snapshot
Fig. 10 Print on Demand market segment snapshot
Fig. 11 Print on Demand market competitive landscape snapshot
Fig. 12 Market research process
Fig. 13 Market driver relevance analysis (Current & future impact)
Fig. 14 Market restraint relevance analysis (Current & future impact)
Fig. 15 Print on Demand market: Platform outlook key takeaways (USD Million)
Fig. 16 Print on Demand market: Platform movement analysis (USD Million), 2025 & 2033
Fig. 17 Software market revenue estimates and forecasts, 2021 – 2033 (USD Million)
Fig. 18 Stand-alone market revenue estimates and forecasts, 2021 – 2033 (USD Million)
Fig. 19 Integrated market revenue estimates and forecasts, 2021 – 2033 (USD Million)
Fig. 20 Services market revenue estimates and forecasts, 2021 – 2033 (USD Million)
Fig. 21 Print on Demand market: Product outlook key takeaways (USD Million)
Fig. 22 Print on Demand market: Product movement analysis (USD Million), 2025 & 2033
Fig. 23 Apparel market revenue estimates and forecasts, 2021 – 2033 (USD Million)
Fig. 24 Home Decor market revenue estimates and forecasts, 2021 – 2033 (USD Million)
Fig. 25 Drinkware market revenue estimates and forecasts, 2021 – 2033 (USD Million)
Fig. 26 Accessories market revenue estimates and forecasts, 2021 – 2033 (USD Million)
Fig. 27 Others market revenue estimates and forecasts, 2021 – 2033 (USD Million)
Fig. 28 Regional marketplace: Key takeaways
Fig. 29 Print on Demand market: Regional outlook, 2025 & 2033, USD Million
Fig. 30 North America Print on Demand market estimates and forecasts, 2021 – 2033 (USD Million)
Fig. 31 U.S. Print on Demand market estimates and forecasts, 2021 – 2033 (USD Million)
Fig. 32 Canada Print on Demand market estimates and forecasts, 2021 – 2033 (USD Million)
Fig. 33 Mexico Print on Demand market estimates and forecasts, 2021 – 2033 (USD Million)
Fig. 34 Europe Print on Demand market estimates and forecasts, 2021 – 2033 (USD Million)
Fig. 35 UK Print on Demand market estimates and forecasts, 2021 – 2033 (USD Million)
Fig. 36 Germany Print on Demand market estimates and forecasts, 2021 – 2033 (USD Million)
Fig. 37 France Print on Demand market estimates and forecasts, 2021 – 2033 (USD Million)
Fig. 38 Italy Print on Demand market estimates and forecasts, 2021 – 2033 (USD Million)
Fig. 39 Asia Pacific Print on Demand market estimates and forecasts, 2021 – 2033 (USD Million)
Fig. 40 China Print on Demand market estimates and forecasts, 2021 – 2033 (USD Million)
Fig. 41 India Print on Demand market estimates and forecasts, 2021 – 2033 (USD Million)
Fig. 42 Japan Print on Demand market estimates and forecasts, 2021 – 2033 (USD Million)
Fig. 43 South Korea Print on Demand market estimates and forecasts, 2021 – 2033 (USD Million)
Fig. 44 Australia Print on Demand market estimates and forecasts, 2021 – 2033 (USD Million)
Fig. 45 Latin America Print on Demand market estimates and forecasts, 2021 – 2033 (USD Million)
Fig. 46 Brazil Print on Demand market estimates and forecasts, 2021 – 2033 (USD Million)
Fig. 47 MEA Print on Demand market estimates and forecasts, 2021 – 2033 (USD Million)
Fig. 48 UAE Print on Demand market estimates and forecasts, 2021 – 2033 (USD Million)
Fig. 49 KSA Print on Demand market estimates and forecasts, 2021 – 2033 (USD Million)
Fig. 50 South Africa Print on Demand market estimates and forecasts, 2021 – 2033 (USD Million)
Fig. 51 Strategy framework
Fig. 52 Company categorization