光トランシーバー市場 - フォームファクター別、データレート別、ファイバータイプ別、コネクタ別、プロトコル別、距離別、波長別、用途別、地域、セグメント別予測による市場規模、成長と動向分析レポート 2026-2033年
Optical Transceivers Market Size, Share & Trends Analysis Report By Form Factor, By Data Rate, By Fiber Type, By Connector, By Protocol, By Distance, By Wavelength, By Application, By Region, And Segment Forecasts, 2026 - 2033
| 出版 | Grand View Research |
| 出版年月 | 2026年02月 |
| ページ数 | 100 |
| 価格 | 記載以外のライセンスについてはお問合せください |
| シングルユーザ | USD 4,950 |
| 種別 | 英文調査報告書 |
| 商品番号 | SMR-1616716167 |

光トランシーバー市場概要
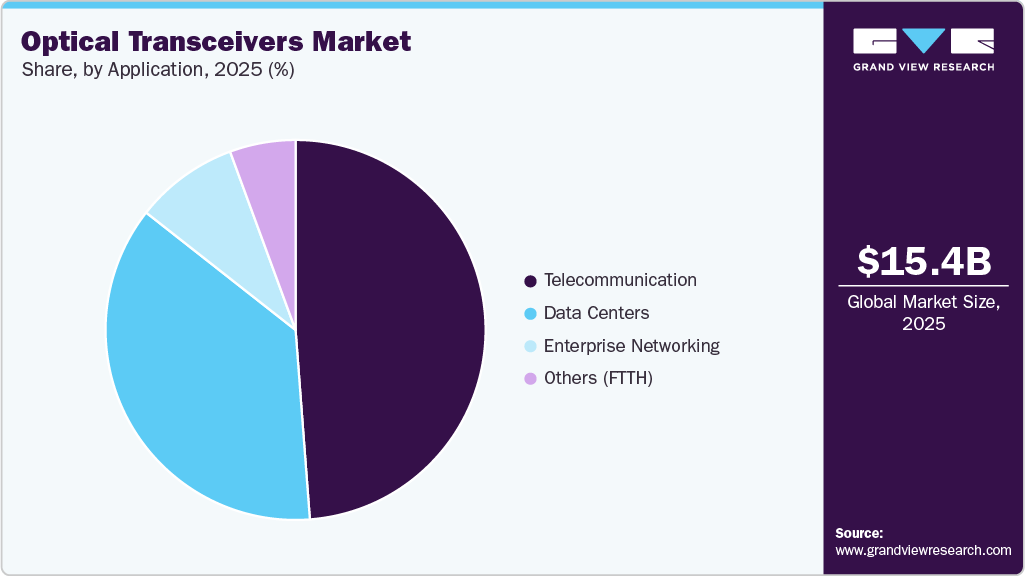
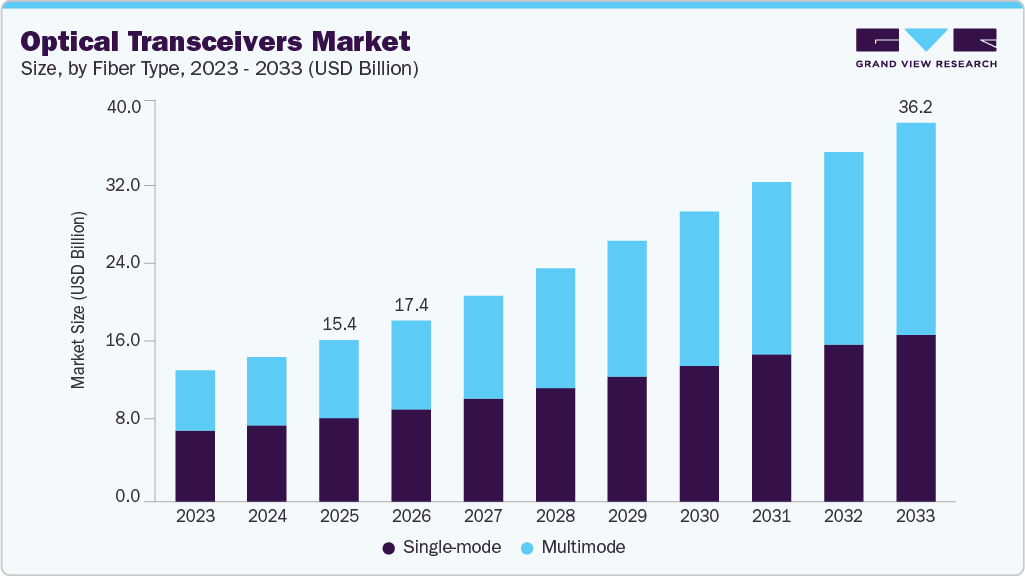
世界の光トランシーバー市場規模は、2025年には154億4000万米ドルと評価され、2033年までに362億4000万米ドルに達すると予測されており、2026年から2033年にかけて年平均成長率(CAGR)11.1%に達するとGrand View Researchでは予測しています。
この成長を牽引する要因としては、AIおよびクラウドワークロード向け高速光モジュールの採用拡大、レガシーネットワークから高度な100G~800Gアーキテクチャへのアップグレードの増加、企業ネットワークおよび通信ネットワークにおける光ファイバー接続の展開拡大、そして最新のデータセンター環境におけるエネルギー効率の高い光コンポーネントへの需要の高まりなどが挙げられます。
主要市場動向とインサイト
- 北米は、2025年に37.1%を超える最大の収益シェアを獲得し、世界の光トランシーバー市場を牽引しました。
- 米国は北米市場をリードし、2025年に最大の収益シェアを占めました。
- フォームファクター別では、QSFPセグメントが市場をリードし、2025年に37.9%を超える最大の収益シェアを獲得しました。
- ファイバータイプ別では、ディスクベースのシングルモードファイバー(SMF)セグメントが市場を支配し、2025年に約51.9%の収益シェアを占めました。
- アプリケーション別では、データセンターセグメントが2026年から2033年にかけて12.8%を超える最も高い年平均成長率(CAGR)で成長すると予測されています。
市場規模と予測
- 2025年市場規模:154億4,000万米ドル
- 2033年市場規模予測:362億4,000万米ドル
- 年平均成長率(2026年~2033年):11.1%
- 北米:2025年時点で最大の市場規模
データセンターや通信事業者が従来の10G/40G技術から移行するにつれ、高速光モジュールの需要が加速しています。AIトレーニングクラスター、クラウドワークロード、ハイパースケールプラットフォームは、100G、200G、400G、そして今後登場する800Gトランシーバーへの急速な移行を牽引しています。企業は、光ファイバーネットワークのリフレッシュサイクルにおいて、スループット効率、拡張性、そして長期的なネットワーク対応性をより重視するようになっています。この市場の変化は、数年にわたるアップグレードの波を引き起こし、コンポーネントサプライヤーの収益見通しを向上させています。高速接続がコアインフラストラクチャの優先事項となるにつれ、次世代光トランシーバーは、現代ネットワークの主要なパフォーマンス実現要素へと進化しています。
Optical Transceivers Market Summary
The global optical transceivers market size was valued at USD 15.44 billion in 2025 and is projected to reach USD 36.24 billion by 2033, growing at a CAGR of 11.1% from 2026 to 2033. The growth of the increasing adoption of high-speed optical modules for AI and cloud workloads, rising upgrades from legacy networks to advanced 100G to 800G architectures, expanding deployment of fiber-based connectivity across enterprise and telecom networks, and accelerating demand for energy-efficient optical components in modern data center environments.
optical-transceivers-market-size
Key Market Trends & Insights
- North America dominated the global Optical Transceivers market with the largest revenue share of over 37.1% in 2025.
- The optical transceivers market in the U.S. led the North America market and held the largest revenue share in 2025.
- By form factor, the QSFP segment led the market, holding the largest revenue share of over 37.9% in 2025.
- By fiber type, the disk-based Single-mode fiber (SMF) segment held the dominant position in the market and accounted for the leading revenue share of around 51.9% in 2025.
- By application, the data center segment is expected to grow at the fastest CAGR of over 12.8% from 2026 to 2033.
Market Size & Forecast
- 2025 Market Size: USD 15.44 Billion
- 2033 Projected Market Size: USD 36.24 Billion
- CAGR (2026-2033): 11.1%
- North America: Largest market in 2025
The demand for high-speed optical modules is accelerating as data centers and telecom operators shift away from legacy 10G/40G technologies. AI training clusters, cloud workloads, and hyperscale platforms are driving a rapid transition toward 100G, 200G, 400G, and emerging 800G transceivers. Enterprises now place greater emphasis on throughput efficiency, scalability, and long-term network readiness during fiber network refresh cycles. This market transition is unlocking a multi-year upgrade wave, improving revenue visibility for component suppliers. As high-speed connectivity becomes a core infrastructure priority, next-generation optical transceivers are evolving into the primary performance enabler of modern networks.
The optical transceivers industry is prioritizing energy-efficient modules as enterprises and telecom operators face rising power and operational costs. Vendors are rapidly innovating low-power DSPs, thermally optimized designs, and compact form factors to reduce the total cost of ownership. Growing adoption of green data center strategies is accelerating demand for energy-optimized 400G and 800G modules. This shift toward efficiency is strengthening the business case for modernizing aging optical infrastructure. As sustainability and cost optimization become board-level imperatives, energy-efficient transceivers are emerging as a central focus in strategic procurement.
The expansion of fiber networks by telecom operators is driven by the 5G rollout, small-cell densification, and increasing backhaul demands. Emerging fiber-deep architectures require long-reach, high-performance optical modules to ensure consistent and scalable connectivity across metro and access networks. Operators are prioritizing DWDM-enabled, coherent, and high-bandwidth transceivers to handle rising traffic loads. This wave of modernization is driving strong procurement momentum for 25G, 50G, 100G, and coherent optical modules. As telecom networks evolve to support next-generation mobility and broadband infrastructure, optical transceivers remain a critical driver of long-term industry growth.
Optical Transceivers Market Report Scope
| Report Attribute | Details |
| Market size value in 2025 | USD 17.36 billion |
| Revenue forecast in 2033 | USD 36.24 billion |
| Growth rate | CAGR of 11.1% from 2026 to 2033 |
| Actual data | 2021 – 2025 |
| Forecast period | 2026 – 2033 |
| Quantitative units | Revenue in USD billion/million and CAGR from 2026 to 2033 |
| Report coverage | Revenue forecast, company ranking, competitive landscape, growth factors, and trends |
| Segments covered | Form Factor, data rate, fiber type, connector, protocol, distance, wavelength, application, region |
| Regional scope | North America; Europe; Asia Pacific; Latin America; MEA |
| Country scope | U.S.; Canada; Mexico; Germany; UK; France; China; India; Japan; Australia; South Korea; Brazil; UAE; South Africa; KSA |
| Key companies profiled | Coherent Corp.; INNOLIGHT; Accelink Technology Co. Ltd.; Cisco Systems, Inc.; Broadcom Inc.; Lumentum Operations LLC; Sumitomo Electric Industries, Ltd.; Fujitsu Optical Components Limited; Intel Corporation; Eoptolink Technology Inc., Ltd. |
| Customization scope | Free report customization (equivalent up to 8 analysts working days) with purchase. Addition or alteration to country, regional & segment scope. |
Global Optical Transceivers Market Report Segmentation
This report forecasts revenue growth at global, regional, and country levels and provides an analysis of the latest industry trends in each of the sub-segments from 2021 to 2033. For this study, Grand View Research has segmented the global optical transceivers market report based on form factor, data rate, fiber type, connector, protocol, distance, wavelength, application, and region.
- Form Factor Outlook (Revenue, USD Million, 2021 – 2033)
- Small Form-factor Pluggable (SFP)
- Small Form-factor Pluggable Plus (SFP+)
- C Form-factor Pluggable (CFP)
- Quad Small Form-factor Pluggable (QSFP)
- Others
- Data Rate Outlook (Revenue, USD Million, 2021 – 2033)
- Less than 10 Gbps
- 10 Gbps to 40 Gbps
- 41 Gbps to 100 Gbps
- More than 100 Gbps
- Fiber Type Outlook (Revenue, USD Million, 2021 – 2033)
- Single-mode Fiber (SMF)
- Multimode Fiber (MMF)
- Connector Outlook (Revenue, USD Million, 2021 – 2033)
- Lucent Connector (LC)
- Subscriber Connector (SC)
- Multi-Fiber Push-On/Pull-Off (MPO)
- Registered Jack-45 (RJ-45)
- Protocol Outlook (Revenue, USD Million, 2021 – 2033)
- Ethernet
- Fiber Channel
- CWDM / DWDM
- FTTx
- Others
- Distance Outlook (Revenue, USD Million, 2021 – 2033)
- Short Distance
- Long Distance
- Wavelength Outlook (Revenue, USD Million, 2021 – 2033)
- 850 nm band
- 1310 nm band
- 1550 nm band
- Others
- Application Outlook (Revenue, USD Million, 2021 – 2033)
- Telecommunication
- Data Centers
- Enterprise Networking
- Others
- Regional Outlook (Revenue, USD Million, 2021 – 2033)
- North America
- U.S.
- Canada
- Mexico
- Europe
- UK
- Germany
- France
- Asia Pacific
- China
- India
- Japan
- Australia
- South Korea
- Latin America
- Brazil
- MEA
- UAE
- South Africa
- KSA
- North America
Table of Contents
Chapter 1. Methodology and Scope
1.1. Market Segmentation and Scope
1.2. Market Definitions
1.3. Research Methodology
1.3.1. Information Procurement
1.3.2. Information or Data Analysis
1.3.3. Market Formulation & Data Visualization
1.3.4. Data Validation & Publishing
1.4. Research Scope and Assumptions
1.4.1. List of Data Sources
Chapter 2. Executive Summary
2.1. Market Outlook
2.2. Segment Outlook
2.3. Competitive Insights
Chapter 3. Optical Transceivers Market Variables, Trends, & Scope
3.1. Market Introduction/Lineage Outlook
3.2. Market Size and Growth Prospects (USD Million)
3.3. Industry Value Chain Analysis
3.4. Market Dynamics
3.4.1. Market Drivers Analysis
3.4.2. Market Restraints Analysis
3.4.3. Industry Opportunities
3.4.4. Industry Challenges
3.5. Optical Transceivers Market Analysis Tools
3.5.1. Porter’s Analysis
3.5.1.1. Bargaining power of the suppliers
3.5.1.2. Bargaining power of the buyers
3.5.1.3. Threats of substitution
3.5.1.4. Threats from new entrants
3.5.1.5. Competitive rivalry
3.5.2. PESTEL Analysis
3.5.2.1. Political landscape
3.5.2.2. Economic landscape
3.5.2.3. Social landscape
3.5.2.4. Technological landscape
3.5.2.5. Environmental landscape
3.5.2.6. Legal landscape
Chapter 4. Optical Transceivers Market: Form Factor Estimates & Trend Analysis
4.1. Segment Dashboard
4.2. Optical Transceivers Market: Form Factor Movement Analysis, 2025 & 2033 (USD Million)
4.3. SFP
4.3.1. SFP Market Revenue Estimates and Forecasts, 2021 – 2033 (USD Million)
4.4. SFP+
4.4.1. SFP+ Market Revenue Estimates and Forecasts, 2021 – 2033 (USD Million)
4.5. CFP
4.5.1. CFP Market Revenue Estimates and Forecasts, 2021 – 2033 (USD Million)
4.6. QSFP
4.6.1. QSFP Market Revenue Estimates and Forecasts, 2021 – 2033 (USD Million)
4.7. Others
4.7.1. Others Market Revenue Estimates and Forecasts, 2021 – 2033 (USD Million)
Chapter 5. Optical Transceivers Market: Data Rate Estimates & Trend Analysis
5.1. Segment Dashboard
5.2. Optical Transceivers Market: Data Rate Movement Analysis, 2025 & 2033 (USD Million)
5.3. Less than 10 Gbps
5.3.1. Less than 10 Gbps Market Revenue Estimates and Forecasts, 2021 – 2033 (USD Million)
5.4. 10 Gbps to 40 Gbps
5.4.1. 10 Gbps to 40 Gbps Market Revenue Estimates and Forecasts, 2021 – 2033 (USD Million)
5.5. 41 Gbps to 100 Gbps
5.5.1. 41 Gbps to 100 Gbps Market Revenue Estimates and Forecasts, 2021 – 2033 (USD Million)
5.6. More than 100 Gbps
5.6.1. More than 100 Gbps Market Revenue Estimates and Forecasts, 2021 – 2033 (USD Million)
Chapter 6. Optical Transceivers Market: Fiber Type Estimates & Trend Analysis
6.1. Segment Dashboard
6.2. Optical Transceivers Market: Fiber Type Movement Analysis, 2025 & 2033 (USD Million)
6.3. Single-mode fiber (SMF)
6.3.1. Single-mode fiber (SMF) Market Revenue Estimates and Forecasts, 2021 – 2033 (USD Million)
6.4. Multimode fiber (MMF)
6.4.1. Multimode fiber (MMF) Market Revenue Estimates and Forecasts, 2021 – 2033 (USD Million)
Chapter 7. Optical Transceivers Market: Connector Estimates & Trend Analysis
7.1. Segment Dashboard
7.2. Optical Transceivers Market: Connector Movement Analysis, 2025 & 2033 (USD Million)
7.3. LC
7.3.1. LC Market Revenue Estimates and Forecasts, 2021 – 2033 (USD Million)
7.4. SC
7.4.1. SC Market Revenue Estimates and Forecasts, 2021 – 2033 (USD Million)
7.5. MPO
7.5.1. MPO Market Revenue Estimates and Forecasts, 2021 – 2033 (USD Million)
7.6. RJ-45
7.6.1. RJ-45 Market Revenue Estimates and Forecasts, 2021 – 2033 (USD Million)
Chapter 8. Optical Transceivers Market: Protocol Estimates & Trend Analysis
8.1. Segment Dashboard
8.2. Optical Transceivers Market: Protocol Movement Analysis, 2025 & 2033 (USD Million)
8.3. Ethernet
8.3.1. Ethernet Market Revenue Estimates and Forecasts, 2021 – 2033 (USD Million)
8.4. Fiber Channel
8.4.1. Fiber Channel Market Revenue Estimates and Forecasts, 2021 – 2033 (USD Million)
8.5. CWDM / DWDM
8.5.1. CWDM / DWDM Market Revenue Estimates and Forecasts, 2021 – 2033 (USD Million)
8.6. FTTx
8.6.1. FTTx Market Revenue Estimates and Forecasts, 2021 – 2033 (USD Million)
8.7. Others
8.7.1. Others Market Revenue Estimates and Forecasts, 2021 – 2033 (USD Million)
Chapter 9. Optical Transceivers Market: Distance Estimates & Trend Analysis
9.1. Segment Dashboard
9.2. Optical Transceivers Market: Distance Movement Analysis, 2025 & 2033 (USD Million)
9.3. Short Distance
9.3.1. Short Distance Market Revenue Estimates and Forecasts, 2021 – 2033 (USD Million)
9.4. Long Distance
9.4.1. Long Distance Market Revenue Estimates and Forecasts, 2021 – 2033 (USD Million)
Chapter 10. Optical Transceivers Market: Wavelength Estimates & Trend Analysis
10.1. Segment Dashboard
10.2. Optical Transceivers Market: Wavelength Movement Analysis, 2025 & 2033 (USD Million)
10.3. 850 nm band
10.3.1. 850 nm band Market Revenue Estimates and Forecasts, 2021 – 2033 (USD Million)
10.4. 1310 nm band
10.4.1. 1310 nm band Market Revenue Estimates and Forecasts, 2021 – 2033 (USD Million)
10.5. 1550 nm band
10.5.1. 1550 nm band Market Revenue Estimates and Forecasts, 2021 – 2033 (USD Million)
10.6. Others
10.6.1. Others Market Revenue Estimates and Forecasts, 2021 – 2033 (USD Million)
Chapter 11. Optical Transceivers Market: Application Estimates & Trend Analysis
11.1. Segment Dashboard
11.2. Optical Transceivers Market: Application Movement Analysis, 2025 & 2033 (USD Million)
11.3. Telecommunication
11.3.1. Telecommunication Market Revenue Estimates and Forecasts, 2021 – 2033 (USD Million)
11.4. Data Centers
11.4.1. Data Centers Market Revenue Estimates and Forecasts, 2021 – 2033 (USD Million)
11.5. Enterprise Networking
11.5.1. Enterprise Networking Market Revenue Estimates and Forecasts, 2021 – 2033 (USD Million)
11.6. Others
11.6.1. Others Market Revenue Estimates and Forecasts, 2021 – 2033 (USD Million)
Chapter 12. Optical Transceivers Market: Regional Estimates & Trend Analysis
12.1. Optical Transceivers Market Share, By Region, 2025 & 2033, USD Million
12.2. North America
12.2.1. North America Optical Transceivers Market Estimates and Forecasts, 2021 – 2033 (USD Million)
12.2.2. North America Optical Transceivers Market Estimates and Forecasts, by Form Factor, 2021 – 2033 (USD Million)
12.2.3. North America Optical Transceivers Market Estimates and Forecasts, by Data Rate, 2021 – 2033 (USD Million)
12.2.4. North America Optical Transceivers Market Estimates and Forecasts, by Fiber Type, 2021 – 2033 (USD Million)
12.2.5. North America Optical Transceivers Market Estimates and Forecasts, by Connector, 2021 – 2033 (USD Million)
12.2.6. North America Optical Transceivers Market Estimates and Forecasts, by Protocols, 2021 – 2033 (USD Million)
12.2.7. North America Optical Transceivers Market Estimates and Forecasts, by Distance, 2021 – 2033 (USD Million)
12.2.8. North America Optical Transceivers Market Estimates and Forecasts, by Wavelength, 2021 – 2033 (USD Million)
12.2.9. North America Optical Transceivers Market Estimates and Forecasts, by Application, 2021 – 2033 (USD Million)
12.2.10. U.S.
12.2.10.1. U.S. Optical Transceivers Market Estimates and Forecasts, 2021 – 2033 (USD Million)
12.2.10.2. U.S. Optical Transceivers Market Estimates and Forecasts, by Form Factor, 2021 – 2033 (USD Million)
12.2.10.3. U.S. Optical Transceivers Market Estimates and Forecasts, by Data Rate, 2021 – 2033 (USD Million)
12.2.10.4. U.S. Optical Transceivers Market Estimates and Forecasts, by Fiber Type, 2021 – 2033 (USD Million)
12.2.10.5. U.S. Optical Transceivers Market Estimates and Forecasts, by Connector, 2021 – 2033 (USD Million)
12.2.10.6. U.S. Optical Transceivers Market Estimates and Forecasts, by Protocols, 2021 – 2033 (USD Million)
12.2.10.7. U.S. Optical Transceivers Market Estimates and Forecasts, by Distance, 2021 – 2033 (USD Million)
12.2.10.8. U.S. Optical Transceivers Market Estimates and Forecasts, by Wavelength, 2021 – 2033 (USD Million)
12.2.10.9. U.S. Optical Transceivers Market Estimates and Forecasts, by Application, 2021 – 2033 (USD Million)
12.2.11. Canada
12.2.11.1. Canada Optical Transceivers Market Estimates and Forecasts, 2021 – 2033 (USD Million)
12.2.11.2. Canada Optical Transceivers Market Estimates and Forecasts, by Form Factor, 2021 – 2033 (USD Million)
12.2.11.3. Canada Optical Transceivers Market Estimates and Forecasts, by Data Rate, 2021 – 2033 (USD Million)
12.2.11.4. Canada Optical Transceivers Market Estimates and Forecasts, by Fiber Type, 2021 – 2033 (USD Million)
12.2.11.5. Canada Optical Transceivers Market Estimates and Forecasts, by Connector, 2021 – 2033 (USD Million)
12.2.11.6. Canada Optical Transceivers Market Estimates and Forecasts, by Protocols, 2021 – 2033 (USD Million)
12.2.11.7. Canada Optical Transceivers Market Estimates and Forecasts, by Distance, 2021 – 2033 (USD Million)
12.2.11.8. Canada Optical Transceivers Market Estimates and Forecasts, by Wavelength, 2021 – 2033 (USD Million)
12.2.11.9. Canada Optical Transceivers Market Estimates and Forecasts, by Application, 2021 – 2033 (USD Million)
12.2.12. Mexico
12.2.12.1. Mexico Optical Transceivers Market Estimates and Forecasts, 2021 – 2033 (USD Million)
12.2.12.2. Mexico Optical Transceivers Market Estimates and Forecasts, by Form Factor, 2021 – 2033 (USD Million)
12.2.12.3. Mexico Optical Transceivers Market Estimates and Forecasts, by Data Rate, 2021 – 2033 (USD Million)
12.2.12.4. Mexico Optical Transceivers Market Estimates and Forecasts, by Fiber Type, 2021 – 2033 (USD Million)
12.2.12.5. Mexico Optical Transceivers Market Estimates and Forecasts, by Connector, 2021 – 2033 (USD Million)
12.2.12.6. Mexico Optical Transceivers Market Estimates and Forecasts, by Protocols, 2021 – 2033 (USD Million)
12.2.12.7. Mexico Optical Transceivers Market Estimates and Forecasts, by Distance, 2021 – 2033 (USD Million)
12.2.12.8. Mexico Optical Transceivers Market Estimates and Forecasts, by Wavelength, 2021 – 2033 (USD Million)
12.2.12.9. Mexico Optical Transceivers Market Estimates and Forecasts, by Application, 2021 – 2033 (USD Million)
12.3. Europe
12.3.1. Europe Optical Transceivers Market Estimates and Forecasts, 2021 – 2033 (USD Million)
12.3.2. Europe Optical Transceivers Market Estimates and Forecasts, by Form Factor, 2021 – 2033 (USD Million)
12.3.3. Europe Optical Transceivers Market Estimates and Forecasts, by Data Rate, 2021 – 2033 (USD Million)
12.3.4. Europe Optical Transceivers Market Estimates and Forecasts, by Fiber Type, 2021 – 2033 (USD Million)
12.3.5. Europe Optical Transceivers Market Estimates and Forecasts, by Connector, 2021 – 2033 (USD Million)
12.3.6. Europe Optical Transceivers Market Estimates and Forecasts, by Protocols, 2021 – 2033 (USD Million)
12.3.7. Europe Optical Transceivers Market Estimates and Forecasts, by Distance, 2021 – 2033 (USD Million)
12.3.8. Europe Optical Transceivers Market Estimates and Forecasts, by Wavelength, 2021 – 2033 (USD Million)
12.3.9. Europe Optical Transceivers Market Estimates and Forecasts, by Application, 2021 – 2033 (USD Million)
12.3.10. UK
12.3.10.1. UK Optical Transceivers Market Estimates and Forecasts, 2021 – 2033 (USD Million)
12.3.10.2. UK Optical Transceivers Market Estimates and Forecasts, by Form Factor, 2021 – 2033 (USD Million)
12.3.10.3. UK Optical Transceivers Market Estimates and Forecasts, by Data Rate, 2021 – 2033 (USD Million)
12.3.10.4. UK Optical Transceivers Market Estimates and Forecasts, by Fiber Type, 2021 – 2033 (USD Million)
12.3.10.5. UK Optical Transceivers Market Estimates and Forecasts, by Connector, 2021 – 2033 (USD Million)
12.3.10.6. UK Optical Transceivers Market Estimates and Forecasts, by Protocols, 2021 – 2033 (USD Million)
12.3.10.7. UK Optical Transceivers Market Estimates and Forecasts, by Distance, 2021 – 2033 (USD Million)
12.3.10.8. UK Optical Transceivers Market Estimates and Forecasts, by Wavelength, 2021 – 2033 (USD Million)
12.3.10.9. UK Optical Transceivers Market Estimates and Forecasts, by Application, 2021 – 2033 (USD Million)
12.3.11. Germany
12.3.11.1. Germany Optical Transceivers Market Estimates and Forecasts, 2021 – 2033 (USD Million)
12.3.11.2. Germany Optical Transceivers Market Estimates and Forecasts, by Form Factor, 2021 – 2033 (USD Million)
12.3.11.3. Germany Optical Transceivers Market Estimates and Forecasts, by Data Rate, 2021 – 2033 (USD Million)
12.3.11.4. Germany Optical Transceivers Market Estimates and Forecasts, by Fiber Type, 2021 – 2033 (USD Million)
12.3.11.5. Germany Optical Transceivers Market Estimates and Forecasts, by Connector, 2021 – 2033 (USD Million)
12.3.11.6. Germany Optical Transceivers Market Estimates and Forecasts, by Protocols, 2021 – 2033 (USD Million)
12.3.11.7. Germany Optical Transceivers Market Estimates and Forecasts, by Distance, 2021 – 2033 (USD Million)
12.3.11.8. Germany Optical Transceivers Market Estimates and Forecasts, by Wavelength, 2021 – 2033 (USD Million)
12.3.11.9. Germany Optical Transceivers Market Estimates and Forecasts, by Application, 2021 – 2033 (USD Million)
12.3.12. France
12.3.12.1. France Optical Transceivers Market Estimates and Forecasts, 2021 – 2033 (USD Million)
12.3.12.2. France Optical Transceivers Market Estimates and Forecasts, by Form Factor, 2021 – 2033 (US Million)
12.3.12.3. France Optical Transceivers Market Estimates and Forecasts, by Data Rate, 2021 – 2033 (USD Million)
12.3.12.4. France Optical Transceivers Market Estimates and Forecasts, by Fiber Type, 2021 – 2033 (USD Million)
12.3.12.5. France Optical Transceivers Market Estimates and Forecasts, by Connector, 2021 – 2033 (USD Million)
12.3.12.6. France Optical Transceivers Market Estimates and Forecasts, by Protocols, 2021 – 2033 (USD Million)
12.3.12.7. France Optical Transceivers Market Estimates and Forecasts, by Distance, 2021 – 2033 (USD Million)
12.3.12.8. France Optical Transceivers Market Estimates and Forecasts, by Wavelength, 2021 – 2033 (USD Million)
12.3.12.9. France Optical Transceivers Market Estimates and Forecasts, by Application, 2021 – 2033 (USD Million)
12.4. Asia Pacific
12.4.1. Asia Pacific Optical Transceivers Market Estimates and Forecasts, 2021 – 2033 (USD Million)
12.4.2. Asia Pacific Optical Transceivers Market Estimates and Forecasts, by Form Factor, 2021 – 2033 (USD Million)
12.4.3. Asia Pacific Optical Transceivers Market Estimates and Forecasts, by Data Rate, 2021 – 2033 (USD Million)
12.4.4. Asia Pacific Optical Transceivers Market Estimates and Forecasts, by Fiber Type, 2021 – 2033 (USD Million)
12.4.5. Asia Pacific Optical Transceivers Market Estimates and Forecasts, by Connector, 2021 – 2033 (USD Million)
12.4.6. Asia Pacific Optical Transceivers Market Estimates and Forecasts, by Protocols, 2021 – 2033 (USD Million)
12.4.7. Asia Pacific Optical Transceivers Market Estimates and Forecasts, by Distance, 2021 – 2033 (USD Million)
12.4.8. Asia Pacific Optical Transceivers Market Estimates and Forecasts, by Wavelength, 2021 – 2033 (USD Million)
12.4.9. Asia Pacific Optical Transceivers Market Estimates and Forecasts, by Application, 2021 – 2033 (USD Million)
12.4.10. China
12.4.10.1. China Optical Transceivers Market Estimates and Forecasts, 2021 – 2033 (USD Million)
12.4.10.2. China Optical Transceivers Market Estimates and Forecasts, by Form Factor, 2021 – 2033 (USD Million)
12.4.10.3. China Optical Transceivers Market Estimates and Forecasts, by Data Rate, 2021 – 2033 (USD Million)
12.4.10.4. China Optical Transceivers Market Estimates and Forecasts, by Fiber Type, 2021 – 2033 (USD Million)
12.4.10.5. China Optical Transceivers Market Estimates and Forecasts, by Connector, 2021 – 2033 (USD Million)
12.4.10.6. China Optical Transceivers Market Estimates and Forecasts, by Protocols, 2021 – 2033 (USD Million)
12.4.10.7. China Optical Transceivers Market Estimates and Forecasts, by Distance, 2021 – 2033 (USD Million)
12.4.10.8. China Optical Transceivers Market Estimates and Forecasts, by Wavelength, 2021 – 2033 (USD Million)
12.4.10.9. China Optical Transceivers Market Estimates and Forecasts, by Application, 2021 – 2033 (USD Million)
12.4.11. Japan
12.4.11.1. Japan Optical Transceivers Market Estimates and Forecasts, 2021 – 2033 (USD Million)
12.4.11.2. Japan Optical Transceivers Market Estimates and Forecasts, by Form Factor, 2021 – 2033 (USD Million)
12.4.11.3. Japan Optical Transceivers Market Estimates and Forecasts, by Data Rate, 2021 – 2033 (USD Million)
12.4.11.4. Japan Optical Transceivers Market Estimates and Forecasts, by Fiber Type, 2021 – 2033 (USD Million)
12.4.11.5. Japan Optical Transceivers Market Estimates and Forecasts, by Connector, 2021 – 2033 (USD Million)
12.4.11.6. Japan Optical Transceivers Market Estimates and Forecasts, by Protocols, 2021 – 2033 (USD Million)
12.4.11.7. Japan Optical Transceivers Market Estimates and Forecasts, by Distance, 2021 – 2033 (USD Million)
12.4.11.8. Japan Optical Transceivers Market Estimates and Forecasts, by Wavelength, 2021 – 2033 (USD Million)
12.4.11.9. Japan Optical Transceivers Market Estimates and Forecasts, by Application, 2021 – 2033 (USD Million)
12.4.12. India
12.4.12.1. India Optical Transceivers Market Estimates and Forecasts, 2021 – 2033 (USD Million)
12.4.12.2. India Optical Transceivers Market Estimates and Forecasts, by Form Factor, 2021 – 2033 (USD Million)
12.4.12.3. India Optical Transceivers Market Estimates and Forecasts, by Data Rate, 2021 – 2033 (USD Million)
12.4.12.4. India Optical Transceivers Market Estimates and Forecasts, by Fiber Type, 2021 – 2033 (USD Million)
12.4.12.5. India Optical Transceivers Market Estimates and Forecasts, by Connector, 2021 – 2033 (USD Million)
12.4.12.6. India Optical Transceivers Market Estimates and Forecasts, by Protocols, 2021 – 2033 (USD Million)
12.4.12.7. India Optical Transceivers Market Estimates and Forecasts, by Distance, 2021 – 2033 (USD Million)
12.4.12.8. India Optical Transceivers Market Estimates and Forecasts, by Wavelength, 2021 – 2033 (USD Million)
12.4.12.9. India Optical Transceivers Market Estimates and Forecasts, by Application, 2021 – 2033 (USD Million)
12.4.13. South Korea
12.4.13.1. South Korea Optical Transceivers Market Estimates and Forecasts, 2021 – 2033 (USD Million)
12.4.13.2. South Korea Optical Transceivers Market Estimates and Forecasts, by Form Factor, 2021 – 2033 (USD Million)
12.4.13.3. South Korea Optical Transceivers Market Estimates and Forecasts, by Data Rate, 2021 – 2033 (USD Million)
12.4.13.4. South Korea Optical Transceivers Market Estimates and Forecasts, by Fiber Type, 2021 – 2033 (USD Million)
12.4.13.5. South Korea Optical Transceivers Market Estimates and Forecasts, by Connector, 2021 – 2033 (USD Million)
12.4.13.6. South Korea Optical Transceivers Market Estimates and Forecasts, by Protocols, 2021 – 2033 (USD Million)
12.4.13.7. South Korea Optical Transceivers Market Estimates and Forecasts, by Distance, 2021 – 2033 (USD Million)
12.4.13.8. South Korea Optical Transceivers Market Estimates and Forecasts, by Wavelength, 2021 – 2033 (USD Million)
12.4.13.9. South Korea Optical Transceivers Market Estimates and Forecasts, by Application, 2021 – 2033 (USD Million)
12.4.14. Australia
12.4.14.1. Australia Optical Transceivers Market Estimates and Forecasts, 2021 – 2033 (USD Million)
12.4.14.2. Australia Optical Transceivers Market Estimates and Forecasts, by Form Factor, 2021 – 2033 (USD Million)
12.4.14.3. Australia Optical Transceivers Market Estimates and Forecasts, by Data Rate, 2021 – 2033 (USD Million)
12.4.14.4. Australia Optical Transceivers Market Estimates and Forecasts, by Fiber Type, 2021 – 2033 (USD Million)
12.4.14.5. Australia Optical Transceivers Market Estimates and Forecasts, by Connector, 2021 – 2033 (USD Million)
12.4.14.6. Australia Optical Transceivers Market Estimates and Forecasts, by Protocols, 2021 – 2033 (USD Million)
12.4.14.7. Australia Optical Transceivers Market Estimates and Forecasts, by Distance, 2021 – 2033 (USD Million)
12.4.14.8. Australia Optical Transceivers Market Estimates and Forecasts, by Wavelength, 2021 – 2033 (USD Million)
12.4.14.9. Australia Optical Transceivers Market Estimates and Forecasts, by Application, 2021 – 2033 (USD Million)
12.5. Latin America
12.5.1. Latin America Optical Transceivers Market Estimates and Forecasts, 2021 – 2033 (USD Million)
12.5.2. Latin America Optical Transceivers Market Estimates and Forecasts, by Form Factor, 2021 – 2033 (USD Million)
12.5.3. Latin America Optical Transceivers Market Estimates and Forecasts, by Data Rate, 2021 – 2033 (USD Million)
12.5.4. Latin America Optical Transceivers Market Estimates and Forecasts, by Fiber Type, 2021 – 2033 (USD Million)
12.5.5. Latin America Optical Transceivers Market Estimates and Forecasts, by Connector, 2021 – 2033 (USD Million)
12.5.6. Latin America Optical Transceivers Market Estimates and Forecasts, by Protocols, 2021 – 2033 (USD Million)
12.5.7. Latin America Optical Transceivers Market Estimates and Forecasts, by Distance, 2021 – 2033 (USD Million)
12.5.8. Latin America Optical Transceivers Market Estimates and Forecasts, by Wavelength, 2021 – 2033 (USD Million)
12.5.9. Latin America Optical Transceivers Market Estimates and Forecasts, by Application, 2021 – 2033 (USD Million)
12.5.10. Brazil
12.5.10.1. Brazil Optical Transceivers Market Estimates and Forecasts, 2021 – 2033 (USD Million)
12.5.10.2. Brazil Optical Transceivers Market Estimates and Forecasts, by Form Factor, 2021 – 2033 (USD Million)
12.5.10.3. Brazil Optical Transceivers Market Estimates and Forecasts, by Data Rate, 2021 – 2033 (USD Million)
12.5.10.4. Brazil Optical Transceivers Market Estimates and Forecasts, by Fiber Type, 2021 – 2033 (USD Million)
12.5.10.5. Brazil Optical Transceivers Market Estimates and Forecasts, by Connector, 2021 – 2033 (USD Million)
12.5.10.6. Brazil Optical Transceivers Market Estimates and Forecasts, by Protocols, 2021 – 2033 (USD Million)
12.5.10.7. Brazil Optical Transceivers Market Estimates and Forecasts, by Distance, 2021 – 2033 (USD Million)
12.5.10.8. Brazil Optical Transceivers Market Estimates and Forecasts, by Wavelength, 2021 – 2033 (USD Million)
12.5.10.9. Brazil Optical Transceivers Market Estimates and Forecasts, by Application, 2021 – 2033 (USD Million)
12.6. Middle East & Africa
12.6.1. Middle East & Africa Optical Transceivers Market Estimates and Forecasts, 2021 – 2033 (USD Million)
12.6.2. Middle East & Africa Optical Transceivers Market Estimates and Forecasts, by Form Factor, 2021 – 2033 (USD Million)
12.6.3. Middle East & Africa Optical Transceivers Market Estimates and Forecasts, by Data Rate, 2021 – 2033 (USD Million)
12.6.4. Middle East & Africa Optical Transceivers Market Estimates and Forecasts, by Fiber Type, 2021 – 2033 (USD Million)
12.6.5. Middle East & Africa Optical Transceivers Market Estimates and Forecasts, by Connector, 2021 – 2033 (USD Million)
12.6.6. Middle East & Africa Optical Transceivers Market Estimates and Forecasts, by Protocols, 2021 – 2033 (USD Million)
12.6.7. Middle East & Africa Optical Transceivers Market Estimates and Forecasts, by Distance, 2021 – 2033 (USD Million)
12.6.8. Middle East & Africa Optical Transceivers Market Estimates and Forecasts, by Wavelength, 2021 – 2033 (USD Million)
12.6.9. Middle East & Africa Optical Transceivers Market Estimates and Forecasts, by Application, 2021 – 2033 (USD Million)
12.6.10. KSA
12.6.10.1. KSA Optical Transceivers Market Estimates and Forecasts, 2021 – 2033 (USD Million)
12.6.10.2. KSA Optical Transceivers Market Estimates and Forecasts, by Form Factor, 2021 – 2033 (USD Million)
12.6.10.3. KSA Optical Transceivers Market Estimates and Forecasts, by Data Rate, 2021 – 2033 (USD Million)
12.6.10.4. KSA Optical Transceivers Market Estimates and Forecasts, by Fiber Type, 2021 – 2033 (USD Million)
12.6.10.5. KSA Optical Transceivers Market Estimates and Forecasts, by Connector, 2021 – 2033 (USD Million)
12.6.10.6. KSA Optical Transceivers Market Estimates and Forecasts, by Protocols, 2021 – 2033 (USD Million)
12.6.10.7. KSA Optical Transceivers Market Estimates and Forecasts, by Distance, 2021 – 2033 (USD Million)
12.6.10.8. KSA Optical Transceivers Market Estimates and Forecasts, by Wavelength, 2021 – 2033 (USD Million)
12.6.10.9. KSA Optical Transceivers Market Estimates and Forecasts, by Application, 2021 – 2033 (USD Million)
12.6.11. UAE
12.6.11.1. UAE Optical Transceivers Market Estimates and Forecasts, 2021 – 2033 (USD Million)
12.6.11.2. UAE Optical Transceivers Market Estimates and Forecasts, by Form Factor, 2021 – 2033 (USD Million)
12.6.11.3. UAE Optical Transceivers Market Estimates and Forecasts, by Data Rate, 2021 – 2033 (USD Million)
12.6.11.4. UAE Optical Transceivers Market Estimates and Forecasts, by Fiber Type, 2021 – 2033 (USD Million)
12.6.11.5. UAE Optical Transceivers Market Estimates and Forecasts, by Connector, 2021 – 2033 (USD Million)
12.6.11.6. UAE Optical Transceivers Market Estimates and Forecasts, by Protocols, 2021 – 2033 (USD Million)
12.6.11.7. UAE Optical Transceivers Market Estimates and Forecasts, by Distance, 2021 – 2033 (USD Million)
12.6.11.8. UAE Optical Transceivers Market Estimates and Forecasts, by Wavelength, 2021 – 2033 (USD Million)
12.6.11.9. UAE Optical Transceivers Market Estimates and Forecasts, by Application, 2021 – 2033 (USD Million)
12.6.12. South Africa
12.6.12.1. South Africa Optical Transceivers Market Estimates and Forecasts, 2021 – 2033 (USD Million)
12.6.12.2. South Africa Optical Transceivers Market Estimates and Forecasts, by Form Factor, 2021 – 2033 (USD Million)
12.6.12.3. South Africa Optical Transceivers Market Estimates and Forecasts, by Data Rate, 2021 – 2033 (USD Million)
12.6.12.4. South Africa Optical Transceivers Market Estimates and Forecasts, by Fiber Type, 2021 – 2033 (USD Million)
12.6.12.5. South Africa Optical Transceivers Market Estimates and Forecasts, by Connector, 2021 – 2033 (USD Million)
12.6.12.6. South Africa Optical Transceivers Market Estimates and Forecasts, by Protocols, 2021 – 2033 (USD Million)
12.6.12.7. South Africa Optical Transceivers Market Estimates and Forecasts, by Distance, 2021 – 2033 (USD Million)
12.6.12.8. South Africa Optical Transceivers Market Estimates and Forecasts, by Wavelength, 2021 – 2033 (USD Million)
12.6.12.9. South Africa Optical Transceivers Market Estimates and Forecasts, by Application, 2021 – 2033 (USD Million)
Chapter 13. Competitive Landscape
13.1. Recent Developments & Impact Analysis by Key Market Participants
13.2. Company Categorization
13.3. Company Market Positioning
13.4. Company Heat Map Analysis
13.5. Strategy Mapping
13.5.1. Expansion
13.5.2. Mergers & Acquisition
13.5.3. Partnerships & Collaborations
13.5.4. New Product Launches
13.5.5. Research and Development
13.6. Company Profiles
13.6.1. Coherent Corp.
13.6.1.1. Participant’s Overview
13.6.1.2. Financial Performance
13.6.1.3. Product Benchmarking
13.6.1.4. Recent Developments
13.6.2. INNOLIGHT
13.6.2.1. Participant’s Overview
13.6.2.2. Financial Performance
13.6.2.3. Product Benchmarking
13.6.2.4. Recent Developments
13.6.3. Accelink Technology Co. Ltd.
13.6.3.1. Participant’s Overview
13.6.3.2. Financial Performance
13.6.3.3. Product Benchmarking
13.6.3.4. Recent Developments
13.6.4. Cisco Systems, Inc.
13.6.4.1. Participant’s Overview
13.6.4.2. Financial Performance
13.6.4.3. Product Benchmarking
13.6.4.4. Recent Developments
13.6.5. Broadcom Inc.
13.6.5.1. Participant’s Overview
13.6.5.2. Financial Performance
13.6.5.3. Product Benchmarking
13.6.5.4. Recent Developments
13.6.6. Lumentum Operations LLC
13.6.6.1. Participant’s Overview
13.6.6.2. Financial Performance
13.6.6.3. Product Benchmarking
13.6.6.4. Recent Developments
13.6.7. Sumitomo Electric Industries, Ltd.
13.6.7.1. Participant’s Overview
13.6.7.2. Financial Performance
13.6.7.3. Product Benchmarking
13.6.7.4. Recent Developments
13.6.8. Fujitsu Optical Components Limited
13.6.8.1. Participant’s Overview
13.6.8.2. Financial Performance
13.6.8.3. Product Benchmarking
13.6.8.4. Recent Developments
13.6.9. Intel Corporation
13.6.9.1. Participant’s Overview
13.6.9.2. Financial Performance
13.6.9.3. Product Benchmarking
13.6.9.4. Recent Developments
13.6.10. Eoptolink Technology Inc., Ltd.
13.6.10.1. Participant’s Overview
13.6.10.2. Financial Performance
13.6.10.3. Product Benchmarking
13.6.10.4. Recent Developments
List of Tables
Table 1 Optical Transceivers – industry snapshot & key buying criteria, 2021 – 2033
Table 2 Global Optical Transceivers market, 2021 – 2033 (USD Million)
Table 3 Global Optical Transceivers market estimates and forecast by Form Factor, 2021 – 2033 (USD Million)
Table 4 Global Optical Transceivers market estimates and forecast by Data Rate, 2021 – 2033 (USD Million)
Table 5 Global Optical Transceivers market estimates and forecast by Fiber Type, 2021 – 2033 (USD Million)
Table 6 Global Optical Transceivers market estimates and forecast by Connector, 2021 – 2033 (USD Million)
Table 7 Global Optical Transceivers market estimates and forecast by Protocol, 2021 – 2033 (USD Million)
Table 8 Global Optical Transceivers market estimates and forecast by Distance, 2021 – 2033 (USD Million)
Table 9 Global Optical Transceivers market estimates and forecast by Wavelength, 2021 – 2033 (USD Million)
Table 10 Global Optical Transceivers market estimates and forecast by Application, 2021 – 2033 (USD Million)
Table 11 Global Optical Transceivers market estimates and forecasts by region, 2021 – 2033 (USD Million)
Table 12 Optical Transceivers market estimates and forecast by SFP, 2021 – 2033 (USD Million)
Table 13 Optical Transceivers market estimates and forecast by SFP+, 2021 – 2033 (USD Million)
Table 14 Optical Transceivers market estimates and forecast by CFP, 2021 – 2033 (USD Million)
Table 15 Optical Transceivers market estimates and forecast by QSFP, 2021 – 2033 (USD Million)
Table 16 Optical Transceivers market estimates and forecast by Others, 2021 – 2033 (USD Million)
Table 17 Optical Transceivers market estimates and forecast by Less than 10 Gbps, 2021 – 2033 (USD Million)
Table 18 Optical Transceivers market estimates and forecast by 10 Gbps to 40 Gbps, 2021 – 2033 (USD Million)
Table 19 Optical Transceivers market estimates and forecast by 41 Gbps to 100 Gbps, 2021 – 2033 (USD Million)
Table 20 Optical Transceivers market estimates and forecast by More than 100 Gbps, 2021 – 2033 (USD Million)
Table 21 Optical Transceivers market estimates and forecast by Single-mode fiber (SMF), 2021 – 2033 (USD Million)
Table 22 Optical Transceivers market estimates and forecast by Multimode fiber (MMF), 2021 – 2033 (USD Million)
Table 23 Optical Transceivers market estimates and forecast by LC, 2021 – 2033 (USD Million)
Table 24 Optical Transceivers market estimates and forecast by SC, 2021 – 2033 (USD Million)
Table 25 Optical Transceivers market estimates and forecast by MPO, 2021 – 2033 (USD Million)
Table 26 Optical Transceivers market estimates and forecast by RJ-45, 2021 – 2033 (USD Million)
Table 27 Optical Transceivers market estimates and forecast by Ethernet, 2021 – 2033 (USD Million)
Table 28 Optical Transceivers market estimates and forecast by Fiber Channel, 2021 – 2033 (USD Million)
Table 29 Optical Transceivers market estimates and forecast by CWDM / DWDM, 2021 – 2033 (USD Million)
Table 30 Optical Transceivers market estimates and forecast by FTTx, 2021 – 2033 (USD Million)
Table 31 Optical Transceivers market estimates and forecast by Others, 2021 – 2033 (USD Million)
Table 32 Optical Transceivers market estimates and forecast by Short Distance, 2021 – 2033 (USD Million)
Table 33 Optical Transceivers market estimates and forecast by Long Distance, 2021 – 2033 (USD Million)
Table 34 Optical Transceivers market estimates and forecast by 850 nm band, 2021 – 2033 (USD Million)
Table 35 Optical Transceivers market estimates and forecast by 1310 nm band, 2021 – 2033 (USD Million)
Table 36 Optical Transceivers market estimates and forecast by 1550 nm band, 2021 – 2033 (USD Million)
Table 37 Optical Transceivers market estimates and forecast by Others, 2021 – 2033 (USD Million)
Table 38 Optical Transceivers market estimates and forecast by Telecommunication, 2021 – 2033 (USD Million)
Table 39 Optical Transceivers market estimates and forecast by Data Centers, 2021 – 2033 (USD Million)
Table 40 Optical Transceivers market estimates and forecast by Enterprise Networking, 2021 – 2033 (USD Million)
Table 41 Optical Transceivers market estimates and forecast by Others, 2021 – 2033 (USD Million)
Table 42 North America Optical Transceivers Market Estimates and Forecast, 2021 – 2033 (USD Million)
Table 43 North America Optical Transceivers market estimates and forecast, by Form Factor, 2021 – 2033 (USD Million)
Table 44 North America Optical Transceivers market estimates and forecast, by Data Rate, 2021 – 2033 (USD Million)
Table 45 North America Optical Transceivers market estimates and forecast, by Fiber Type, 2021 – 2033 (USD Million)
Table 46 North America Optical Transceivers market estimates and forecast, by Connector, 2021 – 2033 (USD Million)
Table 47 North America Optical Transceivers market estimates and forecast, by Protocol, 2021 – 2033 (USD Million)
Table 48 North America Optical Transceivers market estimates and forecast, by Distance, 2021 – 2033 (USD Million)
Table 49 North America Optical Transceivers market estimates and forecast, by Wavelength, 2021 – 2033 (USD Million)
Table 50 North America Optical Transceivers market estimates and forecast, by Application, 2021 – 2033 (USD Million)
Table 51 US Optical Transceivers market estimates and forecast, by Form Factor, 2021 – 2033 (USD Million)
Table 52 US Optical Transceivers market estimates and forecast, by Data Rate, 2021 – 2033 (USD Million)
Table 53 US Optical Transceivers market estimates and forecast, by Fiber Type, 2021 – 2033 (USD Million)
Table 54 US Optical Transceivers market estimates and forecast, by Connector, 2021 – 2033 (USD Million)
Table 55 US Optical Transceivers market estimates and forecast, by Protocol, 2021 – 2033 (USD Million)
Table 56 US Optical Transceivers market estimates and forecast, by Distance, 2021 – 2033 (USD Million)
Table 57 US Optical Transceivers market estimates and forecast, by Wavelength, 2021 – 2033 (USD Million)
Table 58 US Optical Transceivers market estimates and forecast, by Application, 2021 – 2033 (USD Million)
Table 59 Canada Optical Transceivers market estimates and forecast, by Form Factor, 2021 – 2033 (USD Million)
Table 60 Canada Optical Transceivers market estimates and forecast, by Data Rate, 2021 – 2033 (USD Million)
Table 61 Canada Optical Transceivers market estimates and forecast, by Fiber Type, 2021 – 2033 (USD Million)
Table 62 Canada Optical Transceivers market estimates and forecast, by Connector, 2021 – 2033 (USD Million)
Table 63 Canada Optical Transceivers market estimates and forecast, by Protocol, 2021 – 2033 (USD Million)
Table 64 Canada Optical Transceivers market estimates and forecast, by Distance, 2021 – 2033 (USD Million)
Table 65 Canada Optical Transceivers market estimates and forecast, by Wavelength, 2021 – 2033 (USD Million)
Table 66 Canada Optical Transceivers market estimates and forecast, by Application, 2021 – 2033 (USD Million)
Table 67 Mexico Optical Transceivers market estimates and forecast, by Form Factor, 2021 – 2033 (USD Million)
Table 68 Mexico Optical Transceivers market estimates and forecast, by Data Rate, 2021 – 2033 (USD Million)
Table 69 Mexico Optical Transceivers market estimates and forecast, by Fiber Type, 2021 – 2033 (USD Million)
Table 70 Mexico Optical Transceivers market estimates and forecast, by Connector, 2021 – 2033 (USD Million)
Table 71 Mexico Optical Transceivers market estimates and forecast, by Protocol, 2021 – 2033 (USD Million)
Table 72 Mexico Optical Transceivers market estimates and forecast, by Distance, 2021 – 2033 (USD Million)
Table 73 Mexico Optical Transceivers market estimates and forecast, by Wavelength, 2021 – 2033 (USD Million)
Table 74 Mexico Optical Transceivers market estimates and forecast, by Application, 2021 – 2033 (USD Million)
Table 75 Europe Optical Transceivers Market Estimates and Forecast, 2021 – 2033 (USD Million)
Table 76 Europe Optical Transceivers market estimates and forecast, by Form Factor, 2021 – 2033 (USD Million)
Table 77 Europe Optical Transceivers market estimates and forecast, by Data Rate, 2021 – 2033 (USD Million)
Table 78 Europe Optical Transceivers market estimates and forecast, by Fiber Type, 2021 – 2033 (USD Million)
Table 79 Europe Optical Transceivers market estimates and forecast, by Connector, 2021 – 2033 (USD Million)
Table 80 Europe Optical Transceivers market estimates and forecast, by Protocol, 2021 – 2033 (USD Million)
Table 81 Europe Optical Transceivers market estimates and forecast, by Distance, 2021 – 2033 (USD Million)
Table 82 Europe Optical Transceivers market estimates and forecast, by Wavelength, 2021 – 2033 (USD Million)
Table 83 Europe Optical Transceivers market estimates and forecast, by Application, 2021 – 2033 (USD Million)
Table 84 Germany Optical Transceivers market estimates and forecast, by Form Factor, 2021 – 2033 (USD Million)
Table 85 Germany Optical Transceivers market estimates and forecast, by Data Rate, 2021 – 2033 (USD Million)
Table 86 Germany Optical Transceivers market estimates and forecast, by Fiber Type, 2021 – 2033 (USD Million)
Table 87 Germany Optical Transceivers market estimates and forecast, by Connector, 2021 – 2033 (USD Million)
Table 88 Germany Optical Transceivers market estimates and forecast, by Protocol, 2021 – 2033 (USD Million)
Table 89 Germany Optical Transceivers market estimates and forecast, by Distance, 2021 – 2033 (USD Million)
Table 90 Germany Optical Transceivers market estimates and forecast, by Wavelength, 2021 – 2033 (USD Million)
Table 91 Germany Optical Transceivers market estimates and forecast, by Application, 2021 – 2033 (USD Million)
Table 92 UK Optical Transceivers market estimates and forecast, by Form Factor, 2021 – 2033 (USD Million)
Table 93 UK Optical Transceivers market estimates and forecast, by Data Rate, 2021 – 2033 (USD Million)
Table 94 UK Optical Transceivers market estimates and forecast, by Fiber Type, 2021 – 2033 (USD Million)
Table 95 UK Optical Transceivers market estimates and forecast, by Connector, 2021 – 2033 (USD Million)
Table 96 UK Optical Transceivers market estimates and forecast, by Protocol, 2021 – 2033 (USD Million)
Table 97 UK Optical Transceivers market estimates and forecast, by Distance, 2021 – 2033 (USD Million)
Table 98 UK Optical Transceivers market estimates and forecast, by Wavelength, 2021 – 2033 (USD Million)
Table 99 UK Optical Transceivers market estimates and forecast, by Application, 2021 – 2033 (USD Million)
Table 100 France Optical Transceivers market estimates and forecast, by Form Factor, 2021 – 2033 (USD Million)
Table 101 France Optical Transceivers market estimates and forecast, by Data Rate, 2021 – 2033 (USD Million)
Table 102 France Optical Transceivers market estimates and forecast, by Fiber Type, 2021 – 2033 (USD Million)
Table 103 France Optical Transceivers market estimates and forecast, by Connector, 2021 – 2033 (USD Million)
Table 104 France Optical Transceivers market estimates and forecast, by Protocol, 2021 – 2033 (USD Million)
Table 105 France Optical Transceivers market estimates and forecast, by Distance, 2021 – 2033 (USD Million)
Table 106 France Optical Transceivers market estimates and forecast, by Wavelength, 2021 – 2033 (USD Million)
Table 107 France Optical Transceivers market estimates and forecast, by Application, 2021 – 2033 (USD Million)
Table 108 Asia Pacific Optical Transceivers Market Estimates and Forecast, 2021 – 2033 (USD Million)
Table 109 Asia Pacific Optical Transceivers market estimates and forecast, by Form Factor, 2021 – 2033 (USD Million)
Table 110 Asia Pacific Optical Transceivers market estimates and forecast, by Data Rate, 2021 – 2033 (USD Million)
Table 111 Asia Pacific Optical Transceivers market estimates and forecast, by Fiber Type, 2021 – 2033 (USD Million)
Table 112 Asia Pacific Optical Transceivers market estimates and forecast, by Connector, 2021 – 2033 (USD Million)
Table 113 Asia Pacific Optical Transceivers market estimates and forecast, by Protocol, 2021 – 2033 (USD Million)
Table 114 Asia Pacific Optical Transceivers market estimates and forecast, by Distance, 2021 – 2033 (USD Million)
Table 115 Asia Pacific Optical Transceivers market estimates and forecast, by Wavelength, 2021 – 2033 (USD Million)
Table 116 Asia Pacific Optical Transceivers market estimates and forecast, by Application, 2021 – 2033 (USD Million)
Table 117 China Optical Transceivers market estimates and forecast, by Form Factor, 2021 – 2033 (USD Million)
Table 118 China Optical Transceivers market estimates and forecast, by Data Rate, 2021 – 2033 (USD Million)
Table 119 China Optical Transceivers market estimates and forecast, by Fiber Type, 2021 – 2033 (USD Million)
Table 120 China Optical Transceivers market estimates and forecast, by Connector, 2021 – 2033 (USD Million)
Table 121 China Optical Transceivers market estimates and forecast, by Protocol, 2021 – 2033 (USD Million)
Table 122 China Optical Transceivers market estimates and forecast, by Distance, 2021 – 2033 (USD Million)
Table 123 China Optical Transceivers market estimates and forecast, by Wavelength, 2021 – 2033 (USD Million)
Table 124 China Optical Transceivers market estimates and forecast, by Application, 2021 – 2033 (USD Million)
Table 125 Japan Optical Transceivers market estimates and forecast, by Form Factor, 2021 – 2033 (USD Million)
Table 126 Japan Optical Transceivers market estimates and forecast, by Data Rate, 2021 – 2033 (USD Million)
Table 127 Japan Optical Transceivers market estimates and forecast, by Fiber Type, 2021 – 2033 (USD Million)
Table 128 Japan Optical Transceivers market estimates and forecast, by Connector, 2021 – 2033 (USD Million)
Table 129 Japan Optical Transceivers market estimates and forecast, by Protocol, 2021 – 2033 (USD Million)
Table 130 Japan Optical Transceivers market estimates and forecast, by Distance, 2021 – 2033 (USD Million)
Table 131 Japan Optical Transceivers market estimates and forecast, by Wavelength, 2021 – 2033 (USD Million)
Table 132 Japan Optical Transceivers market estimates and forecast, by Application, 2021 – 2033 (USD Million)
Table 133 India Optical Transceivers market estimates and forecast, by Form Factor, 2021 – 2033 (USD Million)
Table 134 India Optical Transceivers market estimates and forecast, by Data Rate, 2021 – 2033 (USD Million)
Table 135 India Optical Transceivers market estimates and forecast, by Fiber Type, 2021 – 2033 (USD Million)
Table 136 India Optical Transceivers market estimates and forecast, by Connector, 2021 – 2033 (USD Million)
Table 137 India Optical Transceivers market estimates and forecast, by Protocol, 2021 – 2033 (USD Million)
Table 138 India Optical Transceivers market estimates and forecast, by Distance, 2021 – 2033 (USD Million)
Table 139 India Optical Transceivers market estimates and forecast, by Wavelength, 2021 – 2033 (USD Million)
Table 140 India Optical Transceivers market estimates and forecast, by Application, 2021 – 2033 (USD Million)
Table 141 South Korea Optical Transceivers market estimates and forecast, by Form Factor, 2021 – 2033 (USD Million)
Table 142 South Korea Optical Transceivers market estimates and forecast, by Data Rate, 2021 – 2033 (USD Million)
Table 143 South Korea Optical Transceivers market estimates and forecast, by Fiber Type, 2021 – 2033 (USD Million)
Table 144 South Korea Optical Transceivers market estimates and forecast, by Connector, 2021 – 2033 (USD Million)
Table 145 South Korea Optical Transceivers market estimates and forecast, by Protocol, 2021 – 2033 (USD Million)
Table 146 South Korea Optical Transceivers market estimates and forecast, by Distance, 2021 – 2033 (USD Million)
Table 147 South Korea Optical Transceivers market estimates and forecast, by Wavelength, 2021 – 2033 (USD Million)
Table 148 South Korea Optical Transceivers market estimates and forecast, by Application, 2021 – 2033 (USD Million)
Table 149 Australia Optical Transceivers market estimates and forecast, by Form Factor, 2021 – 2033 (USD Million)
Table 150 Australia Optical Transceivers market estimates and forecast, by Data Rate, 2021 – 2033 (USD Million)
Table 151 Australia Optical Transceivers market estimates and forecast, by Fiber Type, 2021 – 2033 (USD Million)
Table 152 Australia Optical Transceivers market estimates and forecast, by Connector, 2021 – 2033 (USD Million)
Table 153 Australia Optical Transceivers market estimates and forecast, by Protocol, 2021 – 2033 (USD Million)
Table 154 Australia Optical Transceivers market estimates and forecast, by Distance, 2021 – 2033 (USD Million)
Table 155 Australia Optical Transceivers market estimates and forecast, by Wavelength, 2021 – 2033 (USD Million)
Table 156 Australia Optical Transceivers market estimates and forecast, by Application, 2021 – 2033 (USD Million)
Table 157 Latin America Optical Transceivers Market Estimates and Forecast, 2021 – 2033 (USD Million)
Table 158 Latin America Optical Transceivers market estimates and forecast, by Form Factor, 2021 – 2033 (USD Million)
Table 159 Latin America Optical Transceivers market estimates and forecast, by Data Rate, 2021 – 2033 (USD Million)
Table 160 Latin America Optical Transceivers market estimates and forecast, by Fiber Type, 2021 – 2033 (USD Million)
Table 161 Latin America Optical Transceivers market estimates and forecast, by Connector, 2021 – 2033 (USD Million)
Table 162 Latin America Optical Transceivers market estimates and forecast, by Protocol, 2021 – 2033 (USD Million)
Table 163 Latin America Optical Transceivers market estimates and forecast, by Distance, 2021 – 2033 (USD Million)
Table 164 Latin America Optical Transceivers market estimates and forecast, by Wavelength, 2021 – 2033 (USD Million)
Table 165 Latin America Optical Transceivers market estimates and forecast, by Application, 2021 – 2033 (USD Million)
Table 166 Brazil Optical Transceivers market estimates and forecast, by Form Factor, 2021 – 2033 (USD Million)
Table 167 Brazil Optical Transceivers market estimates and forecast, by Data Rate, 2021 – 2033 (USD Million)
Table 168 Brazil Optical Transceivers market estimates and forecast, by Fiber Type, 2021 – 2033 (USD Million)
Table 169 Brazil Optical Transceivers market estimates and forecast, by Connector, 2021 – 2033 (USD Million)
Table 170 Brazil Optical Transceivers market estimates and forecast, by Protocol, 2021 – 2033 (USD Million)
Table 171 Brazil Optical Transceivers market estimates and forecast, by Distance, 2021 – 2033 (USD Million)
Table 172 Brazil Optical Transceivers market estimates and forecast, by Wavelength, 2021 – 2033 (USD Million)
Table 173 Brazil Optical Transceivers market estimates and forecast, by Application, 2021 – 2033 (USD Million)
Table 174 Middle East and Africa (MEA) Optical Transceivers Market Estimates and Forecast, 2021 – 2033 (USD Million)
Table 175 Middle East and Africa (MEA) Optical Transceivers market estimates and forecast, by Form Factor, 2021 – 2033 (USD Million)
Table 176 Middle East and Africa (MEA) Optical Transceivers market estimates and forecast, by Data Rate, 2021 – 2033 (USD Million)
Table 177 Middle East and Africa (MEA) Optical Transceivers market estimates and forecast, by Fiber Type, 2021 – 2033 (USD Million)
Table 178 Middle East and Africa (MEA) Optical Transceivers market estimates and forecast, by Connector, 2021 – 2033 (USD Million)
Table 179 Middle East and Africa (MEA) Optical Transceivers market estimates and forecast, by Protocol, 2021 – 2033 (USD Million)
Table 180 Middle East and Africa (MEA) Optical Transceivers market estimates and forecast, by Distance, 2021 – 2033 (USD Million)
Table 181 Middle East and Africa (MEA) Optical Transceivers market estimates and forecast, by Wavelength, 2021 – 2033 (USD Million)
Table 182 Middle East and Africa (MEA) Optical Transceivers market estimates and forecast, by Application, 2021 – 2033 (USD Million)
Table 183 UAE Optical Transceivers market estimates and forecast, by Form Factor, 2021 – 2033 (USD Million)
Table 184 UAE Optical Transceivers market estimates and forecast, by Data Rate, 2021 – 2033 (USD Million)
Table 185 UAE Optical Transceivers market estimates and forecast, by Fiber Type, 2021 – 2033 (USD Million)
Table 186 UAE Optical Transceivers market estimates and forecast, by Connector, 2021 – 2033 (USD Million)
Table 187 UAE Optical Transceivers market estimates and forecast, by Protocol, 2021 – 2033 (USD Million)
Table 188 UAE Optical Transceivers market estimates and forecast, by Distance, 2021 – 2033 (USD Million)
Table 189 UAE Optical Transceivers market estimates and forecast, by Wavelength, 2021 – 2033 (USD Million)
Table 190 UAE Optical Transceivers market estimates and forecast, by Application, 2021 – 2033 (USD Million)
Table 191 KSA Optical Transceivers market estimates and forecast, by Form Factor, 2021 – 2033 (USD Million)
Table 192 KSA Optical Transceivers market estimates and forecast, by Data Rate, 2021 – 2033 (USD Million)
Table 193 KSA Optical Transceivers market estimates and forecast, by Fiber Type, 2021 – 2033 (USD Million)
Table 194 KSA Optical Transceivers market estimates and forecast, by Connector, 2021 – 2033 (USD Million)
Table 195 KSA Optical Transceivers market estimates and forecast, by Protocol, 2021 – 2033 (USD Million)
Table 196 KSA Optical Transceivers market estimates and forecast, by Distance, 2021 – 2033 (USD Million)
Table 197 KSA Optical Transceivers market estimates and forecast, by Wavelength, 2021 – 2033 (USD Million)
Table 198 KSA Optical Transceivers market estimates and forecast, by Application, 2021 – 2033 (USD Million)
Table 199 South Africa Optical Transceivers market estimates and forecast, by Form Factor, 2021 – 2033 (USD Million)
Table 200 South Africa Optical Transceivers market estimates and forecast, by Data Rate, 2021 – 2033 (USD Million)
Table 201 South Africa Optical Transceivers market estimates and forecast, by Fiber Type, 2021 – 2033 (USD Million)
Table 202 South Africa Optical Transceivers market estimates and forecast, by Connector, 2021 – 2033 (USD Million)
Table 203 South Africa Optical Transceivers market estimates and forecast, by Protocol, 2021 – 2033 (USD Million)
Table 204 South Africa Optical Transceivers market estimates and forecast, by Distance, 2021 – 2033 (USD Million)
Table 205 South Africa Optical Transceivers market estimates and forecast, by Wavelength, 2021 – 2033 (USD Million)
Table 206 South Africa Optical Transceivers market estimates and forecast, by Application, 2021 – 2033 (USD Million)
List of Figures
Fig. 1 Optical Transceivers Market Segmentation
Fig. 2 Technology landscape
Fig. 3 Information Procurement
Fig. 4 Data Analysis Models
Fig. 5 Market Formulation and Validation
Fig. 6 Data Validating & Publishing
Fig. 7 Market Snapshot
Fig. 8 Segment Snapshot (1/4)
Fig. 9 Segment Snapshot (2/4)
Fig. 10 Segment Snapshot (3/4)
Fig. 11 Segment Snapshot (4/4)
Fig. 12 Competitive Landscape Snapshot
Fig. 13 Optical Transceivers- Market Size and Growth Prospects (USD Million)
Fig. 14 Optical Transceivers Market: Industry Value Chain Analysis
Fig. 15 Optical Transceivers Market: Market Dynamics
Fig. 16 Optical Transceivers Market: PORTER’s Analysis
Fig. 17 Optical Transceivers Market: PESTEL Analysis
Fig. 18 Optical Transceivers Market Share by Form Factor, 2025 & 2033 (USD Million)
Fig. 19 Optical Transceivers Market, by Form Factor: Market Share, 2025 & 2033
Fig. 20 SFP Market Estimates & Forecasts, 2021 – 2033 (Revenue, USD Million)
Fig. 21 SFP+ Market Estimates & Forecasts, 2021 – 2033 (Revenue, USD Million)
Fig. 22 CFP Market Estimates & Forecasts, 2021 – 2033 (Revenue, USD Million)
Fig. 23 QSFP Market Estimates & Forecasts, 2021 – 2033 (Revenue, USD Million)
Fig. 24 Others Market Estimates & Forecasts, 2021 – 2033 (Revenue, USD Million)
Fig. 25 Optical Transceivers Market Share by Data Rate, 2025 & 2033 (USD Million)
Fig. 26 Optical Transceivers Market, by Data Rate: Market Share, 2025 & 2033
Fig. 27 Less than 10 Gbps Market Estimates & Forecasts, 2021 – 2033 (Revenue, USD Million)
Fig. 28 10 Gbps to 40 Gbps Market Estimates & Forecasts, 2021 – 2033 (Revenue, USD Million)
Fig. 29 41 Gbps to 100 Gbps Market Estimates & Forecasts, 2021 – 2033 (Revenue, USD Million)
Fig. 30 More than 100 Gbps Market Estimates & Forecasts, 2021 – 2033 (Revenue, USD Million)
Fig. 31 Optical Transceivers Market Share by Fiber Type, 2025 & 2033 (USD Million)
Fig. 32 Optical Transceivers Market, by Fiber Type: Market Share, 2025 & 2033
Fig. 33 Single-mode Fiber (SMF) Market Estimates & Forecasts, 2021 – 2033 (Revenue, USD Million)
Fig. 34 Multimode Fiber (MMF) Market Estimates & Forecasts, 2021 – 2033 (Revenue, USD Million)
Fig. 35 Optical Transceivers Market Share by Connector, 2025 & 2033 (USD Million)
Fig. 36 Optical Transceivers Market, by Connector: Market Share, 2025 & 2033
Fig. 37 LC Market Estimates & Forecasts, 2021 – 2033 (Revenue, USD Million)
Fig. 38 SC Market Estimates & Forecasts, 2021 – 2033 (Revenue, USD Million)
Fig. 39 MPO Market Estimates & Forecasts, 2021 – 2033 (Revenue, USD Million)
Fig. 40 RJ-45 Market Estimates & Forecasts, 2021 – 2033 (Revenue, USD Million)
Fig. 41 Optical Transceivers Market Share by Protocol, 2025 & 2033 (USD Million)
Fig. 42 Optical Transceivers Market, by Protocol: Market Share, 2025 & 2033
Fig. 43 Ethernet Market Estimates & Forecasts, 2021 – 2033 (Revenue, USD Million)
Fig. 44 Fiber Channel Market Estimates & Forecasts, 2021 – 2033 (Revenue, USD Million)
Fig. 45 CWDM / DWDM Market Estimates & Forecasts, 2021 – 2033 (Revenue, USD Million)
Fig. 46 FTTx Market Estimates & Forecasts, 2021 – 2033 (Revenue, USD Million)
Fig. 47 Others Market Estimates & Forecasts, 2021 – 2033 (Revenue, USD Million)
Fig. 48 Optical Transceivers Market Share by Distance, 2025 & 2033 (USD Million)
Fig. 49 Optical Transceivers Market, by Distance: Market Share, 2025 & 2033
Fig. 50 Short Distance Market Estimates & Forecasts, 2021 – 2033 (Revenue, USD Million)
Fig. 51 Long Distance Market Estimates & Forecasts, 2021 – 2033 (Revenue, USD Million)
Fig. 52 Optical Transceivers Market Share by Wavelength, 2025 & 2033 (USD Million)
Fig. 53 Optical Transceivers Market, by Wavelength: Market Share, 2025 & 2033
Fig. 54 850 nm band Market Estimates & Forecasts, 2021 – 2033 (Revenue, USD Million)
Fig. 55 1310 nm band Market Estimates & Forecasts, 2021 – 2033 (Revenue, USD Million)
Fig. 56 1550 nm band Market Estimates & Forecasts, 2021 – 2033 (Revenue, USD Million)
Fig. 57 Others Market Estimates & Forecasts, 2021 – 2033 (Revenue, USD Million)
Fig. 58 Optical Transceivers Market Share by Application, 2025 & 2033 (USD Million)
Fig. 59 Optical Transceivers Market, by Application: Market Share, 2025 & 2033
Fig. 60 Telecommunication Market Estimates & Forecasts, 2021 – 2033 (Revenue, USD Million)
Fig. 61 Data Centers Market Estimates & Forecasts, 2021 – 2033 (Revenue, USD Million)
Fig. 62 Enterprise Networking Market Estimates & Forecasts, 2021 – 2033 (Revenue, USD Million)
Fig. 63 Others Market Estimates & Forecasts, 2021 – 2033 (Revenue, USD Million)
Fig. 64 Optical Transceivers Market Revenue, by Region, 2025 & 2033 (USD Million)
Fig. 65 Regional Marketplace: Key Takeaways
Fig. 66 North America Optical Transceivers Market Estimates and Forecasts, 2021 – 2033 (USD Million)
Fig. 67 U.S. Optical Transceivers Market Estimates and Forecasts, 2021 – 2033 (USD Million)
Fig. 68 Canada Optical Transceivers Market Estimates and Forecasts, 2021 – 2033 (USD Million)
Fig. 69 Mexico Optical Transceivers Market Estimates and Forecasts, 2021 – 2033 (USD Million)
Fig. 70 Europe Optical Transceivers Market Estimates and Forecasts, 2021 – 2033 (USD Million)
Fig. 71 UK Optical Transceivers Market Estimates and Forecasts, 2021 – 2033) (USD Million)
Fig. 72 Germany Optical Transceivers Market Estimates and Forecasts, (2021 – 2033) (USD Million)
Fig. 73 France Optical Transceivers Market Estimates and Forecasts, (2021 – 2033) (USD Million)
Fig. 74 Asia Pacific Optical Transceivers Market Estimates and Forecast, 2021 – 2033 (USD Million)
Fig. 75 China Optical Transceivers Market Estimates and Forecasts, 2021 – 2033 (USD Million)
Fig. 76 Japan Optical Transceivers Market Estimates and Forecasts, 2021 – 2033 (USD Million)
Fig. 77 India Optical Transceivers Market Estimates and Forecasts, 2021 – 2033 (USD Million)
Fig. 78 Australia Optical Transceivers Market Estimates and Forecasts, 2021 – 2033 (USD Million)
Fig. 79 South Korea Optical Transceivers Market Estimates and Forecasts, 2021 – 2033 (USD Million)
Fig. 80 Latin America Optical Transceivers Market Estimates and Forecasts, 2021 – 2033 (USD Million)
Fig. 81 Brazil Optical Transceivers Market Estimates and Forecasts, 2021 – 2033 (USD Million)
Fig. 82 MEA Optical Transceivers Market Estimates and Forecasts, 2021 – 2033 (USD Million)
Fig. 83 UAE Optical Transceivers Market Estimates and Forecasts, 2021 – 2033 (USD Million)
Fig. 84 South Africa Optical Transceivers Market Estimates and Forecasts, 2021 – 2033 (USD Million)
Fig. 85 KSA Optical Transceivers Market Estimates and Forecasts, 2021 – 2033 (USD Million)
Fig. 86 Key Company Categorization
Fig. 87 Company Market Positioning
Fig. 88 Strategic Framework