Bicycle Market Size, Share & Trends Analysis Report
Bicycle Market Size, Share & Trends Analysis Report By Product (Mountain Bikes, Hybrid Bikes, Road Bikes, Cargo Bikes), By Technology (Electric, Conventional), By End Use, By Distribution Channel, By Region, And Segment Forecasts, 2026 - 2033
自転車市場 - 製品(マウンテンバイク、ハイブリッドバイク、ロードバイク、カーゴバイク)、テクノロジー(電動、従来型)、最終用途、流通チャネル、地域、セグメント別予測による市場規模、成長と動向分析レポート 2026-2033年
| 出版 | Grand View Research |
| 出版年月 | 2025年12月 |
| ページ数 | 120 |
| 価格 | 記載以外のライセンスについてはお問合せください |
| シングルユーザ | USD 4,950 |
| 種別 | 英文調査報告書 |
| 商品番号 | SMR-1187611876 |

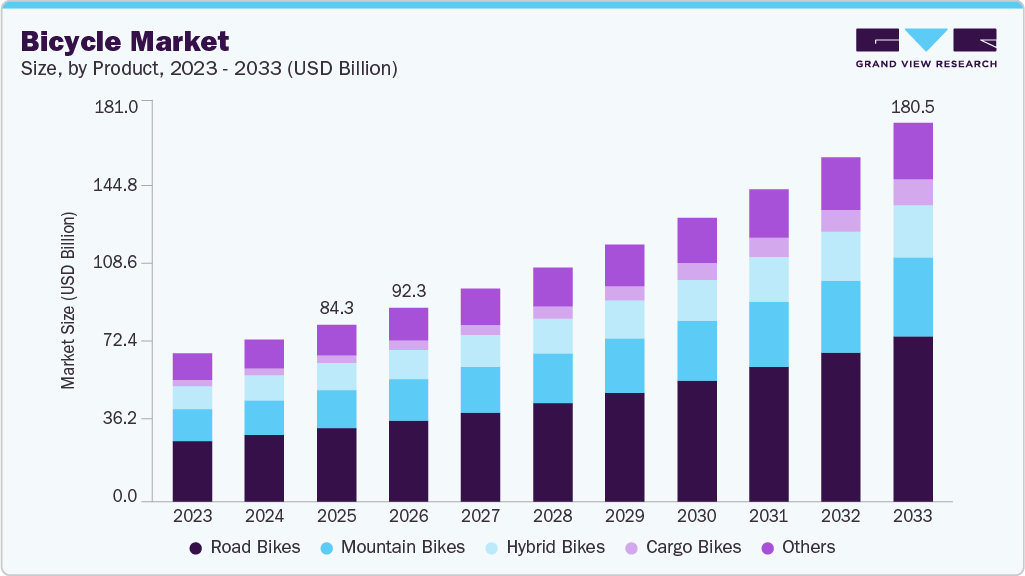
世界の自転車市場規模は、2025年には842億5,000万米ドルと推定され、2033年には1,805億3,000万米ドルに達すると予測されています。これは、2026年から2033年にかけて年平均成長率(CAGR)10.1%で成長する見込みです。自転車市場は、日常の移動手段、フィットネス、短距離通勤などにおける自転車利用の増加を背景に、成長を加速しています。
自転車専用レーンや都市型自転車シェアリングシステムなど、自転車専用インフラへの投資増加により、より安全で利用しやすい走行環境が実現し、市場のさらなる成長を後押ししています。通勤者が自動車や公共交通機関に代わる、費用対効果が高く排出量の少ない交通手段を求める中、電動自転車への急速な移行が業界に大きな推進力を与えています。軽量素材、バッテリー効率、GPSトラッキングやアプリによる診断機能などのコネクテッド機能の進歩により、ユーザーの利便性とパフォーマンスが全体的に向上しています。
このレポートでは、世界、地域、国レベルでの収益成長を予測し、2018年から2033年までの各サブセグメントの最新の業界動向の分析を提供します。この調査では、Grand View Researchが世界の自転車市場レポートを製品、テクノロジー、流通チャネル、最終用途、地域に基づいてセグメント化しました。
Bicycle Market Summary
The global bicycle market size was estimated at USD 84.25 billion in 2025, and is projected to reach USD 180.53 billion by 2033, growing at a CAGR of 10.1% from 2026 to 2033.The bicycle market is gaining momentum, driven by increasing adoption of cycling for daily mobility, fitness, and short-distance commuting.
Rising investments in dedicated cycling infrastructure, including protected lanes and urban bike-sharing systems, are enabling safer and more accessible riding environments, which is further supporting market uptake. The rapid shift toward e-bikes is adding strong propulsion to the industry as commuters seek cost-efficient, low-emission alternatives to cars and public transport. Advancements in lightweight materials, battery efficiency, and connected features such as GPS tracking and app-enabled diagnostics are enhancing overall user convenience and performance.
However, high upfront costs for premium bicycles and e-bikes, along with inadequate infrastructure in suburban and rural regions, continue to pose challenges for broader market penetration.
Preference for bicycles as a convenient form of exercise to ensure a healthy life, free from obesity and other disorders, is expected to further drive the market expansion. The popularity of dockless bicycle-sharing systems has been rising lately. This system allows users to locate a bicycle nearby and unlock it electronically. Incepted originally in Europe, dockless bicycle-sharing systems are gaining popularity, particularly in Asian nations such as India and China.
Furthermore, recent advancements in mobile app development and Global Positioning System (GPS) have resulted in app-based dockless bicycle-sharing systems. Moreover, the growing adoption of such dockless bicycle-sharing systems is anticipated to fuel the demand for cycles significantly. Chinese bicycle-sharing companies are particularly investing and expanding their operations aggressively in European nations to capitalize on the market opportunities. This is expected to boost market growth further in the forthcoming years.
Bicycle Market Report Scope
| Report Attribute | Details |
| Market size value in 2026 | USD 92.30 billion |
| Revenue forecast in 2033 | USD 180.53 billion |
| Growth rate | CAGR of 10.1% from 2026 to 2033 |
| Base year for estimation | 2025 |
| Historical data | 2021 – 2024 |
| Forecast period | 2026 – 2033 |
| Quantitative units | Revenue in USD Million and CAGR from 2026 to 2033 |
| Report coverage | Revenue forecast, company market share, competitive landscape, growth factors, and trends |
| Segments covered | Product, technology, distribution channel, end use, region |
| Regional scope | North America; Europe; Asia Pacific; Latin America; Middle East & Africa |
| Country scope | U.S.; Canada; Mexico; UK; Germany; France; China; India; Japan; Australia; South Korea; Brazil; UAE; Kingdom of Saudi Arabia (KSA); South Africa |
| Key companies profiled | Accell Group; Atlas Cycles (Haryana) Ltd.; Avon Cycles Ltd.; Cervelo; Dorel Industries Inc.; Giant Bicycles; Merida Industry Co., Ltd; Specialized Bicycle Components, Inc.; SCOTT Sports SA; Trek Bicycle Corporation; BH Bikes; Axalko Bikes; Hagen Bikes; Mammoth bikes; Egurra Bikes; Garri Bike |
| Customization scope | Free report customization (equivalent up to 8 analysts working days) with purchase. Addition or alteration to country, regional & segment scope. |
Global Bicycle Market Report Segmentation
This report forecasts revenue growth at global, regional, and country levels and provides an analysis of the latest industry trends in each of the sub-segments from 2018 to 2033. For this study, Grand View Research has segmented the global bicycle market report based on product, technology, distribution channel, end use, and region.
• Product Outlook (Revenue, USD Million, 2021 – 2033)
• Mountain Bikes
• Hybrid Bikes
• Road Bikes
• Cargo Bikes
• Others
• Technology Outlook (Revenue, USD Million, 2021 – 2033)
• Electric
• Conventional
• Distribution Channel Outlook (Revenue, USD Million, 2021 – 2033)
• Online
• Offline
• End Use Outlook (Revenue, USD Million, 2021 – 2033)
• Men
• Women
• Kids
• Regional Outlook (Revenue, USD Million, 2021 – 2033)
• North America
o U.S.
o Canada
o Mexico
• Europe
o UK
o Germany
o France
• Asia Pacific
o China
o India
o Japan
o Australia
o South Korea
• Latin America
o Brazil
• Middle East & Africa (MEA)
o UAE
o Kingdom of Saudi Arabia (KSA)
o South Africa
Table of Contents
Chapter 1. Methodology and Scope
1.1. Market Segmentation and Scope
1.2. Research Methodology
1.2.1. Information Procurement
1.3. Information or Data Analysis
1.4. Methodology
1.5. Research Scope and Assumptions
1.6. Market Formulation & Validation
1.7. List of Data Sources
Chapter 2. Executive Summary
2.1. Market Outlook
2.2. Segment Outlook
2.3. Competitive Insights
Chapter 3. Bicycle Market Variables, Trends, & Scope
3.1. Market Lineage Outlook
3.2. Market Dynamics
3.2.1. Market Driver Analysis
3.2.2. Market Restraint Analysis
3.2.3. Industry Challenge
3.3. Bicycle Market Analysis Tools
3.3.1. Industry Analysis – Porter’s
3.3.1.1. Bargaining power of the suppliers
3.3.1.2. Bargaining power of the buyers
3.3.1.3. Threats of substitution
3.3.1.4. Threats from new entrants
3.3.1.5. Competitive rivalry
3.3.2. PESTEL Analysis
3.3.2.1. Political landscape
3.3.2.2. Economic landscape
3.3.2.3. Social Landscape
3.3.2.4. Technological landscape
3.3.2.5. Environmental Landscape
3.3.2.6. Legal landscape
Chapter 4. Bicycle Market: Product Estimates & Trend Analysis
4.1. Segment Dashboard
4.1.1. Bicycle Market: Product Movement Analysis, 2025 & 2033 USD Million
4.2. Mountain Bikes
4.2.1. Mountain Bikes Market Revenue Estimates and Forecasts, 2021 – 2033 (USD Million)
4.3. Hybrid Bikes
4.3.1. Hybrid Bikes Market Revenue Estimates and Forecasts, 2021 – 2033 (USD Million)
4.4. Road Bikes
4.4.1. Road Bikes Market Revenue Estimates and Forecasts, 2021 – 2033 (USD Million)
4.5. Cargo Bikes
4.5.1. Cargo Bikes Market Revenue Estimates and Forecasts, 2021 – 2033 (USD Million)
4.6. Others
4.6.1. Ohers Market Revenue Estimates and Forecasts, 2021 – 2033 (USD Million)
Chapter 5. Bicycle Market: Technology Estimates & Trend Analysis
5.1. Segment Dashboard
5.2. Bicycle Market: Technology Movement Analysis, 2025 & 2033 USD Million
5.3. Electric
5.3.1. Electric Market Revenue Estimates and Forecasts, 2021 – 2033 (USD Million)
5.4. Insourcing
5.4.1. Insourcing Market Revenue Estimates and Forecasts, 2021 – 2033 (USD Million)
Chapter 6. Bicycle Market: By Distribution Channel Estimates & Trend Analysis
6.1. Segment Dashboard
6.2. Bicycle Market: By Distribution Channel Movement Analysis, 2025 & 2033 USD Million
6.3. Online
6.3.1. Online Market Revenue Estimates and Forecasts, 2021 – 2033 (USD Million)
6.4. Offline
6.4.1. Offline Market Revenue Estimates and Forecasts, 2021 – 2033 (USD Million)
Chapter 7. Bicycle Market: By End Use Estimates & Trend Analysis
7.1. Segment Dashboard
7.2. Bicycle Market: By End Use Movement Analysis, 2025 & 2033 USD Million
7.3. Men
7.3.1. Men Market Revenue Estimates and Forecasts, 2021 – 2033 (USD Million)
7.4. Women
7.4.1. Women Market Revenue Estimates and Forecasts, 2021 – 2033 (USD Million)
7.5. Kids
7.5.1. Kids Market Revenue Estimates and Forecasts, 2021 – 2033 (USD Million)
Chapter 8. Bicycle Market: Regional Estimates & Trend Analysis
8.1. Bicycle Market Share, By Region, 2025 & 2033, USD Million
8.2. North America
8.2.1. North America Bicycle Market Estimates and Forecasts, 2021 – 2033 (USD Million)
8.2.2. U.S.
8.2.2.1. U.S. Bicycle Market Estimates and Forecasts, 2021 – 2033 (USD Million)
8.2.3. Canada
8.2.3.1. Canada Bicycle Market Estimates and Forecasts, 2021 – 2033 (USD Million)
8.2.4. Mexico
8.2.4.1. Mexico Bicycle Market Estimates and Forecasts, 2021 – 2033 (USD Million)
8.3. Europe
8.3.1. Europe Bicycle Market Estimates and Forecasts, 2021 – 2033 (USD Million)
8.3.2. UK
8.3.2.1. UK Bicycle Market Estimates and Forecasts, 2021 – 2033 (USD Million)
8.3.3. Germany
8.3.3.1. Germany Bicycle Market Estimates and Forecasts, 2021 – 2033 (USD Million)
8.3.4. France
8.3.4.1. Italy Bicycle Market Estimates and Forecasts, 2021 – 2033 (USD Million)
8.4. Asia Pacific
8.4.1. Asia Pacific Bicycle Market Estimates and Forecasts, 2021 – 2033 (USD Million)
8.4.2. China
8.4.2.1. China Bicycle Market Estimates and Forecasts, 2021 – 2033 (USD Million)
8.4.3. Japan
8.4.3.1. Japan Bicycle Market Estimates and Forecasts, 2021 – 2033 (USD Million)
8.4.4. India
8.4.4.1. India Bicycle Market Estimates and Forecasts, 2021 – 2033 (USD Million)
8.4.5. South Korea
8.4.5.1. South Korea Bicycle Market Estimates and Forecasts, 2021 – 2033 (USD Million)
8.4.6. Australia
8.4.6.1. Australia Bicycle Market Estimates and Forecasts, 2021 – 2033 (USD Million)
8.5. Latin America
8.5.1. Latin America Bicycle Market Estimates and Forecasts, 2021 – 2033 (USD Million)
8.5.2. Brazil
8.5.2.1. Brazil Bicycle Market Estimates and Forecasts, 2021 – 2033 (USD Million)
8.6. Middle East and Africa
8.6.1. Middle East and Africa Bicycle Market Estimates and Forecasts, 2021 – 2033 (USD Million)
8.6.2. UAE
8.6.2.1. UAE Bicycle Market Estimates and Forecasts, 2021 – 2033 (USD Million)
8.6.3. KSA
8.6.3.1. KSA Bicycle Market Estimates and Forecasts, 2021 – 2033 (USD Million)
8.6.4. South Africa
8.6.4.1. South Africa Bicycle Market Estimates and Forecasts, 2021 – 2033 (USD Million)
Chapter 9. Competitive Landscape
9.1. Company Categorization
9.2. Company Market Positioning
9.3. Company Heat Map Analysis
9.4. Company Profiles/Listing
9.4.1. Accell Group
9.4.1.1. Participant’s Overview
9.4.1.2. Financial Performance
9.4.1.3. Product Benchmarking
9.4.1.4. Strategic Initiatives
9.4.2. Atlas Cycles (Haryana) Ltd.
9.4.2.1. Participant’s Overview
9.4.2.2. Financial Performance
9.4.2.3. Product Benchmarking
9.4.2.4. Strategic Initiatives
9.4.3. Avon Cycles Ltd.
9.4.3.1. Participant’s Overview
9.4.3.2. Financial Performance
9.4.3.3. Product Benchmarking
9.4.3.4. Strategic Initiatives
9.4.4. Cervelo
9.4.4.1. Participant’s Overview
9.4.4.2. Financial Performance
9.4.4.3. Product Benchmarking
9.4.4.4. Strategic Initiatives
9.4.5. Dorel Industries Inc.
9.4.5.1. Participant’s Overview
9.4.5.2. Financial Performance
9.4.5.3. Product Benchmarking
9.4.5.4. Strategic Initiatives
9.4.6. Giant Bicycles
9.4.6.1. Participant’s Overview
9.4.6.2. Financial Performance
9.4.6.3. Product Benchmarking
9.4.6.4. Strategic Initiatives
9.4.7. Merida Industry Co., Ltd
9.4.7.1. Participant’s Overview
9.4.7.2. Financial Performance
9.4.7.3. Product Benchmarking
9.4.7.4. Strategic Initiatives
9.4.8. Specialized Bicycle Components, Inc.
9.4.8.1. Participant’s Overview
9.4.8.2. Financial Performance
9.4.8.3. Product Benchmarking
9.4.8.4. Strategic Initiatives
9.4.9. SCOTT Sports SA
9.4.9.1. Participant’s Overview
9.4.9.2. Financial Performance
9.4.9.3. Product Benchmarking
9.4.9.4. Strategic Initiatives
9.4.10. Trek Bicycle Corporation
9.4.10.1. Participant’s Overview
9.4.10.2. Financial Performance
9.4.10.3. Product Benchmarking
9.4.10.4. Strategic Initiatives
9.4.11. Orbea
9.4.11.1. Participant’s Overview
9.4.11.2. Financial Performance
9.4.11.3. Product Benchmarking
9.4.11.4. Strategic Initiatives
9.4.12. BH Bikes
9.4.12.1. Participant’s Overview
9.4.12.2. Financial Performance
9.4.12.3. Product Benchmarking
9.4.12.4. Strategic Initiatives
9.4.13. Axalko Bikes
9.4.13.1. Participant’s Overview
9.4.13.2. Financial Performance
9.4.13.3. Product Benchmarking
9.4.13.4. Strategic Initiatives
9.4.14. Hagen Bikes
9.4.14.1. Participant’s Overview
9.4.14.2. Financial Performance
9.4.14.3. Product Benchmarking
9.4.14.4. Strategic Initiatives
9.4.15. Mammoth bikes
9.4.15.1. Participant’s Overview
9.4.15.2. Financial Performance
9.4.15.3. Product Benchmarking
9.4.15.4. Strategic Initiatives
9.4.16. Egurra Bikes
9.4.16.1. Participant’s Overview
9.4.16.2. Financial Performance
9.4.16.3. Product Benchmarking
9.4.16.4. Strategic Initiatives
9.4.17. Garri Bike
9.4.17.1. Participant’s Overview
9.4.17.2. Financial Performance
9.4.17.3. Product Benchmarking
9.4.17.4. Strategic Initiatives
List of Tables
Table 1 Global Bicycle Market size estimates & forecasts 2021 – 2033 (USD Million)
Table 2 Global Bicycle Market, by Region 2021 – 2033 (USD Million)
Table 3 Global Bicycle Market, by Product 2021 – 2033 (USD Million)
Table 4 Global Bicycle Market, by Technology 2021 – 2033 (USD Million)
Table 5 Global Bicycle Market, by Distribution Channel 2021 – 2033 (USD Million)
Table 6 Global Bicycle Market, by End Use 2021 – 2033 (USD Million)
Table 7 Mountain Bikes market, by region 2021 – 2033 (USD Million)
Table 8 Hybrid Bikes market, by region 2021 – 2033 (USD Million)
Table 9 Road Bikes market, by region 2021 – 2033 (USD Million)
Table 10 Cargo Bikes market, by region 2021 – 2033 (USD Million)
Table 11 Others market by region 2021 – 2033 (USD Million)
Table 12 Electric market, by region 2021 – 2033 (USD Million)
Table 13 Insourcing market, by region 2021 – 2033 (USD Million)
Table 14 Online market, by region 2021 – 2033 (USD Million)
Table 15 Offline market, by region 2021 – 2033 (USD Million)
Table 16 Men market, by region 2021 – 2033 (USD Million)
Table 17 Women market, by region 2021 – 2033 (USD Million)
Table 18 Kids market, by region 2021 – 2033 (USD Million)
Table 19 North America Bicycle Market, by Product 2021 – 2033 (USD Million)
Table 20 North America Bicycle Market, by Technology 2021 – 2033 (USD Million)
Table 21 North America Bicycle Market, by Distribution Channel 2021 – 2033 (USD Million)
Table 22 North America Bicycle Market, by End Use 2021 – 2033 (USD Million)
Table 23 U.S. Bicycle Market, by Product 2021 – 2033 (USD Million)
Table 24 U.S. Bicycle Market, by Technology 2021 – 2033 (USD Million)
Table 25 U.S. Bicycle Market, by Distribution Channel 2021 – 2033 (USD Million)
Table 26 U.S. Bicycle Market, by End Use 2021 – 2033 (USD Million)
Table 27 Canada Bicycle Market, by Product 2021 – 2033 (USD Million)
Table 28 Canada Bicycle Market, by Technology 2021 – 2033 (USD Million)
Table 29 Canada Bicycle Market, by Distribution Channel 2021 – 2033 (USD Million)
Table 30 Canada Bicycle Market, by End Use 2021 – 2033 (USD Million)
Table 31 Mexico Bicycle Market, by Product 2021 – 2033 (USD Million)
Table 32 Mexico Bicycle Market, by Technology 2021 – 2033 (USD Million)
Table 33 Mexico Bicycle Market, by Distribution Channel 2021 – 2033 (USD Million)
Table 34 Mexico Bicycle Market, by End Use 2021 – 2033 (USD Million)
Table 35 Europe Bicycle Market, by Product 2021 – 2033 (USD Million)
Table 36 Europe Bicycle Market, by Technology 2021 – 2033 (USD Million)
Table 37 Europe Bicycle Market, by Distribution Channel 2021 – 2033 (USD Million)
Table 38 Europe Bicycle Market, by End Use 2021 – 2033 (USD Million)
Table 39 UK Bicycle Market, by Product 2021 – 2033 (USD Million)
Table 40 UK Bicycle Market, by Technology 2021 – 2033 (USD Million)
Table 41 UK Bicycle Market, by Distribution Channel 2021 – 2033 (USD Million)
Table 42 UK Bicycle Market, by End Use 2021 – 2033 (USD Million)
Table 43 Germany Bicycle Market, by Product 2021 – 2033 (USD Million)
Table 44 Germany Bicycle Market, by Technology 2021 – 2033 (USD Million)
Table 45 Germany Bicycle Market, by Distribution Channel 2021 – 2033 (USD Million)
Table 46 Germany Bicycle Market, by End Use 2021 – 2033 (USD Million)
Table 47 France Bicycle Market, by Product 2021 – 2033 (USD Million)
Table 48 France Bicycle Market, by Technology 2021 – 2033 (USD Million)
Table 49 France Bicycle Market, by Distribution Channel 2021 – 2033 (USD Million)
Table 50 France Bicycle Market, by End Use 2021 – 2033 (USD Million)
Table 51 Asia Pacific Bicycle Market, by Product 2021 – 2033 (USD Million)
Table 52 Asia Pacific Bicycle Market, by Technology 2021 – 2033 (USD Million)
Table 53 Asia Pacific Bicycle Market, by Distribution Channel 2021 – 2033 (USD Million)
Table 54 Asia Pacific Bicycle Market, by End Use 2021 – 2033 (USD Million)
Table 55 China Bicycle Market, by Product 2021 – 2033 (USD Million)
Table 56 China Bicycle Market, by Technology 2021 – 2033 (USD Million)
Table 57 China Bicycle Market, by End Use 2021 – 2033 (USD Million)
Table 58 China Bicycle Market, by Distribution Channel 2021 – 2033 (USD Million)
Table 59 India Bicycle Market, by Product 2021 – 2033 (USD Million)
Table 60 India Bicycle Market, by Technology 2021 – 2033 (USD Million)
Table 61 India Bicycle Market, by Distribution Channel 2021 – 2033 (USD Million)
Table 62 India Bicycle Market, by End Use 2021 – 2033 (USD Million)
Table 63 Japan Bicycle Market, by Product 2021 – 2033 (USD Million)
Table 64 Japan Bicycle Market, by Technology 2021 – 2033 (USD Million)
Table 65 Japan Bicycle Market, by Distribution Channel 2021 – 2033 (USD Million)
Table 66 Japan Bicycle Market, by End Use 2021 – 2033 (USD Million)
Table 67 Australia Bicycle Market, by Product 2021 – 2033 (USD Million)
Table 68 Australia Bicycle Market, by Technology 2021 – 2033 (USD Million)
Table 69 Australia Bicycle Market, by Distribution Channel 2021 – 2033 (USD Million)
Table 70 Australia Bicycle Market, by End Use 2021 – 2033 (USD Million)
Table 71 South Korea Bicycle Market, by Product 2021 – 2033 (USD Million)
Table 72 South Korea Bicycle Market, by Technology 2021 – 2033 (USD Million)
Table 73 South Korea Bicycle Market, by Distribution Channel 2021 – 2033 (USD Million)
Table 74 South Korea Bicycle Market, by End Use 2021 – 2033 (USD Million)
Table 75 Latin America Bicycle Market, by Product 2021 – 2033 (USD Million)
Table 76 Latin America Bicycle Market, by Technology 2021 – 2033 (USD Million)
Table 77 Latin America Bicycle Market, by Distribution Channel 2021 – 2033 (USD Million)
Table 78 Latin America Bicycle Market, by End Use 2021 – 2033 (USD Million)
Table 79 Brazil Bicycle Market, by Product 2021 – 2033 (USD Million)
Table 80 Brazil Bicycle Market, by Technology 2021 – 2033 (USD Million)
Table 81 Brazil Bicycle Market, by Distribution Channel 2021 – 2033 (USD Million)
Table 82 Brazil Bicycle Market, by End Use 2021 – 2033 (USD Million)
Table 83 Middle East & Africa Bicycle Market, by Product 2021 – 2033 (USD Million)
Table 84 Middle East & Africa Bicycle Market, by Technology 2021 – 2033 (USD Million)
Table 85 Middle East & Africa Bicycle Market, by Distribution Channel 2021 – 2033 (USD Million)
Table 86 Middle East & Africa Bicycle Market, by End Use 2021 – 2033 (USD Million)
Table 87 Kingdom of Saudi Arabia (KSA) Bicycle Market, by Product 2021 – 2033 (USD Million)
Table 88 Kingdom of Saudi Arabia (KSA) Bicycle Market, by Technology 2021 – 2033 (USD Million)
Table 89 Kingdom of Saudi Arabia (KSA) Bicycle Market, by Distribution Channel 2021 – 2033 (USD Million)
Table 90 Kingdom of Saudi Arabia (KSA) Bicycle Market, by End Use 2021 – 2033 (USD Million)
Table 91 UAE Bicycle Market, by Product 2021 – 2033 (USD Million)
Table 92 UAE Bicycle Market, by Technology 2021 – 2033 (USD Million)
Table 93 UAE Bicycle Market, by Distribution Channel 2021 – 2033 (USD Million)
Table 94 UAE Bicycle Market, by End Use 2021 – 2033 (USD Million)
Table 95 South Africa Bicycle Market, by Product 2021 – 2033 (USD Million)
Table 96 South Africa Bicycle Market, by Technology 2021 – 2033 (USD Million)
Table 97 South Africa Bicycle Market, by Distribution Channel 2021 – 2033 (USD Million)
Table 98 South Africa Bicycle Market, by End Use 2021 – 2033 (USD Million)
List of Figures
Fig. 1 Bicycle Market Segmentation
Fig. 2 Market research deployment mode
Fig. 3 Information procurement
Fig. 4 Primary research pattern
Fig. 5 Market research approaches
Fig. 6 Value chain-based sizing & forecasting
Fig. 7 Parent market analysis
Fig. 8 Market formulation & validation
Fig. 9 Bicycle Market snapshot
Fig. 10 Bicycle Market Segment Snapshot
Fig. 11 Bicycle Market Competitive Landscape Snapshot
Fig. 12 Market research deployment mode
Fig. 13 Market driver relevance analysis (Current & future impact)
Fig. 14 Market restraint relevance analysis (Current & future impact)
Fig. 15 Bicycle Market: Product outlook key takeaways (USD Million)
Fig. 16 Bicycle Market: Product Movement Analysis (USD Million), 2025 & 2033
Fig. 17 Mountain Bikes market revenue estimates and forecasts, 2021 – 2033 (USD Million)
Fig. 18 Hybrid Bikes market revenue estimates and forecasts, 2021 – 2033 (USD Million)
Fig. 19 Road Bikes market revenue estimates and forecasts, 2021 – 2033 (USD Million)
Fig. 20 Cargo Bikes market revenue estimates and forecasts, 2021 – 2033 (USD Million)
Fig. 21 Others market revenue estimates and forecasts, 2021 – 2033 (USD Million)
Fig. 22 Bicycle Market: Technology outlook key takeaways (USD Million)
Fig. 23 Bicycle Market: Technology movement analysis (USD Million), 2025 & 2033
Fig. 24 Electric market revenue estimates and forecasts, 2021 – 2033 (USD Million)
Fig. 25 Insourcing market revenue estimates and forecasts, 2021 – 2033 (USD Million)
Fig. 26 Bicycle Market: Distribution Channel Outlook Key Takeaways (USD Million)
Fig. 27 Bicycle Market: Distribution Channel Movement Analysis (USD Million), 2025 & 2033
Fig. 28 Online market revenue estimates and forecasts, 2021 – 2033 (USD Million)
Fig. 29 Offline market revenue estimates and forecasts, 2021 – 2033 (USD Million)
Fig. 30 Bicycle Market: End Use Outlook Key Takeaways (USD Million)
Fig. 31 Bicycle Market: End Use Movement Analysis (USD Million), 2025 & 2033
Fig. 32 Men market revenue estimates and forecasts, 2021 – 2033 (USD Million)
Fig. 33 Women market revenue estimates and forecasts, 2021 – 2033 (USD Million)
Fig. 34 Kids market revenue estimates and forecasts, 2021 – 2033 (USD Million)
Fig. 35 Regional marketplace: Key takeaways
Fig. 36 Bicycle Market: Regional Outlook, 2025 & 2033, USD Million
Fig. 37 North America Bicycle Market estimates and forecasts, 2021 – 2033 (USD Million)
Fig. 38 U.S. Bicycle Market estimates and forecasts, 2021 – 2033 (USD Million)
Fig. 39 Canada Bicycle Market estimates and forecasts, 2021 – 2033 (USD Million)
Fig. 40 Mexico Bicycle Market estimates and forecasts, 2021 – 2033 (USD Million)
Fig. 41 Europe Bicycle Market estimates and forecasts, 2021 – 2033 (USD Million)
Fig. 42 UK Bicycle Market estimates and forecasts, 2021 – 2033 (USD Million)
Fig. 43 Germany Bicycle Market estimates and forecasts, 2021 – 2033 (USD Million)
Fig. 44 France Bicycle Market estimates and forecasts, 2021 – 2033 (USD Million)
Fig. 45 Asia Pacific Bicycle Market estimates and forecasts, 2021 – 2033 (USD Million)
Fig. 46 Japan Bicycle Market estimates and forecasts, 2021 – 2033 (USD Million)
Fig. 47 China Bicycle Market estimates and forecasts, 2021 – 2033 (USD Million)
Fig. 48 India Bicycle Market estimates and forecasts, 2021 – 2033 (USD Million)
Fig. 49 Australia Bicycle Market estimates and forecasts, 2021 – 2033 (USD Million)
Fig. 50 South Korea Bicycle Market estimates and forecasts, 2021 – 2033 (USD Million)
Fig. 51 Latin America Bicycle Market estimates and forecasts, 2021 – 2033 (USD Million)
Fig. 52 Brazil Bicycle Market estimates and forecasts, 2021 – 2033 (USD Million)
Fig. 53 MEA Bicycle Market estimates and forecasts, 2021 – 2033 (USD Million)
Fig. 54 KSA Bicycle Market estimates and forecasts, 2021 – 2033 (USD Million)
Fig. 55 UAE Bicycle Market estimates and forecasts, 2021 – 2033 (USD Million)
Fig. 56 South Africa Bicycle Market estimates and forecasts, 2021 – 2033 (USD Million)
Fig. 57 Strategy framework
Fig. 58 Company Categorization