Buses Market Size, Share & Trends Analysis Report
Buses Market Size, Share & Trends Analysis Report By Propulsion (ICE, Electric), By Seating Capacity (Up To 30 Seats, 31-50 Seats, Above 50 Seats), By End Use (Public Transportation, Private Transportation, Institutional Use), By Region, And Segment Forecasts, 2026 - 2033
バス市場 - 推進力(ICE、電気)、座席数別(30席まで、31~50席、50席以上)、用途別(公共交通機関、個人輸送機関、公共機関利用)、地域、セグメント別予測による市場規模、成長と動向分析レポート 2026-2033年
| 出版 | Grand View Research |
| 出版年月 | 2025年12月 |
| ページ数 | 100 |
| 価格 | 記載以外のライセンスについてはお問合せください |
| シングルユーザ | USD 4,950 |
| 種別 | 英文調査報告書 |
| 商品番号 | SMR-1186411864 |

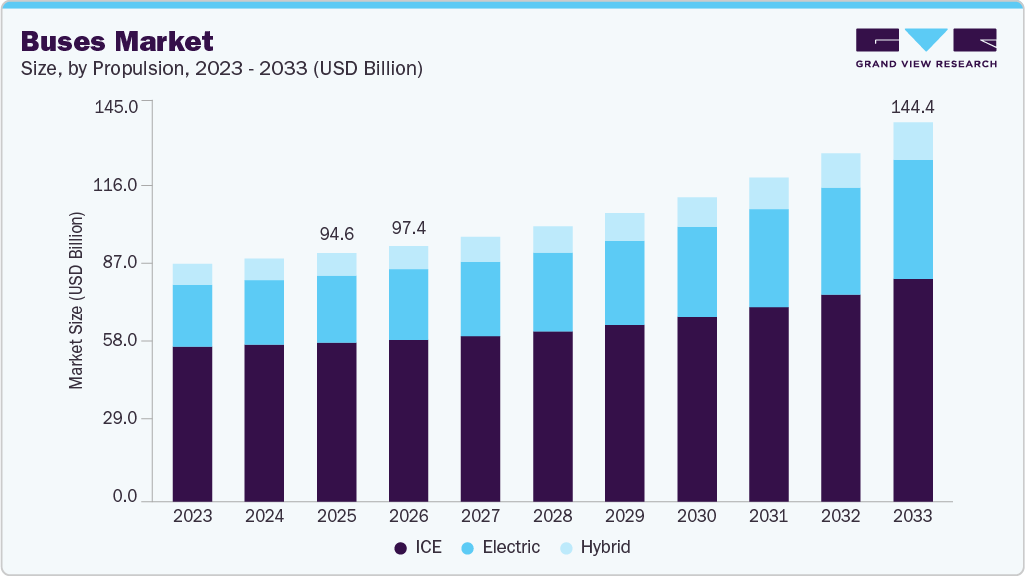
世界のバス市場規模は2025年に946.2億米ドルと推定され、2026年から2033年にかけて5.8%のCAGRで成長し、2033年には1,444.2億米ドルに達すると予測されています。バス業界は、急速な都市化、都市の人口密度の上昇、効率的な大量輸送システムに対する需要の増加に牽引され、着実な成長を遂げています。
先進国および新興国の政府は、交通渋滞の緩和、二酸化炭素排出量の削減、そして移動手段へのアクセス向上のため、公共交通機関の拡充を優先しています。観光や地域連携の取り組みに支えられた都市間および長距離移動の増加も、長距離バスや高級バスの需要増加に貢献しています。さらに、特に欧州と北米では、老朽化したバス車両の更新需要が引き続き市場拡大を支えています。
技術の進歩はバス業界を大きく変革し、電動化、自動化、デジタル統合へと大きくシフトしています。バッテリーのエネルギー密度、充電インフラ、そして総所有コスト(TCO)の向上により、電気バスやハイブリッドバスの普及が進んでいます。BYD Autoや宇通バスといったメーカーはゼロエミッションバスの革新をリードしており、欧州の企業は水素燃料電池やコネクテッドバス技術に注力しています。先進運転支援システム(ADAS)、テレマティクス、フリート管理ソフトウェア、そして予知保全ソリューションは、安全性、運用効率、そして稼働率の向上を目的として、ますます統合されつつあります。
Buses Market Summary
The global buses market size was estimated at USD 94.62 billion in 2025, and is projected to reach USD 144.42 billion by 2033, growing at a CAGR of 5.8% from 2026 to 2033. The buses industry is experiencing steady growth driven by rapid urbanization, rising population density in cities, and increasing demand for efficient mass transportation systems.
Governments across developed and emerging economies are prioritizing the expansion of public transport to reduce traffic congestion, lower carbon emissions, and improve access to mobility. Growth in intercity and long-distance travel, supported by tourism and regional connectivity initiatives, is also contributing to higher demand for coaches and luxury buses. In addition, replacement demand for aging bus fleets, particularly in Europe and North America, continues to support market expansion.
Technological advancements are reshaping the buses industry, with a strong shift toward electrification, automation, and digital integration. Electric and hybrid buses are gaining traction due to improvements in battery energy density, charging infrastructure, and total cost of ownership. Manufacturers such as BYD Auto and Yutong Bus are leading innovation in zero-emission buses, while European players are focusing on hydrogen fuel-cell and connected bus technologies. Advanced driver-assistance systems (ADAS), telematics, fleet management software, and predictive maintenance solutions are increasingly being integrated to enhance safety, operational efficiency, and uptime.
Investments in the bus market are being driven by large-scale public procurement programs, private operator fleet expansion, and strategic partnerships between OEMs and technology providers. Governments and municipal transportation authorities are allocating substantial budgets toward the adoption of electric buses and the development of charging infrastructure. Private investments and funding are also increasing in areas such as battery manufacturing, hydrogen ecosystems, and digital mobility platforms. In emerging markets, investments are focused on expanding production capacity and localization, with companies such as Tata Motors and Ashok Leyland strengthening their domestic and export-oriented bus portfolios.
buses-market-share
Despite positive growth prospects, the bus market faces several restraints. High upfront costs associated with electric and hydrogen buses, along with the need for charging or refueling infrastructure, can limit adoption, especially in cost-sensitive markets. Budget constraints faced by public transport authorities often delay procurement cycles. Supply chain disruptions, volatility in raw material prices, and dependence on battery supply further impact manufacturing costs and margins.
Buses Market Report Scope
| Report Attribute | Details |
| Market size value in 2026 | USD 97.41 billion |
| Revenue forecast in 2033 | USD 144.42 billion |
| Growth Rate | CAGR of 5.8% from 2026 to 2033 |
| Base year for estimation | 2025 |
| Historical data | 2021 – 2024 |
| Forecast period | 2026 – 2033 |
| Quantitative units | Revenue in USD million/billion and CAGR from 2026 to 2033 |
| Report seating capacity | Revenue forecast, company ranking, competitive landscape, growth factors, and trends |
| Segments covered | Propulsion, seating capacity, end use, region |
| Regional scope | North America; Europe; Asia Pacific; Latin America; MEA |
| Country scope | U.S.; Canada; Mexico; Germany; UK; France; China; Japan; India; South Korea; Australia; Brazil; KSA; UAE; South Africa |
| Key companies profiled | Yutong Bus Co., Ltd.; Tata Motors Limited; ASHOK LEYLAND; AB Volvo; BYD Company Limited; Scania; MAN; Xiamen King Long International Trading Co.,Ltd.; New Flyer; Daimler Truck AG |
| Customization scope | Free report customization (equivalent up to 8 analysts working days) with purchase. Addition or alteration to country, regional & segment scope. |
Global Buses Market Report Segmentation
This report forecasts revenue growth at global, regional, and country levels and provides an analysis of the latest industry trends in each of the sub-segments from 2021 to 2033. For this study, Grand View Research has segmented the global buses market report based on propulsion, seating capacity, end use, and region:
• Propulsion Outlook (Revenue, USD Million, 2021 – 2033)
• ICE
• Electric
• Hybrid
• Seating Capacity Outlook (Revenue, USD Million, 2021 – 2033)
• Up to 30 Seats
• 31-50 Seats
• Above 50 Seats
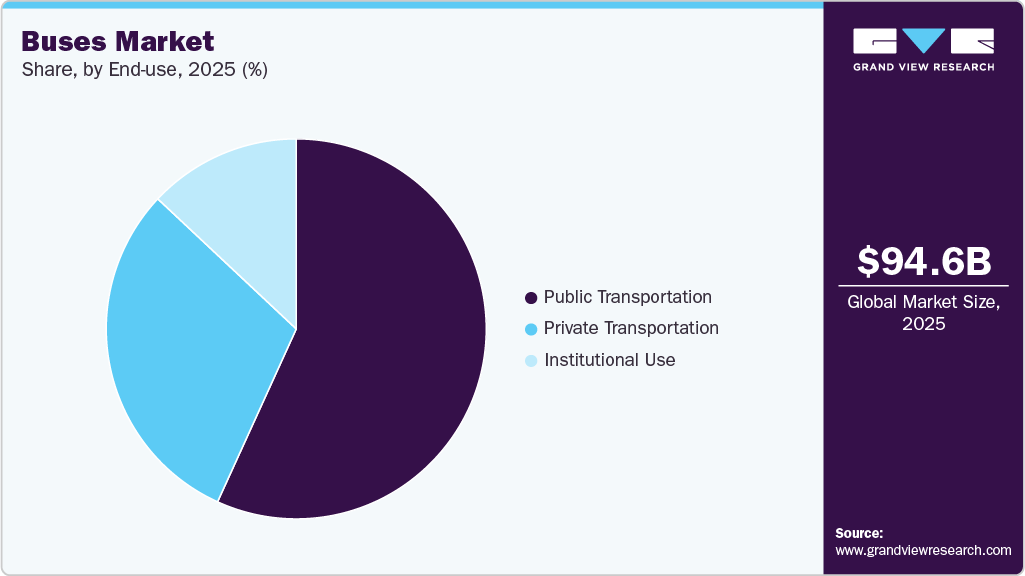
• End Use Outlook (Revenue, USD Million, 2021 – 2033)
• Public Transportation
• Private Transportation
• Institutional Use
• Regional Outlook (Revenue, USD Million, 2021 – 2033)
• North America
o U.S.
o Canada
o Mexico
• Europe
o Germany
o UK
o France
• Asia Pacific
o China
o Japan
o India
o South Korea
o Australia
• Latin America
o Brazil
• Middle East and Africa (MEA)
o KSA
o UAE
o South Africa
Table of Contents
Chapter 1. Methodology and Scope
1.1. Market Segmentation and Scope
1.2. Research Methodology
1.2.1. Information Procurement
1.3. Information or Data Analysis
1.4. Methodology
1.5. Research Scope and Assumptions
1.6. Market Formulation & Validation
1.7. Country Based Segment Share Calculation
1.8. List of Data Sources
Chapter 2. Executive Summary
2.1. Market Outlook
2.2. Segment Outlook
2.3. Competitive Insights
Chapter 3. Buses Market Variables, Trends, & Scope
3.1. Market Lineage Outlook
3.2. Market Dynamics
3.2.1. Market Driver Analysis
3.2.2. Market Restraint Analysis
3.2.3. Industry Challenge
3.3. Buses Market Analysis Tools
3.3.1. Industry Analysis – Porter’s
3.3.1.1. Bargaining power of the suppliers
3.3.1.2. Bargaining power of the buyers
3.3.1.3. Threats of substitution
3.3.1.4. Threats from new entrants
3.3.1.5. Competitive rivalry
3.3.2. PESTEL Analysis
3.3.2.1. Political landscape
3.3.2.2. Economic landscape
3.3.2.3. Social landscape
3.3.2.4. Technological landscape
3.3.2.5. Environmental landscape
3.3.2.6. Legal landscape
Chapter 4. Buses Market: Propulsion Estimates & Trend Analysis
4.1. Segment Dashboard
4.2. Buses Market: Propulsion Movement Analysis, 2025 & 2033 (USD Million)
4.3. ICE
4.3.1. ICE Market Revenue Estimates and Forecasts, 2021 – 2033 (USD Million)
4.4. Electric
4.4.1. Electric Market Revenue Estimates and Forecasts, 2021 – 2033 (USD Million)
4.5. Hybrid
4.5.1. Hybrid Market Revenue Estimates and Forecasts, 2021 – 2033 (USD Million)
Chapter 5. Buses Market: Seating Capacity Estimates & Trend Analysis
5.1. Segment Dashboard
5.2. Buses Market: Seating Capacity Movement Analysis, 2025 & 2033 (USD Million)
5.3. Up to 30 Seats
5.3.1. Up to 30 Seats Market Revenue Estimates and Forecasts, 2021 – 2033 (USD Million)
5.4. 31-50 Seats
5.4.1. 31-50 Seats Market Revenue Estimates and Forecasts, 2021 – 2033 (USD Million)
5.5. Above 50 Seats
5.5.1. Above 50 Seats Market Revenue Estimates and Forecasts, 2021 – 2033 (USD Million)
Chapter 6. Buses Market: End Use Estimates & Trend Analysis
6.1. Segment Dashboard
6.2. Buses Market: End Use Movement Analysis, 2025 & 2033 (USD Million)
6.3. Public Transportation
6.3.1. Public Transportation Market Revenue Estimates and Forecasts, 2021 – 2033 (USD Million)
6.4. Private Transportation
6.4.1. Private Transportation Market Revenue Estimates and Forecasts, 2021 – 2033 (USD Million)
6.5. Institutional Use
6.5.1. Institutional Use Market Revenue Estimates and Forecasts, 2021 – 2033 (USD Million)
Chapter 7. Buses Market: Regional Estimates & Trend Analysis
7.1. Buses Market Share, By Region, 2025 & 2033 (USD Million)
7.2. North America
7.2.1. North America Buses Market Estimates and Forecasts, 2021 – 2033 (USD Million)
7.2.2. U.S.
7.2.2.1. U.S. Buses Market Estimates and Forecasts, 2021 – 2033 (USD Million)
7.2.3. Canada
7.2.3.1. Canada Buses Market Estimates and Forecasts, 2021 – 2033 (USD Million)
7.2.4. Mexico
7.2.4.1. Mexico Buses Market Estimates and Forecasts, 2021 – 2033 (USD Million)
7.3. Europe
7.3.1. Europe Buses Market Estimates and Forecasts, 2021 – 2033 (USD Million)
7.3.2. UK
7.3.2.1. UK Buses Market Estimates and Forecasts, 2021 – 2033 (USD Million)
7.3.3. Germany
7.3.3.1. Germany Buses Market Estimates and Forecasts, 2021 – 2033 (USD Million)
7.3.4. France
7.3.4.1. France Buses Market Estimates and Forecasts, 2021 – 2033 (USD Million)
7.4. Asia Pacific
7.4.1. Asia Pacific Buses Market Estimates and Forecasts, 2021 – 2033 (USD Million)
7.4.2. China
7.4.2.1. China Buses Market Estimates and Forecasts, 2021 – 2033 (USD Million)
7.4.3. Japan
7.4.3.1. Japan Buses Market Estimates and Forecasts, 2021 – 2033 (USD Million)
7.4.4. India
7.4.4.1. India Buses Market Estimates and Forecasts, 2021 – 2033 (USD Million)
7.4.5. South Korea
7.4.5.1. South Korea Buses Market Estimates and Forecasts, 2021 – 2033 (USD Million)
7.4.6. Australia
7.4.6.1. Australia Buses Market Estimates and Forecasts, 2021 – 2033 (USD Million)
7.5. Latin America
7.5.1. Latin America Buses Market Estimates and Forecasts, 2021 – 2033 (USD Million)
7.5.2. Brazil
7.5.2.1. Brazil Buses Market Estimates and Forecasts, 2021 – 2033 (USD Million)
7.6. Middle East and Africa
7.6.1. Middle East and Africa Buses Market Estimates and Forecasts, 2021 – 2033 (USD Million)
7.6.2. KSA
7.6.2.1. KSA Buses Market Estimates and Forecasts, 2021 – 2033 (USD Million)
7.6.3. UAE
7.6.3.1. UAE Buses Market Estimates and Forecasts, 2021 – 2033 (USD Million)
7.6.4. South Africa
7.6.4.1. South Africa Buses Market Estimates and Forecasts, 2021 – 2033 (USD Million)
Chapter 8. Competitive Landscape
8.1. Company Categorization
8.2. Company Market Positioning
8.3. Company Heat Map Analysis
8.4. Company Profiles/Listing
8.4.1. Yutong Bus Co., Ltd.
8.4.1.1. Participant’s Overview
8.4.1.2. Financial Performance
8.4.1.3. Product Benchmarking
8.4.1.4. Strategic Initiatives
8.4.2. Tata Motors Limited
8.4.2.1. Participant’s Overview
8.4.2.2. Financial Performance
8.4.2.3. Product Benchmarking
8.4.2.4. Strategic Initiatives
8.4.3. ASHOK LEYLAND
8.4.3.1. Participant’s Overview
8.4.3.2. Financial Performance
8.4.3.3. Product Benchmarking
8.4.3.4. Strategic Initiatives
8.4.4. AB Volvo
8.4.4.1. Participant’s Overview
8.4.4.2. Financial Performance
8.4.4.3. Product Benchmarking
8.4.4.4. Strategic Initiatives
8.4.5. BYD Company Limited
8.4.5.1. Participant’s Overview
8.4.5.2. Financial Performance
8.4.5.3. Product Benchmarking
8.4.5.4. Strategic Initiatives
8.4.6. Scania
8.4.6.1. Participant’s Overview
8.4.6.2. Financial Performance
8.4.6.3. Product Benchmarking
8.4.6.4. Strategic Initiatives
8.4.7. MAN
8.4.7.1. Participant’s Overview
8.4.7.2. Financial Performance
8.4.7.3. Product Benchmarking
8.4.7.4. Strategic Initiatives
8.4.8. Xiamen King Long International Trading Co., Ltd.
8.4.8.1. Participant’s Overview
8.4.8.2. Financial Performance
8.4.8.3. Product Benchmarking
8.4.8.4. Strategic Initiatives
8.4.9. New Flyer
8.4.9.1. Participant’s Overview
8.4.9.2. Financial Performance
8.4.9.3. Product Benchmarking
8.4.9.4. Strategic Initiatives
8.4.10. Daimler Truck AG
8.4.10.1. Participant’s Overview
8.4.10.2. Financial Performance
8.4.10.3. Product Benchmarking
8.4.10.4. Strategic Initiatives
List of Tables
Table 1. Global buses market size estimates & forecasts, 2021 – 2033 (USD Million)
Table 2. Global buses market, by region, 2021 – 2033 (USD Million)
Table 3. Global buses market, by propulsion, 2021 – 2033 (USD Million)
Table 4. Global buses market, by seating capacity, 2021 – 2033 (USD Million)
Table 5. Global buses market, by end use, 2021 – 2033 (USD Million)
Table 6. ICE market, by region, 2021 – 2033 (USD Million)
Table 7. Electric market, by region, 2021 – 2033 (USD Million)
Table 8. Hybrid market, by region, 2021 – 2033 (USD Million)
Table 9. Up to 30 seats market, by region, 2021 – 2033 (USD Million)
Table 10. 31-50 seats market, by region, 2021 – 2033 (USD Million)
Table 11. Above 50 seats market, by region, 2021 – 2033 (USD Million)
Table 12. Public transportation market, by region, 2021 – 2033 (USD Million)
Table 13. Private transportation market, by region, 2021 – 2033 (USD Million)
Table 14. Institutional use market, by region, 2021 – 2033 (USD Million)
Table 15. North America buses market, by propulsion, 2021 – 2033 (USD Million)
Table 16. North America buses market, by seating capacity, 2021 – 2033 (USD Million)
Table 17. North America buses market, by end use, 2021 – 2033 (USD Million)
Table 18. U.S. buses market, by propulsion, 2021 – 2033 (USD Million)
Table 19. U.S. buses market, by seating capacity, 2021 – 2033 (USD Million)
Table 20. U.S. buses market, by end use, 2021 – 2033 (USD Million)
Table 21. Canada buses market, by propulsion, 2021 – 2033 (USD Million)
Table 22. Canada buses market, by seating capacity, 2021 – 2033 (USD Million)
Table 23. Canada buses market, by end use, 2021 – 2033 (USD Million)
Table 24. Mexico buses market, by propulsion, 2021 – 2033 (USD Million)
Table 25. Mexico buses market, by seating capacity, 2021 – 2033 (USD Million)
Table 26. Mexico buses market, by end use, 2021 – 2033 (USD Million)
Table 27. Europe buses market, by propulsion, 2021 – 2033 (USD Million)
Table 28. Europe buses market, by seating capacity, 2021 – 2033 (USD Million)
Table 29. Europe buses market, by end use, 2021 – 2033 (USD Million)
Table 30. UK buses market, by propulsion, 2021 – 2033 (USD Million)
Table 31. UK buses market, by seating capacity, 2021 – 2033 (USD Million)
Table 32. UK buses market, by end use, 2021 – 2033 (USD Million)
Table 33. Germany buses market, by propulsion, 2021 – 2033 (USD Million)
Table 34. Germany buses market, by seating capacity, 2021 – 2033 (USD Million)
Table 35. Germany buses market, by end use, 2021 – 2033 (USD Million)
Table 36. France buses market, by propulsion, 2021 – 2033 (USD Million)
Table 37. France buses market, by seating capacity, 2021 – 2033 (USD Million)
Table 38. France buses market, by end use, 2021 – 2033 (USD Million)
Table 39. Asia Pacific buses market, by propulsion, 2021 – 2033 (USD Million)
Table 40. Asia Pacific buses market, by seating capacity, 2021 – 2033 (USD Million)
Table 41. Asia Pacific buses market, by end use, 2021 – 2033 (USD Million)
Table 42. China buses market, by propulsion, 2021 – 2033 (USD Million)
Table 43. China buses market, by seating capacity, 2021 – 2033 (USD Million)
Table 44. China buses market, by end use, 2021 – 2033 (USD Million)
Table 45. India buses market, by propulsion, 2021 – 2033 (USD Million)
Table 46. India buses market, by seating capacity, 2021 – 2033 (USD Million)
Table 47. India buses market, by end use, 2021 – 2033 (USD Million)
Table 48. Japan buses market, by propulsion, 2021 – 2033 (USD Million)
Table 49. Japan buses market, by seating capacity, 2021 – 2033 (USD Million)
Table 50. Japan buses market, by end use, 2021 – 2033 (USD Million)
Table 51. Australia buses market, by propulsion, 2021 – 2033 (USD Million)
Table 52. Australia buses market, by seating capacity, 2021 – 2033 (USD Million)
Table 53. Australia buses market, by end use, 2021 – 2033 (USD Million)
Table 54. South Korea buses market, by propulsion, 2021 – 2033 (USD Million)
Table 55. South Korea buses market, by seating capacity, 2021 – 2033 (USD Million)
Table 56. South Korea buses market, by end use, 2021 – 2033 (USD Million)
Table 57. Latin America buses market, by propulsion, 2021 – 2033 (USD Million)
Table 58. Latin America buses market, by seating capacity, 2021 – 2033 (USD Million)
Table 59. Latin America buses market, by end use, 2021 – 2033 (USD Million)
Table 60. Brazil buses market, by propulsion, 2021 – 2033 (USD Million)
Table 61. Brazil buses market, by seating capacity, 2021 – 2033 (USD Million)
Table 62. Brazil buses market, by end use, 2021 – 2033 (USD Million)
Table 63. MEA buses market, by propulsion, 2021 – 2033 (USD Million)
Table 64. MEA buses market, by seating capacity, 2021 – 2033 (USD Million)
Table 65. MEA buses market, by end use, 2021 – 2033 (USD Million)
Table 66. KSA buses market, by propulsion, 2021 – 2033 (USD Million)
Table 67. KSA buses market, by seating capacity, 2021 – 2033 (USD Million)
Table 68. KSA buses market, by end use, 2021 – 2033 (USD Million)
Table 69. UAE buses market, by propulsion, 2021 – 2033 (USD Million)
Table 70. UAE buses market, by seating capacity, 2021 – 2033 (USD Million)
Table 71. UAE buses market, by end use, 2021 – 2033 (USD Million)
Table 72. South Africa buses market, by propulsion, 2021 – 2033 (USD Million)
Table 73. South Africa buses market, by seating capacity, 2021 – 2033 (USD Million)
Table 74. South Africa buses market, by end use, 2021 – 2033 (USD Million)
List of Figures
Fig. 1 Buses market segmentation
Fig. 2 Market research process
Fig. 3 Information procurement
Fig. 4 Primary research pattern
Fig. 5 Market research approaches
Fig. 6 Value chain-based sizing & forecasting
Fig. 7 Parent market analysis
Fig. 8 Market formulation & validation
Fig. 9 Buses market snapshot
Fig. 10 Buses market segment snapshot
Fig. 11 Buses market competitive landscape snapshot
Fig. 12 Market research process
Fig. 13 Market driver relevance analysis (Current & future impact)
Fig. 14 Market restraint relevance analysis (Current & future impact)
Fig. 15 Buses market: Propulsion outlook key takeaways (USD Million)
Fig. 16 Buses market: Propulsion movement analysis 2025 & 2033 (USD Million)
Fig. 17 ICE market revenue estimates and forecasts, 2021 – 2033 (USD Million)
Fig. 18 Electric market revenue estimates and forecasts, 2021 – 2033 (USD Million)
Fig. 19 Hybrid market revenue estimates and forecasts, 2021 – 2033 (USD Million)
Fig. 20 Buses market: Seating capacity outlook key takeaways (USD Million)
Fig. 21 Buses market: Seating capacity movement analysis 2025 & 2033 (USD Million)
Fig. 22 Up to 30 Seats market revenue estimates and forecasts, 2021 – 2033 (USD Million)
Fig. 23 31-50 seats market revenue estimates and forecasts, 2021 – 2033 (USD Million)
Fig. 24 Above 50 seats market revenue estimates and forecasts, 2021 – 2033 (USD Million)
Fig. 25 Buses market: End use outlook key takeaways (USD Million)
Fig. 26 Buses market: End use movement analysis 2025 & 2033 (USD Million)
Fig. 27 Public transportation market revenue estimates and forecasts, 2021 – 2033 (USD Million)
Fig. 28 Private transportation market revenue estimates and forecasts, 2021 – 2033 (USD Million)
Fig. 29 Institutional use market revenue estimates and forecasts, 2021 – 2033 (USD Million)
Fig. 30 Regional marketplace: Key takeaways
Fig. 31 Buses market: Regional outlook, 2025 & 2033 (USD Million)
Fig. 32 North America buses market estimates and forecasts, 2021 – 2033 (USD Million)
Fig. 33 US buses market estimates and forecasts, 2021 – 2033 (USD Million)
Fig. 34 Canada buses market estimates and forecasts, 2021 – 2033 (USD Million)
Fig. 35 Mexico buses market estimates and forecasts, 2021 – 2033 (USD Million)
Fig. 36 Europe buses market estimates and forecasts, 2021 – 2033 (USD Million)
Fig. 37 UK buses market estimates and forecasts, 2021 – 2033 (USD Million)
Fig. 38 Germany buses market estimates and forecasts, 2021 – 2033 (USD Million)
Fig. 39 France buses market estimates and forecasts, 2021 – 2033 (USD Million)
Fig. 40 Asia Pacific buses market estimates and forecasts, 2021 – 2033 (USD Million)
Fig. 41 Japan buses market estimates and forecasts, 2021 – 2033 (USD Million)
Fig. 42 China buses market estimates and forecasts, 2021 – 2033 (USD Million)
Fig. 43 India buses market estimates and forecasts, 2021 – 2033 (USD Million)
Fig. 44 Australia buses market estimates and forecasts, 2021 – 2033 (USD Million)
Fig. 45 South Korea buses market estimates and forecasts, 2021 – 2033 (USD Million)
Fig. 46 Latin America buses market estimates and forecasts, 2021 – 2033 (USD Million)
Fig. 47 Brazil buses market estimates and forecasts, 2021 – 2033 (USD Million)
Fig. 48 MEA buses market estimates and forecasts, 2021 – 2033 (USD Million)
Fig. 49 KSA buses market estimates and forecasts, 2021 – 2033 (USD Million)
Fig. 50 UAE buses market estimates and forecasts, 2021 – 2033 (USD Million)
Fig. 51 South Africa buses market estimates and forecasts, 2021 – 2033 (USD Million)
Fig. 52 Strategy framework
Fig. 53 Company Categorization