Wearable Sensors Market : Global Opportunity Analysis and Industry Forecast, 2024-2034
Wearable Sensors Market By Type (Accelerometers, Gyroscopes, Inertial Sensors, Motion Sensors, Pressure and Force Sensors, Touch Sensors, Others), By Application (Wristwear, Eyewear, Footwear, Neckwear, Bodywear, Others), By End User (Consumer, Healthcare, Industrial, Others): Global Opportunity Analysis and Industry Forecast, 2024 - 2034
ウェアラブルセンサー市場 - タイプ別(加速度計、ジャイロスコープ、慣性センサー、モーションセンサー、圧力・力センサー、タッチセンサー、その他)、用途別(リストウェア、アイウェア、フットウェア、ネックウェア、ボディウェア、その他)、エンドユーザー別(消費者、ヘルスケア、産業、その他):世界の機会分析と業界予測 2024-2034年
| 出版 | Allied Market Research |
| 出版年月 | 2025年06月 |
| ページ数 | 260 |
| 価格 | 記載以外のライセンスについてはお問合せください |
| シングルユーザ | USD 4,155 |
| 種別 | 英文調査報告書 |
| 商品番号 | SMR-1199011990 |

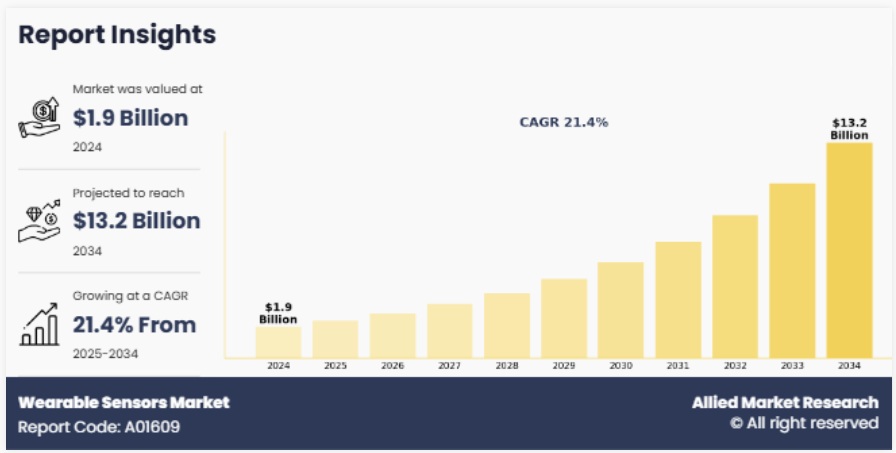
ウェアラブルセンサー市場は2024年に19億ドルと評価され、2025年から2034年にかけて21.4%のCAGRで成長し、2034年までに132億ドルに達すると予測されています。
ウェアラブルセンサーは、身体に埋め込まれたり装着されたりして、リアルタイムの生理学的データや環境データを監視、収集、送信する小型のインテリジェントデバイスです。これらのセンサーは、スマートウォッチ、フィットネストラッカー、医療モニタリングデバイス、スマートウェアラブルデバイスなどのウェアラブルデバイスにおいて重要な役割を果たしています。医療、スポーツ&フィットネス、防衛、民生用電子機器など、幅広い分野で利用されています。ウェアラブルセンサーは、IoT(モノのインターネット)やAI(人工知能)技術との統合が進むにつれて機能が向上し、より正確で効率的、かつパーソナライズされたデータ監視と分析が可能になっています。ウェアラブルセンサー市場は、健康・ウェルネスモニタリングの需要の高まり、予防医療への意識の高まり、そしてセンサー技術の進歩により、大きな注目を集めています。
主な調査結果
- タイプ別では、加速度計セグメントが2024年のウェアラブルセンサー市場で最大のシェアを占めました。
- 用途別では、リストウェアセグメントが2024年のウェアラブルセンサー市場で最大のシェアを占めました。
- エンドユーザー別では、コンシューマーセグメントが2024年のウェアラブルセンサー市場で最大のシェアを占めました。
- 地域別に見ると、2024年にはアジア太平洋地域が最大の市場シェアを占めました。ただし、予測期間中はヨーロッパが最も高いCAGRを記録すると予想されています。
Report Description
The wearable sensors market was valued at $1.9 billion in 2024, and is estimated to reach $13.2 billion by 2034, growing at a CAGR of 21.4% from 2025 to 2034.
Wearable sensors are compact, intelligent devices embedded in or worn on the body to monitor, collect, and transmit real-time physiological and environmental data. These sensors play a key role in wearable devices such as smartwatches, fitness trackers, medical monitoring devices, and smart clothing. They are widely used across sectors such as healthcare, sports & fitness, defense, and consumer electronics. Increase in integration of wearable sensors with Internet of Things (IoT) and artificial intelligence (AI) technologies has enhanced their capabilities, enabling more accurate, efficient, and personalized data monitoring and analysis. The wearable sensors market has gained significant traction due to rise in demand for health and wellness monitoring, surge in awareness around preventive healthcare, and advancements in sensor technologies.
Factors such as the popularity of wearable fitness & health tracking devices, increase in adoption of smart wearables among consumers, and rise in health consciousness positively impact the growth of the wearable sensors market. In addition, surge in demand for remote patient monitoring and telehealth solutions, particularly post-COVID-19, has fueled the use of wearable sensors in healthcare applications. Continuous innovations in flexible and miniaturized sensor technologies, along with increase in smartphone penetration and mobile health applications, further contribute to market growth.
However, concerns regarding data security & privacy, high initial costs of advanced wearable devices, and issues related to accuracy and battery life of wearable sensors are expected to hinder market expansion. Moreover, limited reimbursement policies and regulatory hurdles in medical-grade wearable devices may restrict wider adoption, especially in developing regions.
On the other hand, the wearable sensors market presents numerous growth opportunities. Increase in adoption of wearable technologies in developing economies, coupled with rise in investments in digital health infrastructure, is expected to drive demand for wearable sensors. The ongoing development of next-generation biosensors, integration of AI & machine learning for predictive analytics, and use of wearable sensors in non-healthcare fields like industrial safety, military, and smart textiles are anticipated to offer lucrative prospects. Furthermore, collaborations between tech companies and healthcare providers, along with supportive government initiatives promoting digital health, are projected to enhance market potential during the forecast period. For instance, in January 2025, STMicroelectronics partnered with Pison & Timex to integrate neural (EEG) sensing into Snapdragon‑powered smartwatches.
Segment Review
The wearable sensors market is segmented on the basis of type, application, end user, and region. On the basis of type, the market is divided into accelerometers, gyroscopes, inertial sensors, motion sensors, pressure and force sensors, touch sensors, and others. By application, the market is segregated into wristwear, eyewear, footwear, neckwear, bodywear, and others. As per end user, the market is classified into consumer, healthcare, industrial, and others. By region, it is analyzed across North America (the U.S., Canada, and Mexico), Europe (the UK, Germany, France, Italy, and the rest of Europe), Asia-Pacific (China, Japan, India, and rest of Asia-Pacific), and LAMEA (Latin America, Middle East, and Africa).
Key Findings
- By type, the accelerometers segment held the largest share in the wearable sensors market for 2024.
- By application, the wristwear segment held the largest share in the wearable sensors market for 2024.
- By end user, the consumer segment held the largest share in the wearable sensors market for 2024.
- Region-wise, Asia-Pacific held the largest market share in 2024. However, Europe is expected to witness the highest CAGR during the forecast period.
Competition Analysis
The key players profiled in the wearable sensors market analysis are STMicroelectronics, Panasonic Corporation, Infineon Technologies, Knowles Electronics, NXP Semiconductors, ROHM Semiconductor, TE Connectivity, MEMSIC, Analog Devices, and Murata. These players have adopted various strategies to increase their market penetration and strengthen their position in the wearable sensors industry.
Key Benefits for Stakeholders
This report provides a quantitative analysis of the market segments, current trends, estimations, and dynamics of the wearable sensors market analysis from 2024 to 2034 to identify the prevailing wearable sensors market opportunities.
The market research is offered along with information related to key drivers, restraints, and opportunities.
Porter’s five forces analysis highlights the potency of buyers and suppliers to enable stakeholders make profit-oriented business decisions and strengthen their supplier-buyer network.
In-depth analysis of the wearable sensors market segmentation assists to determine the prevailing market opportunities.
Major countries in each region are mapped according to their revenue contribution to the global market.
Market player positioning facilitates benchmarking and provides a clear understanding of the present position of the market players.
The report includes the analysis of the regional as well as global wearable sensors market trends, key players, market segments, application areas, and market growth strategies.
Additional benefits you will get with this purchase are:
- Quarterly Update and* (only available with a corporate license, on listed price)
- 5 additional Company Profile of client Choice pre- or Post-purchase, as a free update.
- Free Upcoming Version on the Purchase of Five and Enterprise User License.
- 16 analyst hours of support* (post-purchase, if you find additional data requirements upon review of the report, you may receive support amounting to 16 analyst hours to solve questions, and post-sale queries)
- 15% Free Customization* (in case the scope or segment of the report does not match your requirements, 15% is equivalent to 3 working days of free work, applicable once)
- Free data Pack on the Five and Enterprise User License. (Excel version of the report)
- Free Updated report if the report is 6-12 months old or older.
- 24-hour priority response*
- Free Industry updates and white papers.
Possible Customization with this report (with additional cost and timeline, please talk to the sales executive to know more)
- Additional company profiles with specific to client’s interest
- Historic market data
- SWOT Analysis
Key Market Segments
| Aspects | Details |
|
Market Size By 2034
|
USD 13.2 billion |
|
Growth Rate
|
CAGR of 21.4% |
|
Forecast period
|
2024 – 2034 |
|
Report Pages
|
260 |
|
By Type
|
|
|
By Application
|
|
|
By End User
|
|
|
By Region
|
|
|
Key Market Players
|
TE Connectivity, Analog Devices, Inc., MEMSIC Semiconductor Co., Ltd., NXP Semiconductors, Panasonic Corporation, Murata Manufacturing Co., Ltd., STMicroelectronics N.V., Knowles Electronics, LLC, Infineon Technologies AG, ROHM Semiconductor |
Table of Content
CHAPTER 1: INTRODUCTION
1.1. Report description
1.2. Key market segments
1.3. Key benefits to the stakeholders
1.4. Research methodology
1.4.1. Primary research
1.4.2. Secondary research
1.4.3. Analyst tools and models
CHAPTER 2: EXECUTIVE SUMMARY
2.1. CXO perspective
CHAPTER 3: MARKET OVERVIEW
3.1. Market definition and scope
3.2. Key findings
3.2.1. Top impacting factors
3.2.2. Top investment pockets
3.3. Porter’s five forces analysis
3.3.1. Moderate bargaining power of suppliers
3.3.2. Moderate threat of new entrants
3.3.3. Moderate to high threat of substitutes
3.3.4. Moderate intensity of rivalry
3.3.5. Moderate to high bargaining power of buyers
3.4. Market dynamics
3.4.1. Drivers
3.4.1.1. Growing integration with smartphones and IoT devices
3.4.1.2. Rising prevalence of chronic diseases
3.4.1.3. Increased health and fitness awareness
3.4.2. Restraints
3.4.2.1. High cost and affordability issues
3.4.3. Opportunities
3.4.3.1. Remote Patient Monitoring
3.4.3.2. Sports and Performance Optimization
CHAPTER 4: WEARABLE SENSORS MARKET, BY TYPE
4.1. Overview
4.1.1. Market size and forecast
4.2. Accelerometers
4.2.1. Key market trends, growth factors and opportunities
4.2.2. Market size and forecast, by region
4.2.3. Market share analysis by country
4.3. Gyroscopes
4.3.1. Key market trends, growth factors and opportunities
4.3.2. Market size and forecast, by region
4.3.3. Market share analysis by country
4.4. Inertial Sensors
4.4.1. Key market trends, growth factors and opportunities
4.4.2. Market size and forecast, by region
4.4.3. Market share analysis by country
4.5. Motion Sensors
4.5.1. Key market trends, growth factors and opportunities
4.5.2. Market size and forecast, by region
4.5.3. Market share analysis by country
4.6. Pressure and Force Sensors
4.6.1. Key market trends, growth factors and opportunities
4.6.2. Market size and forecast, by region
4.6.3. Market share analysis by country
4.7. Touch Sensors
4.7.1. Key market trends, growth factors and opportunities
4.7.2. Market size and forecast, by region
4.7.3. Market share analysis by country
4.8. Others
4.8.1. Key market trends, growth factors and opportunities
4.8.2. Market size and forecast, by region
4.8.3. Market share analysis by country
CHAPTER 5: WEARABLE SENSORS MARKET, BY APPLICATION
5.1. Overview
5.1.1. Market size and forecast
5.2. Wristwear
5.2.1. Key market trends, growth factors and opportunities
5.2.2. Market size and forecast, by region
5.2.3. Market share analysis by country
5.3. Eyewear
5.3.1. Key market trends, growth factors and opportunities
5.3.2. Market size and forecast, by region
5.3.3. Market share analysis by country
5.4. Footwear
5.4.1. Key market trends, growth factors and opportunities
5.4.2. Market size and forecast, by region
5.4.3. Market share analysis by country
5.5. Neckwear
5.5.1. Key market trends, growth factors and opportunities
5.5.2. Market size and forecast, by region
5.5.3. Market share analysis by country
5.6. Bodywear
5.6.1. Key market trends, growth factors and opportunities
5.6.2. Market size and forecast, by region
5.6.3. Market share analysis by country
5.7. Others
5.7.1. Key market trends, growth factors and opportunities
5.7.2. Market size and forecast, by region
5.7.3. Market share analysis by country
CHAPTER 6: WEARABLE SENSORS MARKET, BY END USER
6.1. Overview
6.1.1. Market size and forecast
6.2. Consumer
6.2.1. Key market trends, growth factors and opportunities
6.2.2. Market size and forecast, by region
6.2.3. Market share analysis by country
6.3. Healthcare
6.3.1. Key market trends, growth factors and opportunities
6.3.2. Market size and forecast, by region
6.3.3. Market share analysis by country
6.4. Industrial
6.4.1. Key market trends, growth factors and opportunities
6.4.2. Market size and forecast, by region
6.4.3. Market share analysis by country
6.5. Others
6.5.1. Key market trends, growth factors and opportunities
6.5.2. Market size and forecast, by region
6.5.3. Market share analysis by country
CHAPTER 7: WEARABLE SENSORS MARKET, BY REGION
7.1. Overview
7.1.1. Market size and forecast By Region
7.2. North America
7.2.1. Key market trends, growth factors and opportunities
7.2.2. Market size and forecast, by Type
7.2.3. Market size and forecast, by Application
7.2.4. Market size and forecast, by End User
7.2.5. Market size and forecast, by country
7.2.5.1. U.S.
7.2.5.1.1. Market size and forecast, by Type
7.2.5.1.2. Market size and forecast, by Application
7.2.5.1.3. Market size and forecast, by End User
7.2.5.2. Canada
7.2.5.2.1. Market size and forecast, by Type
7.2.5.2.2. Market size and forecast, by Application
7.2.5.2.3. Market size and forecast, by End User
7.2.5.3. Mexico
7.2.5.3.1. Market size and forecast, by Type
7.2.5.3.2. Market size and forecast, by Application
7.2.5.3.3. Market size and forecast, by End User
7.3. Europe
7.3.1. Key market trends, growth factors and opportunities
7.3.2. Market size and forecast, by Type
7.3.3. Market size and forecast, by Application
7.3.4. Market size and forecast, by End User
7.3.5. Market size and forecast, by country
7.3.5.1. UK
7.3.5.1.1. Market size and forecast, by Type
7.3.5.1.2. Market size and forecast, by Application
7.3.5.1.3. Market size and forecast, by End User
7.3.5.2. Germany
7.3.5.2.1. Market size and forecast, by Type
7.3.5.2.2. Market size and forecast, by Application
7.3.5.2.3. Market size and forecast, by End User
7.3.5.3. France
7.3.5.3.1. Market size and forecast, by Type
7.3.5.3.2. Market size and forecast, by Application
7.3.5.3.3. Market size and forecast, by End User
7.3.5.4. Italy
7.3.5.4.1. Market size and forecast, by Type
7.3.5.4.2. Market size and forecast, by Application
7.3.5.4.3. Market size and forecast, by End User
7.3.5.5. Rest of Europe
7.3.5.5.1. Market size and forecast, by Type
7.3.5.5.2. Market size and forecast, by Application
7.3.5.5.3. Market size and forecast, by End User
7.4. Asia-Pacific
7.4.1. Key market trends, growth factors and opportunities
7.4.2. Market size and forecast, by Type
7.4.3. Market size and forecast, by Application
7.4.4. Market size and forecast, by End User
7.4.5. Market size and forecast, by country
7.4.5.1. China
7.4.5.1.1. Market size and forecast, by Type
7.4.5.1.2. Market size and forecast, by Application
7.4.5.1.3. Market size and forecast, by End User
7.4.5.2. Japan
7.4.5.2.1. Market size and forecast, by Type
7.4.5.2.2. Market size and forecast, by Application
7.4.5.2.3. Market size and forecast, by End User
7.4.5.3. India
7.4.5.3.1. Market size and forecast, by Type
7.4.5.3.2. Market size and forecast, by Application
7.4.5.3.3. Market size and forecast, by End User
7.4.5.4. South Korea
7.4.5.4.1. Market size and forecast, by Type
7.4.5.4.2. Market size and forecast, by Application
7.4.5.4.3. Market size and forecast, by End User
7.4.5.5. Rest of Asia-Pacific
7.4.5.5.1. Market size and forecast, by Type
7.4.5.5.2. Market size and forecast, by Application
7.4.5.5.3. Market size and forecast, by End User
7.5. LAMEA
7.5.1. Key market trends, growth factors and opportunities
7.5.2. Market size and forecast, by Type
7.5.3. Market size and forecast, by Application
7.5.4. Market size and forecast, by End User
7.5.5. Market size and forecast, by country
7.5.5.1. Latin America
7.5.5.1.1. Market size and forecast, by Type
7.5.5.1.2. Market size and forecast, by Application
7.5.5.1.3. Market size and forecast, by End User
7.5.5.2. Middle East
7.5.5.2.1. Market size and forecast, by Type
7.5.5.2.2. Market size and forecast, by Application
7.5.5.2.3. Market size and forecast, by End User
7.5.5.3. Africa
7.5.5.3.1. Market size and forecast, by Type
7.5.5.3.2. Market size and forecast, by Application
7.5.5.3.3. Market size and forecast, by End User
CHAPTER 8: COMPETITIVE LANDSCAPE
8.1. Introduction
8.2. Top winning strategies
8.3. Product mapping of top 10 player
8.4. Competitive dashboard
8.5. Competitive heatmap
8.6. Top player positioning, 2024
CHAPTER 9: COMPANY PROFILES
9.1. Infineon Technologies AG
9.1.1. Company overview
9.1.2. Key executives
9.1.3. Company snapshot
9.1.4. Operating business segments
9.1.5. Product portfolio
9.1.6. Business performance
9.2. MEMSIC Semiconductor Co., Ltd.
9.2.1. Company overview
9.2.2. Key executives
9.2.3. Company snapshot
9.2.4. Operating business segments
9.2.5. Product portfolio
9.3. Murata Manufacturing Co., Ltd.
9.3.1. Company overview
9.3.2. Key executives
9.3.3. Company snapshot
9.3.4. Operating business segments
9.3.5. Product portfolio
9.3.6. Business performance
9.4. STMicroelectronics N.V.
9.4.1. Company overview
9.4.2. Key executives
9.4.3. Company snapshot
9.4.4. Operating business segments
9.4.5. Product portfolio
9.4.6. Business performance
9.5. Panasonic Corporation
9.5.1. Company overview
9.5.2. Key executives
9.5.3. Company snapshot
9.5.4. Operating business segments
9.5.5. Product portfolio
9.5.6. Business performance
9.6. Knowles Electronics, LLC
9.6.1. Company overview
9.6.2. Key executives
9.6.3. Company snapshot
9.6.4. Operating business segments
9.6.5. Product portfolio
9.6.6. Business performance
9.7. NXP Semiconductors
9.7.1. Company overview
9.7.2. Key executives
9.7.3. Company snapshot
9.7.4. Operating business segments
9.7.5. Product portfolio
9.7.6. Business performance
9.8. TE Connectivity
9.8.1. Company overview
9.8.2. Key executives
9.8.3. Company snapshot
9.8.4. Operating business segments
9.8.5. Product portfolio
9.8.6. Business performance
9.9. ROHM Semiconductor
9.9.1. Company overview
9.9.2. Key executives
9.9.3. Company snapshot
9.9.4. Operating business segments
9.9.5. Product portfolio
9.9.6. Business performance
9.10. Analog Devices, Inc.
9.10.1. Company overview
9.10.2. Key executives
9.10.3. Company snapshot
9.10.4. Operating business segments
9.10.5. Product portfolio
9.10.6. Business performance
LIST OF TABLES
TABLE 01. GLOBAL WEARABLE SENSORS MARKET, BY TYPE, 2024-2034 ($MILLION)
TABLE 02. WEARABLE SENSORS MARKET FOR ACCELEROMETERS, BY REGION, 2024-2034 ($MILLION)
TABLE 03. WEARABLE SENSORS MARKET FOR GYROSCOPES, BY REGION, 2024-2034 ($MILLION)
TABLE 04. WEARABLE SENSORS MARKET FOR INERTIAL SENSORS, BY REGION, 2024-2034 ($MILLION)
TABLE 05. WEARABLE SENSORS MARKET FOR MOTION SENSORS, BY REGION, 2024-2034 ($MILLION)
TABLE 06. WEARABLE SENSORS MARKET FOR PRESSURE AND FORCE SENSORS, BY REGION, 2024-2034 ($MILLION)
TABLE 07. WEARABLE SENSORS MARKET FOR TOUCH SENSORS, BY REGION, 2024-2034 ($MILLION)
TABLE 08. WEARABLE SENSORS MARKET FOR OTHERS, BY REGION, 2024-2034 ($MILLION)
TABLE 09. GLOBAL WEARABLE SENSORS MARKET, BY APPLICATION, 2024-2034 (MILLION UNITS)
TABLE 10. GLOBAL WEARABLE SENSORS MARKET, BY APPLICATION, 2024-2034 ($MILLION)
TABLE 11. WEARABLE SENSORS MARKET FOR WRISTWEAR, BY REGION, 2024-2034 ($MILLION)
TABLE 12. WEARABLE SENSORS MARKET FOR EYEWEAR, BY REGION, 2024-2034 ($MILLION)
TABLE 13. WEARABLE SENSORS MARKET FOR FOOTWEAR, BY REGION, 2024-2034 ($MILLION)
TABLE 14. WEARABLE SENSORS MARKET FOR NECKWEAR, BY REGION, 2024-2034 ($MILLION)
TABLE 15. WEARABLE SENSORS MARKET FOR BODYWEAR, BY REGION, 2024-2034 ($MILLION)
TABLE 16. WEARABLE SENSORS MARKET FOR OTHERS, BY REGION, 2024-2034 ($MILLION)
TABLE 17. GLOBAL WEARABLE SENSORS MARKET, BY END USER, 2024-2034 ($MILLION)
TABLE 18. WEARABLE SENSORS MARKET FOR CONSUMER, BY REGION, 2024-2034 ($MILLION)
TABLE 19. WEARABLE SENSORS MARKET FOR HEALTHCARE, BY REGION, 2024-2034 ($MILLION)
TABLE 20. WEARABLE SENSORS MARKET FOR INDUSTRIAL, BY REGION, 2024-2034 ($MILLION)
TABLE 21. WEARABLE SENSORS MARKET FOR OTHERS, BY REGION, 2024-2034 ($MILLION)
TABLE 22. WEARABLE SENSORS MARKET, BY REGION, 2024-2034 ($MILLION)
TABLE 23. NORTH AMERICA WEARABLE SENSORS MARKET, BY TYPE, 2024-2034 ($MILLION)
TABLE 24. NORTH AMERICA WEARABLE SENSORS MARKET, BY APPLICATION, 2024-2034 ($MILLION)
TABLE 25. NORTH AMERICA WEARABLE SENSORS MARKET, BY END USER, 2024-2034 ($MILLION)
TABLE 26. NORTH AMERICA WEARABLE SENSORS MARKET, BY COUNTRY, 2024-2034 ($MILLION)
TABLE 27. U.S. WEARABLE SENSORS MARKET, BY TYPE, 2024-2034 ($MILLION)
TABLE 28. U.S. WEARABLE SENSORS MARKET, BY APPLICATION, 2024-2034 ($MILLION)
TABLE 29. U.S. WEARABLE SENSORS MARKET, BY END USER, 2024-2034 ($MILLION)
TABLE 30. CANADA WEARABLE SENSORS MARKET, BY TYPE, 2024-2034 ($MILLION)
TABLE 31. CANADA WEARABLE SENSORS MARKET, BY APPLICATION, 2024-2034 ($MILLION)
TABLE 32. CANADA WEARABLE SENSORS MARKET, BY END USER, 2024-2034 ($MILLION)
TABLE 33. MEXICO WEARABLE SENSORS MARKET, BY TYPE, 2024-2034 ($MILLION)
TABLE 34. MEXICO WEARABLE SENSORS MARKET, BY APPLICATION, 2024-2034 ($MILLION)
TABLE 35. MEXICO WEARABLE SENSORS MARKET, BY END USER, 2024-2034 ($MILLION)
TABLE 36. EUROPE WEARABLE SENSORS MARKET, BY TYPE, 2024-2034 ($MILLION)
TABLE 37. EUROPE WEARABLE SENSORS MARKET, BY APPLICATION, 2024-2034 ($MILLION)
TABLE 38. EUROPE WEARABLE SENSORS MARKET, BY END USER, 2024-2034 ($MILLION)
TABLE 39. EUROPE WEARABLE SENSORS MARKET, BY COUNTRY, 2024-2034 ($MILLION)
TABLE 40. UK WEARABLE SENSORS MARKET, BY TYPE, 2024-2034 ($MILLION)
TABLE 41. UK WEARABLE SENSORS MARKET, BY APPLICATION, 2024-2034 ($MILLION)
TABLE 42. UK WEARABLE SENSORS MARKET, BY END USER, 2024-2034 ($MILLION)
TABLE 43. GERMANY WEARABLE SENSORS MARKET, BY TYPE, 2024-2034 ($MILLION)
TABLE 44. GERMANY WEARABLE SENSORS MARKET, BY APPLICATION, 2024-2034 ($MILLION)
TABLE 45. GERMANY WEARABLE SENSORS MARKET, BY END USER, 2024-2034 ($MILLION)
TABLE 46. FRANCE WEARABLE SENSORS MARKET, BY TYPE, 2024-2034 ($MILLION)
TABLE 47. FRANCE WEARABLE SENSORS MARKET, BY APPLICATION, 2024-2034 ($MILLION)
TABLE 48. FRANCE WEARABLE SENSORS MARKET, BY END USER, 2024-2034 ($MILLION)
TABLE 49. ITALY WEARABLE SENSORS MARKET, BY TYPE, 2024-2034 ($MILLION)
TABLE 50. ITALY WEARABLE SENSORS MARKET, BY APPLICATION, 2024-2034 ($MILLION)
TABLE 51. ITALY WEARABLE SENSORS MARKET, BY END USER, 2024-2034 ($MILLION)
TABLE 52. REST OF EUROPE WEARABLE SENSORS MARKET, BY TYPE, 2024-2034 ($MILLION)
TABLE 53. REST OF EUROPE WEARABLE SENSORS MARKET, BY APPLICATION, 2024-2034 ($MILLION)
TABLE 54. REST OF EUROPE WEARABLE SENSORS MARKET, BY END USER, 2024-2034 ($MILLION)
TABLE 55. ASIA-PACIFIC WEARABLE SENSORS MARKET, BY TYPE, 2024-2034 ($MILLION)
TABLE 56. ASIA-PACIFIC WEARABLE SENSORS MARKET, BY APPLICATION, 2024-2034 ($MILLION)
TABLE 57. ASIA-PACIFIC WEARABLE SENSORS MARKET, BY END USER, 2024-2034 ($MILLION)
TABLE 58. ASIA-PACIFIC WEARABLE SENSORS MARKET, BY COUNTRY, 2024-2034 ($MILLION)
TABLE 59. CHINA WEARABLE SENSORS MARKET, BY TYPE, 2024-2034 ($MILLION)
TABLE 60. CHINA WEARABLE SENSORS MARKET, BY APPLICATION, 2024-2034 ($MILLION)
TABLE 61. CHINA WEARABLE SENSORS MARKET, BY END USER, 2024-2034 ($MILLION)
TABLE 62. JAPAN WEARABLE SENSORS MARKET, BY TYPE, 2024-2034 ($MILLION)
TABLE 63. JAPAN WEARABLE SENSORS MARKET, BY APPLICATION, 2024-2034 ($MILLION)
TABLE 64. JAPAN WEARABLE SENSORS MARKET, BY END USER, 2024-2034 ($MILLION)
TABLE 65. INDIA WEARABLE SENSORS MARKET, BY TYPE, 2024-2034 ($MILLION)
TABLE 66. INDIA WEARABLE SENSORS MARKET, BY APPLICATION, 2024-2034 ($MILLION)
TABLE 67. INDIA WEARABLE SENSORS MARKET, BY END USER, 2024-2034 ($MILLION)
TABLE 68. SOUTH KOREA WEARABLE SENSORS MARKET, BY TYPE, 2024-2034 ($MILLION)
TABLE 69. SOUTH KOREA WEARABLE SENSORS MARKET, BY APPLICATION, 2024-2034 ($MILLION)
TABLE 70. SOUTH KOREA WEARABLE SENSORS MARKET, BY END USER, 2024-2034 ($MILLION)
TABLE 71. REST OF ASIA-PACIFIC WEARABLE SENSORS MARKET, BY TYPE, 2024-2034 ($MILLION)
TABLE 72. REST OF ASIA-PACIFIC WEARABLE SENSORS MARKET, BY APPLICATION, 2024-2034 ($MILLION)
TABLE 73. REST OF ASIA-PACIFIC WEARABLE SENSORS MARKET, BY END USER, 2024-2034 ($MILLION)
TABLE 74. LAMEA WEARABLE SENSORS MARKET, BY TYPE, 2024-2034 ($MILLION)
TABLE 75. LAMEA WEARABLE SENSORS MARKET, BY APPLICATION, 2024-2034 ($MILLION)
TABLE 76. LAMEA WEARABLE SENSORS MARKET, BY END USER, 2024-2034 ($MILLION)
TABLE 77. LAMEA WEARABLE SENSORS MARKET, BY COUNTRY, 2024-2034 ($MILLION)
TABLE 78. LATIN AMERICA WEARABLE SENSORS MARKET, BY TYPE, 2024-2034 ($MILLION)
TABLE 79. LATIN AMERICA WEARABLE SENSORS MARKET, BY APPLICATION, 2024-2034 ($MILLION)
TABLE 80. LATIN AMERICA WEARABLE SENSORS MARKET, BY END USER, 2024-2034 ($MILLION)
TABLE 81. MIDDLE EAST WEARABLE SENSORS MARKET, BY TYPE, 2024-2034 ($MILLION)
TABLE 82. MIDDLE EAST WEARABLE SENSORS MARKET, BY APPLICATION, 2024-2034 ($MILLION)
TABLE 83. MIDDLE EAST WEARABLE SENSORS MARKET, BY END USER, 2024-2034 ($MILLION)
TABLE 84. AFRICA WEARABLE SENSORS MARKET, BY TYPE, 2024-2034 ($MILLION)
TABLE 85. AFRICA WEARABLE SENSORS MARKET, BY APPLICATION, 2024-2034 ($MILLION)
TABLE 86. AFRICA WEARABLE SENSORS MARKET, BY END USER, 2024-2034 ($MILLION)
TABLE 87. INFINEON TECHNOLOGIES AG: KEY EXECUTIVES
TABLE 88. INFINEON TECHNOLOGIES AG: COMPANY SNAPSHOT
TABLE 89. INFINEON TECHNOLOGIES AG: PRODUCT SEGMENTS
TABLE 90. INFINEON TECHNOLOGIES AG: PRODUCT PORTFOLIO
TABLE 91. MEMSIC SEMICONDUCTOR CO., LTD.: KEY EXECUTIVES
TABLE 92. MEMSIC SEMICONDUCTOR CO., LTD.: COMPANY SNAPSHOT
TABLE 93. MEMSIC SEMICONDUCTOR CO., LTD.: PRODUCT SEGMENTS
TABLE 94. MEMSIC SEMICONDUCTOR CO., LTD.: PRODUCT PORTFOLIO
TABLE 95. MURATA MANUFACTURING CO., LTD.: KEY EXECUTIVES
TABLE 96. MURATA MANUFACTURING CO., LTD.: COMPANY SNAPSHOT
TABLE 97. MURATA MANUFACTURING CO., LTD.: PRODUCT SEGMENTS
TABLE 98. MURATA MANUFACTURING CO., LTD.: PRODUCT PORTFOLIO
TABLE 99. STMICROELECTRONICS N.V.: KEY EXECUTIVES
TABLE 100. STMICROELECTRONICS N.V.: COMPANY SNAPSHOT
TABLE 101. STMICROELECTRONICS N.V.: PRODUCT SEGMENTS
TABLE 102. STMICROELECTRONICS N.V.: PRODUCT PORTFOLIO
TABLE 103. PANASONIC CORPORATION: KEY EXECUTIVES
TABLE 104. PANASONIC CORPORATION: COMPANY SNAPSHOT
TABLE 105. PANASONIC CORPORATION: PRODUCT SEGMENTS
TABLE 106. PANASONIC CORPORATION: PRODUCT PORTFOLIO
TABLE 107. KNOWLES ELECTRONICS, LLC: KEY EXECUTIVES
TABLE 108. KNOWLES ELECTRONICS, LLC: COMPANY SNAPSHOT
TABLE 109. KNOWLES ELECTRONICS, LLC: SERVICE SEGMENTS
TABLE 110. KNOWLES ELECTRONICS, LLC: PRODUCT PORTFOLIO
TABLE 111. NXP SEMICONDUCTORS: KEY EXECUTIVES
TABLE 112. NXP SEMICONDUCTORS: COMPANY SNAPSHOT
TABLE 113. NXP SEMICONDUCTORS: PRODUCT SEGMENTS
TABLE 114. NXP SEMICONDUCTORS: PRODUCT PORTFOLIO
TABLE 115. TE CONNECTIVITY: KEY EXECUTIVES
TABLE 116. TE CONNECTIVITY: COMPANY SNAPSHOT
TABLE 117. TE CONNECTIVITY: PRODUCT SEGMENTS
TABLE 118. TE CONNECTIVITY: PRODUCT PORTFOLIO
TABLE 119. ROHM SEMICONDUCTOR: KEY EXECUTIVES
TABLE 120. ROHM SEMICONDUCTOR: COMPANY SNAPSHOT
TABLE 121. ROHM SEMICONDUCTOR: PRODUCT SEGMENTS
TABLE 122. ROHM SEMICONDUCTOR: PRODUCT PORTFOLIO
TABLE 123. ANALOG DEVICES, INC.: KEY EXECUTIVES
TABLE 124. ANALOG DEVICES, INC.: COMPANY SNAPSHOT
TABLE 125. ANALOG DEVICES, INC.: PRODUCT SEGMENTS
TABLE 126. ANALOG DEVICES, INC.: PRODUCT PORTFOLIO
LIST OF FIGURES
FIGURE 01. WEARABLE SENSORS MARKET, 2024-2034
FIGURE 02. SEGMENTATION OF WEARABLE SENSORS MARKET,2024-2034
FIGURE 03. TOP IMPACTING FACTORS IN WEARABLE SENSORS MARKET (2024 TO 2034)
FIGURE 04. TOP INVESTMENT POCKETS IN WEARABLE SENSORS MARKET (2025-2034)
FIGURE 05. MODERATE BARGAINING POWER OF SUPPLIERS
FIGURE 06. MODERATE THREAT OF NEW ENTRANTS
FIGURE 07. MODERATE TO HIGH THREAT OF SUBSTITUTES
FIGURE 08. MODERATE INTENSITY OF RIVALRY
FIGURE 09. MODERATE TO HIGH BARGAINING POWER OF BUYERS
FIGURE 10. GLOBAL WEARABLE SENSORS MARKET:DRIVERS, RESTRAINTS AND OPPORTUNITIES
FIGURE 11. WEARABLE SENSORS MARKET, BY TYPE, 2024 AND 2034(%)
FIGURE 12. COMPARATIVE SHARE ANALYSIS OF WEARABLE SENSORS MARKET FOR ACCELEROMETERS, BY COUNTRY 2024 AND 2034(%)
FIGURE 13. COMPARATIVE SHARE ANALYSIS OF WEARABLE SENSORS MARKET FOR GYROSCOPES, BY COUNTRY 2024 AND 2034(%)
FIGURE 14. COMPARATIVE SHARE ANALYSIS OF WEARABLE SENSORS MARKET FOR INERTIAL SENSORS, BY COUNTRY 2024 AND 2034(%)
FIGURE 15. COMPARATIVE SHARE ANALYSIS OF WEARABLE SENSORS MARKET FOR MOTION SENSORS, BY COUNTRY 2024 AND 2034(%)
FIGURE 16. COMPARATIVE SHARE ANALYSIS OF WEARABLE SENSORS MARKET FOR PRESSURE AND FORCE SENSORS, BY COUNTRY 2024 AND 2034(%)
FIGURE 17. COMPARATIVE SHARE ANALYSIS OF WEARABLE SENSORS MARKET FOR TOUCH SENSORS, BY COUNTRY 2024 AND 2034(%)
FIGURE 18. COMPARATIVE SHARE ANALYSIS OF WEARABLE SENSORS MARKET FOR OTHERS, BY COUNTRY 2024 AND 2034(%)
FIGURE 19. WEARABLE SENSORS MARKET, BY APPLICATION, 2024 AND 2034(%)
FIGURE 20. COMPARATIVE SHARE ANALYSIS OF WEARABLE SENSORS MARKET FOR WRISTWEAR, BY COUNTRY 2024 AND 2034(%)
FIGURE 21. COMPARATIVE SHARE ANALYSIS OF WEARABLE SENSORS MARKET FOR EYEWEAR, BY COUNTRY 2024 AND 2034(%)
FIGURE 22. COMPARATIVE SHARE ANALYSIS OF WEARABLE SENSORS MARKET FOR FOOTWEAR, BY COUNTRY 2024 AND 2034(%)
FIGURE 23. COMPARATIVE SHARE ANALYSIS OF WEARABLE SENSORS MARKET FOR NECKWEAR, BY COUNTRY 2024 AND 2034(%)
FIGURE 24. COMPARATIVE SHARE ANALYSIS OF WEARABLE SENSORS MARKET FOR BODYWEAR, BY COUNTRY 2024 AND 2034(%)
FIGURE 25. COMPARATIVE SHARE ANALYSIS OF WEARABLE SENSORS MARKET FOR OTHERS, BY COUNTRY 2024 AND 2034(%)
FIGURE 26. WEARABLE SENSORS MARKET, BY END USER, 2024 AND 2034(%)
FIGURE 27. COMPARATIVE SHARE ANALYSIS OF WEARABLE SENSORS MARKET FOR CONSUMER, BY COUNTRY 2024 AND 2034(%)
FIGURE 28. COMPARATIVE SHARE ANALYSIS OF WEARABLE SENSORS MARKET FOR HEALTHCARE, BY COUNTRY 2024 AND 2034(%)
FIGURE 29. COMPARATIVE SHARE ANALYSIS OF WEARABLE SENSORS MARKET FOR INDUSTRIAL, BY COUNTRY 2024 AND 2034(%)
FIGURE 30. COMPARATIVE SHARE ANALYSIS OF WEARABLE SENSORS MARKET FOR OTHERS, BY COUNTRY 2024 AND 2034(%)
FIGURE 31. WEARABLE SENSORS MARKET BY REGION, 2024 AND 2034(%)
FIGURE 32. U.S. WEARABLE SENSORS MARKET, 2024-2034 ($MILLION)
FIGURE 33. CANADA WEARABLE SENSORS MARKET, 2024-2034 ($MILLION)
FIGURE 34. MEXICO WEARABLE SENSORS MARKET, 2024-2034 ($MILLION)
FIGURE 35. UK WEARABLE SENSORS MARKET, 2024-2034 ($MILLION)
FIGURE 36. GERMANY WEARABLE SENSORS MARKET, 2024-2034 ($MILLION)
FIGURE 37. FRANCE WEARABLE SENSORS MARKET, 2024-2034 ($MILLION)
FIGURE 38. ITALY WEARABLE SENSORS MARKET, 2024-2034 ($MILLION)
FIGURE 39. REST OF EUROPE WEARABLE SENSORS MARKET, 2024-2034 ($MILLION)
FIGURE 40. CHINA WEARABLE SENSORS MARKET, 2024-2034 ($MILLION)
FIGURE 41. JAPAN WEARABLE SENSORS MARKET, 2024-2034 ($MILLION)
FIGURE 42. INDIA WEARABLE SENSORS MARKET, 2024-2034 ($MILLION)
FIGURE 43. SOUTH KOREA WEARABLE SENSORS MARKET, 2024-2034 ($MILLION)
FIGURE 44. REST OF ASIA-PACIFIC WEARABLE SENSORS MARKET, 2024-2034 ($MILLION)
FIGURE 45. LATIN AMERICA WEARABLE SENSORS MARKET, 2024-2034 ($MILLION)
FIGURE 46. MIDDLE EAST WEARABLE SENSORS MARKET, 2024-2034 ($MILLION)
FIGURE 47. AFRICA WEARABLE SENSORS MARKET, 2024-2034 ($MILLION)
FIGURE 48. TOP WINNING STRATEGIES, BY YEAR (2023-2023)
FIGURE 49. TOP WINNING STRATEGIES, BY DEVELOPMENT (2023-2023)
FIGURE 50. TOP WINNING STRATEGIES, BY COMPANY (2023-2023)
FIGURE 51. PRODUCT MAPPING OF TOP 10 PLAYERS
FIGURE 52. COMPETITIVE DASHBOARD
FIGURE 53. COMPETITIVE HEATMAP: WEARABLE SENSORS MARKET
FIGURE 54. TOP PLAYER POSITIONING, 2024
FIGURE 55. INFINEON TECHNOLOGIES AG: NET REVENUE, 2022-2024 ($MILLION)
FIGURE 56. INFINEON TECHNOLOGIES AG: RESEARCH & DEVELOPMENT EXPENDITURE, 2022-2024 ($MILLION)
FIGURE 57. INFINEON TECHNOLOGIES AG: REVENUE SHARE BY SEGMENT, 2024 (%)
FIGURE 58. INFINEON TECHNOLOGIES AG: REVENUE SHARE BY REGION, 2024 (%)
FIGURE 59. MURATA MANUFACTURING CO., LTD.: NET REVENUE, 2022-2024 ($MILLION)
FIGURE 60. MURATA MANUFACTURING CO., LTD.: REVENUE SHARE BY SEGMENT, 2024 (%)
FIGURE 61. MURATA MANUFACTURING CO., LTD.: REVENUE SHARE BY REGION, 2024 (%)
FIGURE 62. STMICROELECTRONICS N.V.: NET REVENUE, 2022-2024 ($MILLION)
FIGURE 63. STMICROELECTRONICS N.V.: RESEARCH & DEVELOPMENT EXPENDITURE, 2022-2024 ($MILLION)
FIGURE 64. STMICROELECTRONICS N.V.: REVENUE SHARE BY SEGMENT, 2024 (%)
FIGURE 65. STMICROELECTRONICS N.V.: REVENUE SHARE BY REGION, 2022 (%)
FIGURE 66. PANASONIC CORPORATION: NET SALES, 2022-2024 ($MILLION)
FIGURE 67. PANASONIC CORPORATION: REVENUE SHARE BY SEGMENT, 2024 (%)
FIGURE 68. PANASONIC CORPORATION: REVENUE SHARE BY REGION, 2024 (%)
FIGURE 69. KNOWLES ELECTRONICS, LLC: NET REVENUE, 2022-2024 ($MILLION)
FIGURE 70. KNOWLES ELECTRONICS, LLC: RESEARCH & DEVELOPMENT EXPENDITURE, 2022-2024 ($MILLION)
FIGURE 71. KNOWLES ELECTRONICS, LLC: REVENUE SHARE BY SEGMENT, 2024 (%)
FIGURE 72. KNOWLES ELECTRONICS, LLC: REVENUE SHARE BY REGION, 2024 (%)
FIGURE 73. NXP SEMICONDUCTORS: NET REVENUE, 2022-2024 ($MILLION)
FIGURE 74. NXP SEMICONDUCTORS: RESEARCH & DEVELOPMENT EXPENDITURE, 2022-2024 ($MILLION)
FIGURE 75. NXP SEMICONDUCTORS: REVENUE SHARE BY SEGMENT, 2024 (%)
FIGURE 76. NXP SEMICONDUCTORS: REVENUE SHARE BY REGION, 2024 (%)
FIGURE 77. TE CONNECTIVITY: NET SALES, 2022-2024 ($MILLION)
FIGURE 78. TE CONNECTIVITY: RESEARCH & DEVELOPMENT EXPENDITURE, 2022-2024 ($MILLION)
FIGURE 79. TE CONNECTIVITY: REVENUE SHARE BY REGION, 2024 (%)
FIGURE 80. TE CONNECTIVITY: REVENUE SHARE BY SEGMENT, 2024 (%)
FIGURE 81. ROHM SEMICONDUCTOR: NET REVENUE, 2022-2024 ($MILLION)
FIGURE 82. ROHM SEMICONDUCTOR: REVENUE SHARE BY SEGMENT, 2024 (%)
FIGURE 83. ROHM SEMICONDUCTOR: REVENUE SHARE BY REGION, 2024 (%)
FIGURE 84. ANALOG DEVICES, INC.: NET REVENUE, 2022-2024 ($MILLION)
FIGURE 85. ANALOG DEVICES, INC.: RESEARCH & DEVELOPMENT EXPENDITURE, 2022-2024 ($MILLION)
FIGURE 86. ANALOG DEVICES, INC.: REVENUE SHARE BY REGION, 2024 (%)
FIGURE 87. ANALOG DEVICES, INC.: REVENUE SHARE BY SEGMENT, 2024 (%)