Solar Fuel Market By Type (Hydrogen, Ammonia, Others), By Application (Power Generation, Transportation, Others): Global Opportunity Analysis and Industry Forecast, 2023 - 2033
太陽燃料市場 - タイプ別(水素、アンモニア、その他)、用途別(発電、輸送、その他):機会分析と業界予測、2023 - 2033年
| 出版 | Allied Market Research |
| 出版年月 | 2024年04月 |
| ページ数 | 290 |
| 価格 | 記載以外のライセンスについてはお問合せください |
| シングルユーザ | USD 5,730 |
| 種別 | 英文調査報告書 |
| 商品番号 | SMR-14058 |

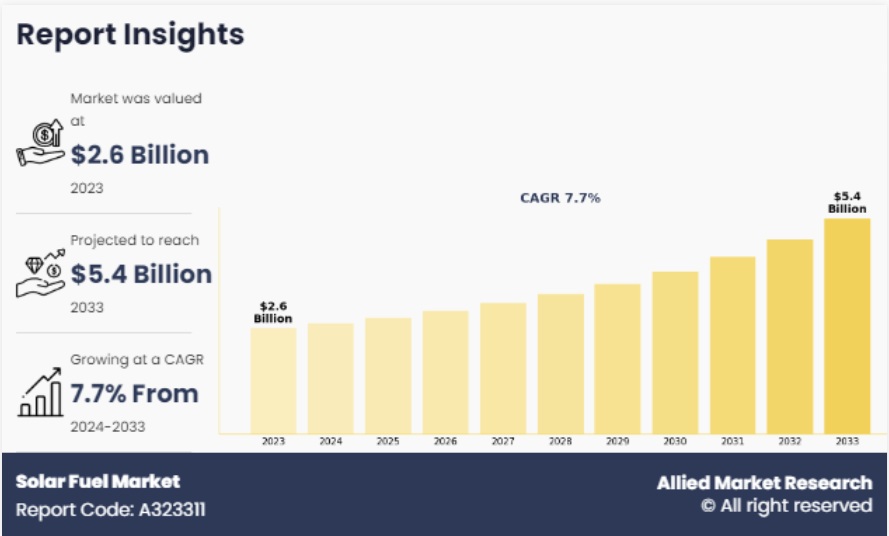
世界の太陽燃料市場は2023年に26億ドルと評価され、2024年から2033年にかけて年平均成長率7.7%で成長し、2033年までに54億ドルに達すると予測されています。
太陽燃料市場の親市場は、より広範な再生可能エネルギー市場です。この包括的なカテゴリーは、環境への影響を最小限に抑え、有限な化石燃料資源への依存を低減する方法でエネルギーを生産するために設計された、様々なエネルギー源と技術を網羅しています。再生可能エネルギーには、一般的に太陽光発電、風力発電、水力発電、バイオマス発電、地熱エネルギーが含まれます。この広範な枠組みの中で、太陽燃料市場は、太陽光を利用したプロセスによる化学燃料の生産に特化しています。
Report Description
The global solar fuel market was valued at $2.6 billion in 2023, and is projected to reach $5.4 billion by 2033, growing at a CAGR of 7.7% from 2024 to 2033.
Parent Market Overview
The parent market for the solar fuels market is the broader renewable energy market. This overarching category encompasses various sources and technologies designed to produce energy in ways that minimize environmental impact and reduce reliance on finite fossil fuel resources. Renewable energy typically includes solar power, wind energy, hydroelectric power, biomass, and geothermal energy. Within this larger framework, the solar fuels market specifically focuses on producing chemical fuels through solar-driven processes.
Introduction
The solar fuels market represents an innovative and promising segment within the broader renewable energy landscape, focusing on the conversion of solar energy into chemical fuels. Solar fuels, such as hydrogen produced through photoelectrochemical and solar thermochemical processes, harness sunlight to split water or reduce carbon dioxide, thereby creating a sustainable fuel source that mimics natural photosynthesis but with higher efficiency and potentially on a much larger scale.
Market Dynamics
Escalating greenhouse gas emissions is a significant driving force for the development of the solar fuels market, primarily due to their role in advancing carbon-neutral energy solutions and mitigating climate change. By converting solar energy into chemical fuels, solar fuels such as green hydrogen can help reduce reliance on fossil fuels, which are major contributors to global emissions. This shift is crucial in sectors that are challenging to electrify, such as heavy industry and transportation. Moreover, solar fuels enhance the integration of renewable energy by providing a method for storing and transporting energy, which is vital for maintaining grid stability and ensuring a continuous energy supply when solar power is not directly available. As global awareness and regulatory pressures regarding climate change increase, the demand for innovative and sustainable energy solutions like solar fuels continues to grow, positioning them as a key component in the global strategy to achieve a low-carbon future.
Competition from other renewable energy sources presents a significant restraining factor for the growth of the solar fuels market. Solar energy must contend with established and rapidly growing sectors like wind, hydroelectric, and traditional photovoltaic solar power, all of which are cost-effective and supported by robust technological advancements and infrastructural developments. These alternatives often offer more immediate scalability and cost efficiency due to longer-standing investments and integration into energy systems. For example, wind and solar PV technologies have seen significant reductions in costs and improvements in efficiency, making them preferred choices for immediate renewable energy deployment. Furthermore, energy storage technologies, such as batteries, have become more viable, challenging the need for solar fuels as a storage solution. This intense competition for market share and investment can limit the attention and resources available for developing and commercializing solar fuels, potentially slowing their adoption despite their benefits for long-term energy storage and versatility in applications beyond electricity generation.
The expansion of solar fuel infrastructure represents a significant opportunity for the solar fuels market. Developing infrastructure such as production facilities, storage systems, and distribution networks is crucial for facilitating the large-scale adoption and utilization of solar fuels. As these infrastructures expand, they enable the efficient conversion, storage, and transportation of solar energy in chemical form, thereby overcoming one of the major challenges associated with renewable energy intermittency. Efficient infrastructure supports continuous energy availability, making solar fuels more competitive and accessible. Moreover, as infrastructure develops, it drives down costs through economies of scale and technological improvements, enhancing market penetration and attractiveness. In addition, expanded infrastructure can foster regional economic development, create jobs, and stimulate investment in renewable technologies. All of these factors contribute to a robust market environment conducive to growth and innovation in the solar fuels sector.
Patent Analysis
From 2015 to 2024, patent activity in the solar fuels market exhibited notable trends and patterns across various countries and publication dates. The U.S. emerged as the leading innovator in solar fuels technology, with a total of 170 patents filed during the period, showcasing its commitment to advancing renewable energy solutions. India and China followed closely behind, with 113 and 110 patents respectively, reflecting the growing importance of solar fuels in emerging economies. The Patent Cooperation Treaty (PCT) and the European Patent Office (EPO) also contributed significantly to global patent filings, with 107 and 37 patents respectively. Among other countries, Australia, Canada, and the UK demonstrated notable activity in solar fuel innovation.
Examining publication dates provides insights into the evolution of solar fuel technology over the past decade. Patent filings steadily increased from 2015 to 2019, reaching a peak of 41 filings in 2019, indicating growing interest and investment in the sector. However, there was a slight decline in filings in 2020 and 2021, possibly influenced by external factors such as economic conditions or regulatory uncertainties. The trend resumed an upward trajectory in 2022 and 2023, with 31 and 39 filings respectively, suggesting renewed momentum in solar fuels innovation.
The patent analysis highlights the dynamic nature of the solar fuels market, with ongoing innovation and investment driving advancements in renewable energy technology. The abovementioned data emphasizes the importance of the global interest in solar fuels as a promising solution for sustainable energy generation, with countries across the world actively contributing to its development and commercialization.
Segment Overview
The solar fuel market is segmented into type, application, and region. On the basis of type, the market is divided into hydrogen, hydrazine, ammonia, and others. On the basis of application, the market is bifurcated into transportation, power generation, and others. On the basis of region, the solar fuel market is analyzed across North America, Europe, Asia-Pacific, and LAMEA.
On the basis of type, hydrogen segment dominates the solar fuel market. Hydrogen stands out as a versatile and clean option for energy storage and as fuel for transportation and industrial uses. Hydrazine is less common and primarily used as a rocket propellant and in specific industrial contexts, noted for its high energy density but toxicity and complex handling requirements. Ammonia is highlighted for its ease of liquefaction and transportation, serving directly as a fuel or as an intermediary for hydrogen production. The others category encompasses additional fuels such as methanol or synthetic hydrocarbons, which are explored for specialized applications and market niches, offering unique solutions across various sectors.
On the basis of application, the transportation segment dominates the market. In transportation, solar fuels offer a renewable alternative to fossil fuels, with potential applications in cars, ships, and airplanes. Power generation uses solar fuels to produce electricity, especially valuable in settings where direct solar power usage is impractical, thus ensuring a continuous energy supply. The others category covers diverse industrial applications, ranging from chemical synthesis to heating solutions and serving as raw materials in various manufacturing processes, underscoring the adaptability and wide utility of solar fuels.
Regionally, the solar fuel market presents unique opportunities and challenges based on its technological adoption, regulatory environment, and specific market drivers. For instance, Europe may focus more on integrating solar fuels with its extensive renewable energy grid, while the Asia-Pacific region prioritizes addressing the demands of rapid industrial growth and urbanization. North America exploits technological innovations and robust policy frameworks to advance market penetration, whereas LAMEA looks to capitalize on abundant natural resources and tailor solutions to meet specific regional energy requirements.
The major players operating in the solar fuels market include Green Hydrogen Systems, Air Liquide, Adani Green Energy Ltd, Royal Dutch Shell, Plug Power Inc., GAIL (India) Limited, Ballard Power Systems, NTPC Limited, Reliance Industries, and Linde Plc.
Solar Fuel Market Report Highlights
| Aspects | Details |
|
Market Size By 2033
|
USD 5.4 billion |
|
Growth Rate
|
CAGR of 7.7% |
|
Forecast period
|
2023 – 2033 |
|
Report Pages
|
290 |
|
By Type
|
|
|
By Application
|
|
|
By Region
|
|
|
Key Market Players
|
Ballard Power Systems, Linde Plc., Reliance Industries, Plug Power Inc.,, NTPC LIMITED, Royal Dutch Shell PLC, Air Liquide, Green Hydrogen Systems, GAIL (India) Limited, Adani Green Energy Ltd |
Key Benefits For Stakeholders
- This report provides a quantitative analysis of the market segments, current trends, estimations, and dynamics of the solar fuel market analysis from 2023 to 2033 to identify the prevailing solar fuel market opportunities.
- The market research is offered along with information related to key drivers, restraints, and opportunities.
- Porter’s five forces analysis highlights the potency of buyers and suppliers to enable stakeholders make profit-oriented business decisions and strengthen their supplier-buyer network.
- In-depth analysis of the solar fuel market segmentation assists to determine the prevailing market opportunities.
- Major countries in each region are mapped according to their revenue contribution to the global market.
- Market player positioning facilitates benchmarking and provides a clear understanding of the present position of the market players.
- The report includes the analysis of the regional as well as global solar fuel market trends, key players, market segments, application areas, and market growth strategies.
Table of Content
CHAPTER 1: INTRODUCTION
1.1. Report description
1.2. Key market segments
1.3. Key benefits to the stakeholders
1.4. Research methodology
1.4.1. Primary research
1.4.2. Secondary research
1.4.3. Analyst tools and models
CHAPTER 2: EXECUTIVE SUMMARY
2.1. CXO perspective
CHAPTER 3: MARKET OVERVIEW
3.1. Market definition and scope
3.2. Key findings
3.2.1. Top impacting factors
3.2.2. Top investment pockets
3.3. Porter s five forces analysis
3.3.1. Low bargaining power of suppliers
3.3.2. Moderate threat of new entrants
3.3.3. Low threat of substitutes
3.3.4. Moderate intensity of rivalry
3.3.5. Moderate bargaining power of buyers
3.4. Market dynamics
3.4.1. Drivers
3.4.1.1. Growing Global Decarbonization and Net-Zero Targets
3.4.1.2. Abundant Solar Resources and Falling Renewable Energy Costs
3.4.1.3. Rising Demand from Power, Transport, and Industrial Sectors
3.4.2. Restraints
3.4.2.1. High Production and Infrastructure Costs
3.4.2.2. Technology Maturity and Efficiency Limitations
3.4.3. Opportunities
3.4.3.1. Expansion of Green Hydrogen and Export-Oriented Solar Fuel Projects
CHAPTER 4: SOLAR FUEL MARKET, BY TYPE
4.1. Overview
4.1.1. Market size and forecast
4.2. Hydrogen
4.2.1. Key market trends, growth factors and opportunities
4.2.2. Market size and forecast, by region
4.2.3. Market share analysis by country
4.3. Ammonia
4.3.1. Key market trends, growth factors and opportunities
4.3.2. Market size and forecast, by region
4.3.3. Market share analysis by country
4.4. Others
4.4.1. Key market trends, growth factors and opportunities
4.4.2. Market size and forecast, by region
4.4.3. Market share analysis by country
CHAPTER 5: SOLAR FUEL MARKET, BY APPLICATION
5.1. Overview
5.1.1. Market size and forecast
5.2. Power Generation
5.2.1. Key market trends, growth factors and opportunities
5.2.2. Market size and forecast, by region
5.2.3. Market share analysis by country
5.3. Transportation
5.3.1. Key market trends, growth factors and opportunities
5.3.2. Market size and forecast, by region
5.3.3. Market share analysis by country
5.4. Others
5.4.1. Key market trends, growth factors and opportunities
5.4.2. Market size and forecast, by region
5.4.3. Market share analysis by country
CHAPTER 6: SOLAR FUEL MARKET, BY REGION
6.1. Overview
6.1.1. Market size and forecast By Region
6.2. North America
6.2.1. Key market trends, growth factors and opportunities
6.2.2. Market size and forecast, by Type
6.2.3. Market size and forecast, by Application
6.2.4. Market size and forecast, by country
6.2.4.1. U.S.
6.2.4.1.1. Market size and forecast, by Type
6.2.4.1.2. Market size and forecast, by Application
6.2.4.2. Canada
6.2.4.2.1. Market size and forecast, by Type
6.2.4.2.2. Market size and forecast, by Application
6.2.4.3. Mexico
6.2.4.3.1. Market size and forecast, by Type
6.2.4.3.2. Market size and forecast, by Application
6.3. Europe
6.3.1. Key market trends, growth factors and opportunities
6.3.2. Market size and forecast, by Type
6.3.3. Market size and forecast, by Application
6.3.4. Market size and forecast, by country
6.3.4.1. Germany
6.3.4.1.1. Market size and forecast, by Type
6.3.4.1.2. Market size and forecast, by Application
6.3.4.2. Spain
6.3.4.2.1. Market size and forecast, by Type
6.3.4.2.2. Market size and forecast, by Application
6.3.4.3. France
6.3.4.3.1. Market size and forecast, by Type
6.3.4.3.2. Market size and forecast, by Application
6.3.4.4. UK
6.3.4.4.1. Market size and forecast, by Type
6.3.4.4.2. Market size and forecast, by Application
6.3.4.5. Rest of Europe
6.3.4.5.1. Market size and forecast, by Type
6.3.4.5.2. Market size and forecast, by Application
6.4. Asia-Pacific
6.4.1. Key market trends, growth factors and opportunities
6.4.2. Market size and forecast, by Type
6.4.3. Market size and forecast, by Application
6.4.4. Market size and forecast, by country
6.4.4.1. China
6.4.4.1.1. Market size and forecast, by Type
6.4.4.1.2. Market size and forecast, by Application
6.4.4.2. Japan
6.4.4.2.1. Market size and forecast, by Type
6.4.4.2.2. Market size and forecast, by Application
6.4.4.3. India
6.4.4.3.1. Market size and forecast, by Type
6.4.4.3.2. Market size and forecast, by Application
6.4.4.4. South Korea
6.4.4.4.1. Market size and forecast, by Type
6.4.4.4.2. Market size and forecast, by Application
6.4.4.5. Rest of Asia-Pacific
6.4.4.5.1. Market size and forecast, by Type
6.4.4.5.2. Market size and forecast, by Application
6.5. LAMEA
6.5.1. Key market trends, growth factors and opportunities
6.5.2. Market size and forecast, by Type
6.5.3. Market size and forecast, by Application
6.5.4. Market size and forecast, by country
6.5.4.1. Brazil
6.5.4.1.1. Market size and forecast, by Type
6.5.4.1.2. Market size and forecast, by Application
6.5.4.2. South Africa,
6.5.4.2.1. Market size and forecast, by Type
6.5.4.2.2. Market size and forecast, by Application
6.5.4.3. Saudi Arabia
6.5.4.3.1. Market size and forecast, by Type
6.5.4.3.2. Market size and forecast, by Application
6.5.4.4. Rest of LAMEA
6.5.4.4.1. Market size and forecast, by Type
6.5.4.4.2. Market size and forecast, by Application
CHAPTER 7: COMPETITIVE LANDSCAPE
7.1. Introduction
7.2. Top winning strategies
7.3. Product mapping of top 10 player
7.4. Competitive dashboard
7.5. Competitive heatmap
7.6. Top player positioning, 2023
CHAPTER 8: COMPANY PROFILES
8.1. Green Hydrogen Systems
8.1.1. Company overview
8.1.2. Key executives
8.1.3. Company snapshot
8.1.4. Operating business segments
8.1.5. Product portfolio
8.1.6. Business performance
8.1.7. Key strategic moves and developments
8.2. Air Liquide
8.2.1. Company overview
8.2.2. Key executives
8.2.3. Company snapshot
8.2.4. Operating business segments
8.2.5. Product portfolio
8.2.6. Business performance
8.2.7. Key strategic moves and developments
8.3. Adani Green Energy Ltd
8.3.1. Company overview
8.3.2. Key executives
8.3.3. Company snapshot
8.3.4. Operating business segments
8.3.5. Product portfolio
8.3.6. Business performance
8.3.7. Key strategic moves and developments
8.4. GAIL (India) Limited
8.4.1. Company overview
8.4.2. Key executives
8.4.3. Company snapshot
8.4.4. Operating business segments
8.4.5. Product portfolio
8.4.6. Business performance
8.4.7. Key strategic moves and developments
8.5. Ballard Power Systems
8.5.1. Company overview
8.5.2. Key executives
8.5.3. Company snapshot
8.5.4. Operating business segments
8.5.5. Product portfolio
8.5.6. Business performance
8.5.7. Key strategic moves and developments
8.6. NTPC LIMITED
8.6.1. Company overview
8.6.2. Key executives
8.6.3. Company snapshot
8.6.4. Operating business segments
8.6.5. Product portfolio
8.6.6. Business performance
8.6.7. Key strategic moves and developments
8.7. Linde Plc.
8.7.1. Company overview
8.7.2. Key executives
8.7.3. Company snapshot
8.7.4. Operating business segments
8.7.5. Product portfolio
8.7.6. Business performance
8.7.7. Key strategic moves and developments
8.8. Shell plc
8.8.1. Company overview
8.8.2. Key executives
8.8.3. Company snapshot
8.8.4. Operating business segments
8.8.5. Product portfolio
8.8.6. Business performance
8.8.7. Key strategic moves and developments
8.9. PLUG POWER INC.
8.9.1. Company overview
8.9.2. Key executives
8.9.3. Company snapshot
8.9.4. Operating business segments
8.9.5. Product portfolio
8.9.6. Business performance
8.9.7. Key strategic moves and developments
8.10. Reliance Industries Limited
8.10.1. Company overview
8.10.2. Key executives
8.10.3. Company snapshot
8.10.4. Operating business segments
8.10.5. Product portfolio
8.10.6. Business performance
8.10.7. Key strategic moves and developments
LIST OF TABLES
TABLE 01. GLOBAL SOLAR FUEL MARKET, BY TYPE, 2023-2033 ($MILLION)
TABLE 02. SOLAR FUEL MARKET FOR HYDROGEN, BY REGION, 2023-2033 ($MILLION)
TABLE 03. SOLAR FUEL MARKET FOR AMMONIA, BY REGION, 2023-2033 ($MILLION)
TABLE 04. SOLAR FUEL MARKET FOR OTHERS, BY REGION, 2023-2033 ($MILLION)
TABLE 05. GLOBAL SOLAR FUEL MARKET, BY APPLICATION, 2023-2033 ($MILLION)
TABLE 06. SOLAR FUEL MARKET FOR POWER GENERATION, BY REGION, 2023-2033 ($MILLION)
TABLE 07. SOLAR FUEL MARKET FOR TRANSPORTATION, BY REGION, 2023-2033 ($MILLION)
TABLE 08. SOLAR FUEL MARKET FOR OTHERS, BY REGION, 2023-2033 ($MILLION)
TABLE 09. SOLAR FUEL MARKET, BY REGION, 2023-2033 ($MILLION)
TABLE 10. NORTH AMERICA SOLAR FUEL MARKET, BY TYPE, 2023-2033 ($MILLION)
TABLE 11. NORTH AMERICA SOLAR FUEL MARKET, BY APPLICATION, 2023-2033 ($MILLION)
TABLE 12. NORTH AMERICA SOLAR FUEL MARKET, BY COUNTRY, 2023-2033 ($MILLION)
TABLE 13. U.S. SOLAR FUEL MARKET, BY TYPE, 2023-2033 ($MILLION)
TABLE 14. U.S. SOLAR FUEL MARKET, BY APPLICATION, 2023-2033 ($MILLION)
TABLE 15. CANADA SOLAR FUEL MARKET, BY TYPE, 2023-2033 ($MILLION)
TABLE 16. CANADA SOLAR FUEL MARKET, BY APPLICATION, 2023-2033 ($MILLION)
TABLE 17. MEXICO SOLAR FUEL MARKET, BY TYPE, 2023-2033 ($MILLION)
TABLE 18. MEXICO SOLAR FUEL MARKET, BY APPLICATION, 2023-2033 ($MILLION)
TABLE 19. EUROPE SOLAR FUEL MARKET, BY TYPE, 2023-2033 ($MILLION)
TABLE 20. EUROPE SOLAR FUEL MARKET, BY APPLICATION, 2023-2033 ($MILLION)
TABLE 21. EUROPE SOLAR FUEL MARKET, BY COUNTRY, 2023-2033 ($MILLION)
TABLE 22. GERMANY SOLAR FUEL MARKET, BY TYPE, 2023-2033 ($MILLION)
TABLE 23. GERMANY SOLAR FUEL MARKET, BY APPLICATION, 2023-2033 ($MILLION)
TABLE 24. SPAIN SOLAR FUEL MARKET, BY TYPE, 2023-2033 ($MILLION)
TABLE 25. SPAIN SOLAR FUEL MARKET, BY APPLICATION, 2023-2033 ($MILLION)
TABLE 26. FRANCE SOLAR FUEL MARKET, BY TYPE, 2023-2033 ($MILLION)
TABLE 27. FRANCE SOLAR FUEL MARKET, BY APPLICATION, 2023-2033 ($MILLION)
TABLE 28. UK SOLAR FUEL MARKET, BY TYPE, 2023-2033 ($MILLION)
TABLE 29. UK SOLAR FUEL MARKET, BY APPLICATION, 2023-2033 ($MILLION)
TABLE 30. REST OF EUROPE SOLAR FUEL MARKET, BY TYPE, 2023-2033 ($MILLION)
TABLE 31. REST OF EUROPE SOLAR FUEL MARKET, BY APPLICATION, 2023-2033 ($MILLION)
TABLE 32. ASIA-PACIFIC SOLAR FUEL MARKET, BY TYPE, 2023-2033 ($MILLION)
TABLE 33. ASIA-PACIFIC SOLAR FUEL MARKET, BY APPLICATION, 2023-2033 ($MILLION)
TABLE 34. ASIA-PACIFIC SOLAR FUEL MARKET, BY COUNTRY, 2023-2033 ($MILLION)
TABLE 35. CHINA SOLAR FUEL MARKET, BY TYPE, 2023-2033 ($MILLION)
TABLE 36. CHINA SOLAR FUEL MARKET, BY APPLICATION, 2023-2033 ($MILLION)
TABLE 37. JAPAN SOLAR FUEL MARKET, BY TYPE, 2023-2033 ($MILLION)
TABLE 38. JAPAN SOLAR FUEL MARKET, BY APPLICATION, 2023-2033 ($MILLION)
TABLE 39. INDIA SOLAR FUEL MARKET, BY TYPE, 2023-2033 ($MILLION)
TABLE 40. INDIA SOLAR FUEL MARKET, BY APPLICATION, 2023-2033 ($MILLION)
TABLE 41. SOUTH KOREA SOLAR FUEL MARKET, BY TYPE, 2023-2033 ($MILLION)
TABLE 42. SOUTH KOREA SOLAR FUEL MARKET, BY APPLICATION, 2023-2033 ($MILLION)
TABLE 43. REST OF ASIA-PACIFIC SOLAR FUEL MARKET, BY TYPE, 2023-2033 ($MILLION)
TABLE 44. REST OF ASIA-PACIFIC SOLAR FUEL MARKET, BY APPLICATION, 2023-2033 ($MILLION)
TABLE 45. LAMEA SOLAR FUEL MARKET, BY TYPE, 2023-2033 ($MILLION)
TABLE 46. LAMEA SOLAR FUEL MARKET, BY APPLICATION, 2023-2033 ($MILLION)
TABLE 47. LAMEA SOLAR FUEL MARKET, BY COUNTRY, 2023-2033 ($MILLION)
TABLE 48. BRAZIL SOLAR FUEL MARKET, BY TYPE, 2023-2033 ($MILLION)
TABLE 49. BRAZIL SOLAR FUEL MARKET, BY APPLICATION, 2023-2033 ($MILLION)
TABLE 50. SOUTH AFRICA, SOLAR FUEL MARKET, BY TYPE, 2023-2033 ($MILLION)
TABLE 51. SOUTH AFRICA, SOLAR FUEL MARKET, BY APPLICATION, 2023-2033 ($MILLION)
TABLE 52. SAUDI ARABIA SOLAR FUEL MARKET, BY TYPE, 2023-2033 ($MILLION)
TABLE 53. SAUDI ARABIA SOLAR FUEL MARKET, BY APPLICATION, 2023-2033 ($MILLION)
TABLE 54. REST OF LAMEA SOLAR FUEL MARKET, BY TYPE, 2023-2033 ($MILLION)
TABLE 55. REST OF LAMEA SOLAR FUEL MARKET, BY APPLICATION, 2023-2033 ($MILLION)
TABLE 56. GREEN HYDROGEN SYSTEMS: KEY EXECUTIVES
TABLE 57. GREEN HYDROGEN SYSTEMS: COMPANY SNAPSHOT
TABLE 58. GREEN HYDROGEN SYSTEMS: PRODUCT SEGMENTS
TABLE 59. GREEN HYDROGEN SYSTEMS: SERVICE SEGMENTS
TABLE 60. GREEN HYDROGEN SYSTEMS: PRODUCT PORTFOLIO
TABLE 61. GREEN HYDROGEN SYSTEMS: KEY STRATERGIES
TABLE 62. AIR LIQUIDE: KEY EXECUTIVES
TABLE 63. AIR LIQUIDE: COMPANY SNAPSHOT
TABLE 64. AIR LIQUIDE: PRODUCT SEGMENTS
TABLE 65. AIR LIQUIDE: SERVICE SEGMENTS
TABLE 66. AIR LIQUIDE: PRODUCT PORTFOLIO
TABLE 67. AIR LIQUIDE: KEY STRATERGIES
TABLE 68. ADANI GREEN ENERGY LTD: KEY EXECUTIVES
TABLE 69. ADANI GREEN ENERGY LTD: COMPANY SNAPSHOT
TABLE 70. ADANI GREEN ENERGY LTD: PRODUCT SEGMENTS
TABLE 71. ADANI GREEN ENERGY LTD: SERVICE SEGMENTS
TABLE 72. ADANI GREEN ENERGY LTD: PRODUCT PORTFOLIO
TABLE 73. ADANI GREEN ENERGY LTD: KEY STRATERGIES
TABLE 74. GAIL (INDIA) LIMITED: KEY EXECUTIVES
TABLE 75. GAIL (INDIA) LIMITED: COMPANY SNAPSHOT
TABLE 76. GAIL (INDIA) LIMITED: PRODUCT SEGMENTS
TABLE 77. GAIL (INDIA) LIMITED: SERVICE SEGMENTS
TABLE 78. GAIL (INDIA) LIMITED: PRODUCT PORTFOLIO
TABLE 79. GAIL (INDIA) LIMITED: KEY STRATERGIES
TABLE 80. BALLARD POWER SYSTEMS: KEY EXECUTIVES
TABLE 81. BALLARD POWER SYSTEMS: COMPANY SNAPSHOT
TABLE 82. BALLARD POWER SYSTEMS: PRODUCT SEGMENTS
TABLE 83. BALLARD POWER SYSTEMS: SERVICE SEGMENTS
TABLE 84. BALLARD POWER SYSTEMS: PRODUCT PORTFOLIO
TABLE 85. BALLARD POWER SYSTEMS: KEY STRATERGIES
TABLE 86. NTPC LIMITED: KEY EXECUTIVES
TABLE 87. NTPC LIMITED: COMPANY SNAPSHOT
TABLE 88. NTPC LIMITED: PRODUCT SEGMENTS
TABLE 89. NTPC LIMITED: SERVICE SEGMENTS
TABLE 90. NTPC LIMITED: PRODUCT PORTFOLIO
TABLE 91. NTPC LIMITED: KEY STRATERGIES
TABLE 92. LINDE PLC.: KEY EXECUTIVES
TABLE 93. LINDE PLC.: COMPANY SNAPSHOT
TABLE 94. LINDE PLC.: PRODUCT SEGMENTS
TABLE 95. LINDE PLC.: SERVICE SEGMENTS
TABLE 96. LINDE PLC.: PRODUCT PORTFOLIO
TABLE 97. LINDE PLC.: KEY STRATERGIES
TABLE 98. SHELL PLC: KEY EXECUTIVES
TABLE 99. SHELL PLC: COMPANY SNAPSHOT
TABLE 100. SHELL PLC: PRODUCT SEGMENTS
TABLE 101. SHELL PLC: SERVICE SEGMENTS
TABLE 102. SHELL PLC: PRODUCT PORTFOLIO
TABLE 103. SHELL PLC: KEY STRATERGIES
TABLE 104. PLUG POWER INC.: KEY EXECUTIVES
TABLE 105. PLUG POWER INC.: COMPANY SNAPSHOT
TABLE 106. PLUG POWER INC.: PRODUCT SEGMENTS
TABLE 107. PLUG POWER INC.: SERVICE SEGMENTS
TABLE 108. PLUG POWER INC.: PRODUCT PORTFOLIO
TABLE 109. PLUG POWER INC.: KEY STRATERGIES
TABLE 110. RELIANCE INDUSTRIES LIMITED: KEY EXECUTIVES
TABLE 111. RELIANCE INDUSTRIES LIMITED: COMPANY SNAPSHOT
TABLE 112. RELIANCE INDUSTRIES LIMITED: PRODUCT SEGMENTS
TABLE 113. RELIANCE INDUSTRIES LIMITED: SERVICE SEGMENTS
TABLE 114. RELIANCE INDUSTRIES LIMITED: PRODUCT PORTFOLIO
TABLE 115. RELIANCE INDUSTRIES LIMITED: KEY STRATERGIES
LIST OF FIGURES
FIGURE 01. SOLAR FUEL MARKET, 2023-2033
FIGURE 02. SEGMENTATION OF SOLAR FUEL MARKET,2023-2033
FIGURE 03. TOP IMPACTING FACTORS IN SOLAR FUEL MARKET (2023 TO 2033)
FIGURE 04. TOP INVESTMENT POCKETS IN SOLAR FUEL MARKET (2024-2033)
FIGURE 05. LOW BARGAINING POWER OF SUPPLIERS
FIGURE 06. MODERATE THREAT OF NEW ENTRANTS
FIGURE 07. LOW THREAT OF SUBSTITUTES
FIGURE 08. MODERATE INTENSITY OF RIVALRY
FIGURE 09. MODERATE BARGAINING POWER OF BUYERS
FIGURE 10. GLOBAL SOLAR FUEL MARKET:DRIVERS, RESTRAINTS AND OPPORTUNITIES
FIGURE 11. SOLAR FUEL MARKET, BY TYPE, 2023 AND 2033(%)
FIGURE 12. COMPARATIVE SHARE ANALYSIS OF SOLAR FUEL MARKET FOR HYDROGEN, BY COUNTRY 2023 AND 2033(%)
FIGURE 13. COMPARATIVE SHARE ANALYSIS OF SOLAR FUEL MARKET FOR AMMONIA, BY COUNTRY 2023 AND 2033(%)
FIGURE 14. COMPARATIVE SHARE ANALYSIS OF SOLAR FUEL MARKET FOR OTHERS, BY COUNTRY 2023 AND 2033(%)
FIGURE 15. SOLAR FUEL MARKET, BY APPLICATION, 2023 AND 2033(%)
FIGURE 16. COMPARATIVE SHARE ANALYSIS OF SOLAR FUEL MARKET FOR POWER GENERATION, BY COUNTRY 2023 AND 2033(%)
FIGURE 17. COMPARATIVE SHARE ANALYSIS OF SOLAR FUEL MARKET FOR TRANSPORTATION, BY COUNTRY 2023 AND 2033(%)
FIGURE 18. COMPARATIVE SHARE ANALYSIS OF SOLAR FUEL MARKET FOR OTHERS, BY COUNTRY 2023 AND 2033(%)
FIGURE 19. SOLAR FUEL MARKET BY REGION, 2023 AND 2033(%)
FIGURE 20. U.S. SOLAR FUEL MARKET, 2023-2033 ($MILLION)
FIGURE 21. CANADA SOLAR FUEL MARKET, 2023-2033 ($MILLION)
FIGURE 22. MEXICO SOLAR FUEL MARKET, 2023-2033 ($MILLION)
FIGURE 23. GERMANY SOLAR FUEL MARKET, 2023-2033 ($MILLION)
FIGURE 24. SPAIN SOLAR FUEL MARKET, 2023-2033 ($MILLION)
FIGURE 25. FRANCE SOLAR FUEL MARKET, 2023-2033 ($MILLION)
FIGURE 26. UK SOLAR FUEL MARKET, 2023-2033 ($MILLION)
FIGURE 27. REST OF EUROPE SOLAR FUEL MARKET, 2023-2033 ($MILLION)
FIGURE 28. CHINA SOLAR FUEL MARKET, 2023-2033 ($MILLION)
FIGURE 29. JAPAN SOLAR FUEL MARKET, 2023-2033 ($MILLION)
FIGURE 30. INDIA SOLAR FUEL MARKET, 2023-2033 ($MILLION)
FIGURE 31. SOUTH KOREA SOLAR FUEL MARKET, 2023-2033 ($MILLION)
FIGURE 32. REST OF ASIA-PACIFIC SOLAR FUEL MARKET, 2023-2033 ($MILLION)
FIGURE 33. BRAZIL SOLAR FUEL MARKET, 2023-2033 ($MILLION)
FIGURE 34. SOUTH AFRICA, SOLAR FUEL MARKET, 2023-2033 ($MILLION)
FIGURE 35. SAUDI ARABIA SOLAR FUEL MARKET, 2023-2033 ($MILLION)
FIGURE 36. REST OF LAMEA SOLAR FUEL MARKET, 2023-2033 ($MILLION)
FIGURE 37. TOP WINNING STRATEGIES, BY YEAR
FIGURE 38. TOP WINNING STRATEGIES, BY DEVELOPMENT
FIGURE 39. TOP WINNING STRATEGIES, BY COMPANY
FIGURE 40. PRODUCT MAPPING OF TOP 10 PLAYERS
FIGURE 41. COMPETITIVE DASHBOARD
FIGURE 42. COMPETITIVE HEATMAP: SOLAR FUEL MARKET
FIGURE 43. TOP PLAYER POSITIONING, 2023