
Biomethane Market - Global Forecast To 2030
バイオメタン市場 - 原料(農業残渣、都市廃棄物、エネルギー作物)、生産プロセス(嫌気性消化・発酵、熱ガス化)、最終用途(発電、輸送、工業)、地域別 - 2030年までの世界予測
Biomethane Market by Feedstock (Agriculture Residue, Municipal Waste, Energy Crops), Production Process (Anaerobic Digestion & Fermentation, Thermal Gasification), End-use (Power generation, Transportation, Industrial), Region - Global Forecast to 2030
| 出版 | MarketsandMarkets |
| 出版年月 | 2026年01月 |
| ページ数 | 260 |
| 図表数 | 296 |
| 価格 | 記載以外のライセンスについてはお問合せください |
| シングルユーザ | USD 4,950 |
| 種別 | 英文調査報告書 |
| 商品番号 | SMR-12408 |

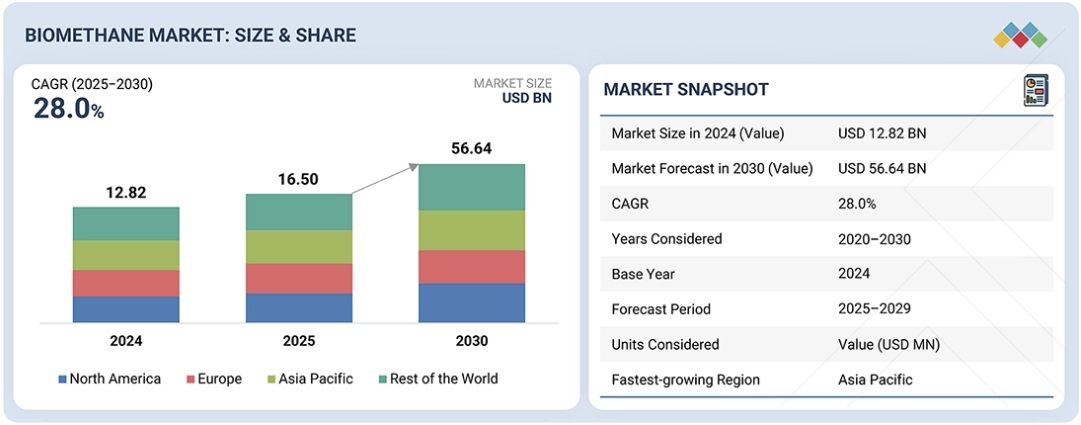
バイオメタン市場は、2025年の165億米ドルから2030年には566億4000万米ドルに達し、予測期間中の年平均成長率(CAGR)は28.0%と予測されています。バイオメタン市場は、有機廃棄物を価値のあるエネルギー資源に変換する循環型経済への関心の高まりによって推進されています。埋立地の制限強化と廃水処理規制の厳格化により、都市や工場は代替手段としてバイオメタンに注目しています。天然ガス価格の変動により、エネルギー消費者は国内の再生可能ガス市場を供給源として検討する必要が生じています。アップグレード、液化、デジタルプラント最適化技術の進歩は、既に運用効率と信頼性の向上につながっています。一方、再生可能ガスのガスグリッド相互接続と認証制度はますます増加しており、市場の透明性と取引可能性を高め、バイオメタンのより広範な商業利用を促進しています。
調査範囲:
本レポートでは、e-fuel市場を規模、用途、燃料の種類別に定義、解説、予測しています。また、市場の詳細な定性・定量分析も提供しています。主要な市場牽引要因、制約要因、機会、課題について包括的な分析を提供しています。さらに、市場の様々な重要な側面についても網羅しており、競争環境、市場ダイナミクス、市場規模予測、バイオメタン市場の将来動向など、様々な側面を網羅しています。
レポートを購入する主なメリット
- バイオガス市場は、特に化石ガスの使用を完全に排除することが難しい地域において、脱炭素化と環境に優しいエネルギーシステムへの世界的な移行の影響を大きく受けています。メタン排出への懸念の高まり、気候変動、そしてエネルギー安全保障を背景に、天然ガスに代わる再生可能で低炭素なガスとしてバイオメタンの利用が急速に進み、その導入がますます広がっています。バイオメタンは、農業残渣、動物の糞尿、都市ごみなど、様々な廃棄物から生成されており、発電だけでなく循環型経済の目標達成にも貢献しています。既存のガスインフラとの完全な互換性により、輸送、産業用暖房、発電、送電網への供給など、あらゆる分野で容易に利用できます。排出規制の強化やその他の関連政策により、バイオメタンプロジェクトへの投資はますます増加しています。同時に、嫌気性消化、ガス改質、デジタルプラント最適化といった技術の進歩は、プロセスの効率性と拡張性にプラスの影響を与えています。上記の要因に加え、企業の持続可能性への取り組みは、世界的な低炭素シナリオへのエネルギー転換を推進する大きな原動力となりつつあり、バイオメタンは徐々に重要な役割を担う存在として認識されつつあります。
- 製品開発/イノベーション:バイオメタン産業は、生産効率だけでなく、拡張性と環境性能の向上を目指す製品・プロセスイノベーションを通じて、飛躍的な発展を遂げています。この分野における最も重要な開発の一つは、企業によって開発が進められている新しい嫌気性消化システムです。これらのシステムは、メタン収率の向上、使用する原料の種類に対する柔軟性の向上、そして滞留時間の短縮を特徴としています。さらに、膜分離、圧力スイング吸着、極低温分解といったバイオガス精製技術は、バイオメタンの品質要件を満たし、それを上回る性能を実現しながら、エネルギーフットプリントを低減しています。市場動向としては、廃棄物発生源に近い場所で、大規模で集中型のインフラに代わる、小型で柔軟性の高いバイオメタンユニットの設置が促進され、時間とコストのかかる輸送が不要になるという点が挙げられます。自動化とデジタル監視システムの統合は既に導入されており、リアルタイムでのプロセス最適化、予測に基づくメンテナンス、排出量の追跡といったサポートを提供しています。
さらに、消化液管理、栄養塩回収、生物学的メタン生成の進歩も、資源効率の向上に貢献しています。共同消化や高度な廃棄物ストリームの利用に関する研究と実験は継続的に進められており、これにより原料の多様性が高まり、循環型および低炭素エネルギーシステムへのバイオメタンの役割が拡大しています。 - 市場展開:2025年9月、ハパグロイドとシェルバイオガスは、同社の脱炭素化プログラムを支援するため、液化バイオメタン供給に関する複数年契約を締結しました。2023年に開始された両社の提携により、ハパグロイドのLNG二元燃料船は、機器の改造を必要とせずに、環境に優しい船舶燃料を燃料として利用できるようになります。シェルはすでに世界22カ所の燃料補給拠点に液化バイオメタン供給拠点を設置しており、この再生可能燃料の入手性をさらに向上させています。ISCC EUなどの認証を受けたバイオガスは、ライフサイクル全体で温室効果ガス排出量を大幅に削減し、船舶の運航だけでなく、顧客のサプライチェーン全体における排出量削減にも貢献します。
- 市場の多様化:TotalEnergiesは2025年5月、ポーランドの主要バイオガス生産企業であるPolska Grupa Biogazowa(PGB)の株式の半分をHitecVisionに売却するSPA契約を締結しました。PGBはすでに20基のユニットを買収しており、そのバイオメタン生産能力は合計450GWhを超えており、2030年までに2TWhへの到達を目指しています。この提携は、PGBのバイオメタン事業への進出を加速させるだけでなく、TotalEnergiesの再生可能エネルギー投資ポートフォリオの改善に向けたファームダウン戦略にも合致するものです。一方、HitecVisionは、まだ発展段階にあるポーランドのバイオガス市場の成長を促進するための強固なプラットフォームを得る機会を捉えています。
- 競合評価:TotalEnergies(フランス)、Veolia(フランス)、Chevron Corporation(米国)、Shell Biogas(英国)、Air Liquide(フランス)、BP p.l.c.(英国)、Raízen(ブラジル)、Gasum Ltd(フィンランド)、Anaergia(カナダ)、EnviTec Biogas AG(ドイツ)、Kinder Morgan(米国)、Ameresco(米国)、ENGIE(フランス)、E.ON SE(ドイツ)、Verbio SE(ドイツ)、OPAL Fuels(米国)など、主要企業のランキング評価。
Report Description
The biomethane market is estimated to reach USD 56.64 billion by 2030 from USD 16.50 billion in 2025, at a CAGR of 28.0% during the forecast period. The biomethane market is being propelled by the rising focus on circular economy practices that transform organic waste into energy resources that are worth. The mounting limitations on landfills and more stringent regulations on wastewater treatment are leading cities and factories to biomethane as an alternative. Price swings in natural gas are making it necessary for energy consumers to explore the domestic renewable gas market as a supplier. Advances in upgrading, liquefaction, and digital plant optimization technologies are already leading to a better operational efficiency and reliability. Meanwhile, there are more and more gas grid interconnections and certification schemes for renewable gas that are making the market more transparent and tradable, thus facilitating the wider commercial use of biomethane.
Biomethane Market – Global Forecast To 2030
“By production process, thermal gasification is projected to be the fastest-growing segment of the biomethane market during the forecast period.”
The thermal gasification method, as a production process, is expected to occupy the fastest position among the biomethane segments during the coming years because of its capability to turn various kinds of dry and lignocellulosic feedstocks into renewable gas. The main difference from biological processes is that thermal gasification can easily process forestry residues, industrial waste, and other materials that are hard to digest, thus widening the overall biomethane feedstock base. The combination of increasing interest in advanced waste-to-energy systems and stricter regulations on landfilling is a major factor behind the rapid adoption of the technique. Innovations in technology are increasing the yield, quality of syngas, and interlinkage of the processes, thus minimizing risks to the operation. Moreover, the heightened investment in low-carbon fuels and the introduction of policy frameworks that favor advanced renewable gas technologies are improving the commercial viability of thermal gasification projects.
“The industrial segment is expected to remain the fastest segment by application”
The industrial segment is projected to be the largest application area in the biomethane market owing to the prevailing trend of the adoption of cost-effective decarbonization measures in the energy consuming industries. A number of industrial activities are very much dependent on natural gas for their operations that require high-temperature heating, thus making electrification either technically complicated or too expensive for the near future. Biomethane is a direct alternative that can be integrated easily and that helps the industrial sector to cut down their Scope 1 emissions without making any significant changes to existing machinery or facilities. Regulatory compliance, taxes on carbon emissions and compulsory emissions reporting are among the factors that have been speeding up the trend of biomethane usage. Apart from that, contracts for the long-term supply of biomethane have made it possible for industries to have a stable price during the ups and downs of the fossil fuel market, whereas the corporate net-zero pledges and sustainability targets are pushing the industries to consider renewable gas as a feasible option for decarbonization through which they could achieve their targets.
Biomethane Market – Global Forecast To 2030 – region
“By region, Europe is expected to be the second-largest region in the biomethane market during the forecast period.”
By region, the biomethane industry is forecasted to have Europe as the second-largest market, thanks to its developed renewable gas ecosystem and robust and favorable policies. Some European countries have already achieved advanced deployment of the technology but still, the expansion continues through replacement of old technology, upgrading of capacities, and integration of biomethane into the energy transition plans. European market is supported by a good natural gas supply system, well-defined sustainability certification process, and large-scale use in sectors such as industrial, and transportation. The collaboration between the power companies, big energy firms, and farmers’ cooperatives is still driving the market. Besides, Europe’s worry about nitrous oxide emissions, its goal to be less dependent on gas from outside, and its being more supportive of the recycling economy are also factors that put the region at the forefront when it comes to global biomethane demand and thus, Europe’s being a major player in the market despite it being a bit late in the game compared to the Asia-Pacific and other regions.
Breakdown of Primaries:
In-depth interviews have been conducted with various key industry participants, subject-matter experts, C-level executives of key market players, and industry consultants, among other experts, to obtain and verify critical qualitative and quantitative information and assess future market prospects. The distribution of primary interviews is as follows:
- By Company Type: Tier 1- 65%, Tier 2- 24%, and Tier 3- 11%
- By Designation: C-Level Executives – 30%, Managers- 25%, and Others- 45%
- By Region: North America- 20%, Europe- 40%, Asia Pacific- 30%, and RoW- 10%
Note: Others include product engineers, product specialists, and engineering leads.
Note: The tiers of the companies are defined based on their total revenues as of 2023. Tier 1: > USD 1 billion, Tier 2: From USD 500 million to USD 1 billion, and Tier 3: < USD 500 million
Biomethane Market – Global Forecast To 2030 – ecosystem
The biomethane market is dominated by a few major players that have a wide regional presence. The leading players in the biomethane market are Shell Biogas (United Kingdom), Air Liquide (France), BP p.l.c. (UK), Gasum Ltd (Finland), OPAL Fuels (US), Waga Energy (France), Vanguard Renewables (United States), Gothenburg Energy (Sweden), WELTEC BIOPOWER GmbH (Germany), PlanET Biogas Group (Germany), ETW Energietechnik GmbH (Germany), Clean Energy Fuels (United States), EQTEC PLC (Ireland), and GENeco (UK), among others.
Study Coverage:
The report defines, describes, and forecasts the e-fuel market by size, application, and fuel type. It also offers a detailed qualitative and quantitative analysis of the market. The report provides a comprehensive review of the major market drivers, restraints, opportunities, and challenges. It also covers various important aspects of the market. These include an analysis of the competitive landscape, market dynamics, market estimates in terms of value, and future trends in the biomethane market.
Key Benefits of Buying the Report
- The biogas market is mainly influenced by the global shift to decarbonized and eco-friendly energy systems, especially in areas where it is difficult to eliminate the use of fossil gas completely. The increasing worries about methane getting emitted, along with climate change, and energy security, are fast-tracking the biomethane usage as a renewable, low-carbon gas alternative to natural gas and hence, it is being adopted more and more. Biomethane is being generated from various waste streams including agricultural residues, animal dung, and municipal waste, thereby not only power generation and more but also being able to achieve the circular economy goals. Its complete compatibility with the existing gas infrastructure allows it to be used effortlessly in all the mentioned areas viz. transport, industrial heating, power generation, and grid injection. The stricter emission regulations and other related government policies, have led to a situation where investment in biomethane projects is becoming more and more common. At the same time, the advancements in the technologies used for anaerobic digestion, gas upgrading, and digital plant optimization are having a positive impact on the efficiency and scalability of the process. Alongside the above-mentioned factors, the corporate sustainability commitments are becoming a major driving force behind the global energy transition to a low carbon scenario, and thus, biomethane is gradually being identified as one of the key players.
- Product Development/Innovation: The biomethane industry is making strides through product and process innovations that aim to improve not only the efficiency of production but also the scalability and environmental performance. Among the most significant developments in this area are the new anaerobic digestion systems that are being created by companies. These systems are characterized by higher methane yields, greater flexibility in the types of feedstock used, and shorter retention times. Moreover, biogas upgrading technologies such as membrane separation, pressure swing adsorption, and cryogenic upgrading have all met and exceeded the quality requirements for biomethane and have done so with a lower energy footprint. The market trend is to promote the installation of small and flexible biomethane units that can take the place of big and centralized infrastructures as they come closer to waste sources and thus eliminate the long and costly transportation industry. Automation and digital monitoring system integration are already in place, providing support for the optimization of the process in real-time, maintenance based on predictions, and tracking of emissions. Furthermore, advances in digestate management, nutrient recovery, and biological methanation are also contributing to the increase in resource efficiency. Research and experimentation are continuously exploring co-digestion and the use of advanced waste streams, which are in fact increasing feedstock diversity and thus the contribution of biomethane to circular and low-carbon energy systems.
- Market Development: In September 2025, Hapag-Lloyd and Shell Biogas signed a multi-year deal for liquefied biomethane delivery to support the former’s decarbonization programme. The coalition between the two companies, which started in 2023, allows Hapag-Lloyd’s LNG dual-fuelled ships, to burn the eco-friendly marine fuel without the need for any modification of their machinery. Shell has already set up liquefied biomethane supply points at 22 bunkering places across the globe, thereby making the renewable fuel even more available. The biogas certified by ISCC EU and the like provides extensive lifecycle GHG reductions which enhance the reduction of emissions in not just fleet operations but also in customer supply chains.
- Market Diversification: TotalEnergies, in May 2025, made a deal through an SPA to divest half of the shares in Polska Grupa Biogazowa (PGB) which is the main biogas producer in Poland, to HitecVision. PGB has already acquired 20 units whose combined biomethane capacity amounts to more than 450 GWh and is also looking to reach 2 TWh by 2030. The alliance not just hastens PGB’s foray into biomethane but also goes hand in hand with TotalEnergies’ farmdown strategy to improve the renewable investment portfolio, while HitecVision seizes the opportunity of having a solid platform for driving growth in the biogas market in Poland which is still in the developing phase.
- Competitive Assessment: Assessment of rankings of some of the key players, including of TotalEnergies (France), Veolia (France), Chevron Corporation (United States), Shell Biogas (United Kingdom), Air Liquide (France), BP p.l.c. (United Kingdom), Raízen (Brazil), Gasum Ltd (Finland), Anaergia (Canada), EnviTec Biogas AG (Germany), Kinder Morgan (United States), Ameresco (United States), ENGIE (France), E.ON SE (Germany), Verbio SE (Germany), OPAL Fuels (United States) among others.
Table of Contents
1 INTRODUCTION 24
1.1 STUDY OBJECTIVES 24
1.2 MARKET DEFINITION 24
1.3 MARKET SCOPE 25
1.3.1 MARKET SEGMENTATION AND REGIONAL SCOPE 25
1.3.2 INCLUSIONS AND EXCLUSIONS 25
1.3.3 YEARS CONSIDERED 27
1.4 CURRENCY CONSIDERED 27
1.5 UNITS CONSIDERED 27
1.6 STAKEHOLDERS 27
1.7 SUMMARY OF CHANGES 28
2 EXECUTIVE SUMMARY 29
2.1 MARKET HIGHLIGHTS AND KEY INSIGHTS 29
2.2 KEY MARKET PARTICIPANTS: MAPPING OF STRATEGIC DEVELOPMENTS 31
2.3 DISRUPTIVE TRENDS IN BIOMETHANE MARKET 31
2.4 HIGH-GROWTH SEGMENTS 32
2.5 REGIONAL SNAPSHOT: MARKET SIZE, GROWTH RATE, AND FORECAST 33
3 PREMIUM INSIGHTS 34
3.1 ATTRACTIVE OPPORTUNITIES FOR PLAYERS IN BIOMETHANE MARKET 34
3.2 BIOMETHANE MARKET, BY REGION 35
3.3 BIOMETHANE MARKET, BY FEEDSTOCK TYPE 35
3.4 BIOMETHANE MARKET, BY PRODUCTION PROCESS 36
3.5 BIOMETHANE MARKET, BY END-USE APPLICATION 36
3.6 BIOMETHANE MARKET IN EUROPE, BY END-USE APPLICATION AND COUNTRY 37
4 MARKET OVERVIEW 38
4.1 INTRODUCTION 38
4.2 MARKET DYNAMICS 38
4.2.1 DRIVERS 39
4.2.1.1 Turning organic waste into low-cost renewable gas 39
4.2.1.2 Increasing biomethane output through advanced processing technologies 39
4.2.1.3 Government support through binding policy, incentives, and market integration 40
4.2.2 RESTRAINTS 41
4.2.2.1 Limited sustainable feedstock availability 41
4.2.2.2 Competition from alternative low-carbon and renewable gases 41
4.2.3 OPPORTUNITIES 42
4.2.3.1 Rapid scale-up via grid injection & national targets 42
4.2.3.2 Growth in heavy-duty transport & CNG/LNG/LBG market (road, shipping, buses) 42
4.2.4 CHALLENGES 43
4.2.4.1 High CAPEX/uncertain project economics 43
4.2.4.2 Gas network and injection constraints 43
4.3 INTERCONNECTED MARKETS AND CROSS-SECTOR OPPORTUNITIES 44
4.3.1 INTERCONNECTED MARKETS 44
4.3.2 CROSS-SECTOR OPPORTUNITIES 44
4.4 STRATEGIC MOVES BY TIER 1/2/3 PLAYERS 45
5 INDUSTRY TRENDS 46
5.1 PORTER’S FIVE FORCES ANALYSIS 46
5.1.1 THREAT OF SUBSTITUTES 47
5.1.2 BARGAINING POWER OF SUPPLIERS 47
5.1.3 BARGAINING POWER OF BUYERS 47
5.1.4 THREAT OF NEW ENTRANTS 48
5.1.5 INTENSITY OF COMPETITIVE RIVALRY 48
5.2 MACROECONOMIC OUTLOOK 48
5.2.1 INTRODUCTION 48
5.2.2 PUBLIC CLEAN ENERGY SPENDING 48
5.2.3 ENERGY PRICE VOLATILITY 49
5.2.4 WASTE MANAGEMENT COSTS 49
5.2.5 AGRICULTURAL ECONOMICS 49
5.3 SUPPLY CHAIN ANALYSIS 49
5.4 ECOSYSTEM ANALYSIS 52
5.5 TRADE ANALYSIS 53
5.5.1 EXPORT SCENARIO (HS CODE 271111) 53
5.5.2 IMPORT SCENARIO (HS CODE 271111) 54
5.6 CASE STUDY ANALYSIS 55
5.6.1 BIOMETHANE PRODUCTION AT STEUBEN COUNTY LANDFILL (WAGA ENERGY) 55
5.6.2 VANGUARD RENEWABLES & ASTRAZENECA RNG AGREEMENT 56
5.6.3 PERDUE FARMS BIOMETHANE FROM WASTEWATER (GREENGAS USA) 56
5.7 KEY CONFERENCES AND EVENTS, 2025–2026 56
5.8 PRICING ANALYSIS 57
5.8.1 INDICATIVE PRICING OF BIOMETHANE MARKET, BY END-USE APPLICATION, 2024 57
5.8.2 AVERAGE SELLING PRICE TREND OF BIOMETHANE, BY REGION, 2020–2024 58
5.9 TRENDS/DISRUPTIONS IMPACTING CUSTOMERS’ BUSINESSES 58
5.10 INVESTMENT AND FUNDING SCENARIO 59
5.11 IMPACT OF 2025 US TARIFFS—BIOMETHANE MARKET 60
5.11.1 INTRODUCTION 60
5.11.2 KEY TARIFF RATES 61
5.11.3 PRICE IMPACT ANALYSIS 61
5.11.4 IMPACT ON COUNTRIES/REGIONS 62
5.11.4.1 US 62
5.11.4.2 Europe 63
5.11.4.3 Asia Pacific 64
5.11.5 IMPACT ON END-USER INDUSTRIES 65
6 TECHNOLOGICAL ADVANCEMENTS, AI-DRIVEN IMPACT, PATENTS, INNOVATIONS, AND FUTURE APPLICATIONS 66
6.1 KEY EMERGING TECHNOLOGIES 66
6.1.1 MEMBRANE SEPARATION TECHNOLOGY 66
6.1.2 CRYOGENIC SEPARATION TECHNOLOGY 66
6.1.3 FEEDSTOCK PRE-TREATMENT TECHNOLOGIES 67
6.2 COMPLEMENTARY TECHNOLOGIES 69
6.2.1 PROCESS MONITORING & CONTROL SYSTEMS 69
6.2.2 DIGESTATE TREATMENT TECHNOLOGIES 70
6.3 ADJACENT TECHNOLOGIES 70
6.3.1 BIOGAS-TO-LIQUID TECHNOLOGIES 70
6.3.2 CARBON CAPTURE & UTILIZATION/STORAGE (CCUS) 70
6.4 TECHNOLOGY/PRODUCT ROADMAP 71
6.4.1 SHORT-TERM (2025–2027) | COMMERCIAL SCALE-UP AND MARKET CONSOLIDATION 71
6.4.2 MID-TERM (2028–2030) | SYSTEM INTEGRATION & COST OPTIMIZATION PHASE 72
6.4.3 LONG-TERM (2030–2035+) | NET-ZERO ALIGNMENT & MARKET MATURITY PHASE 73
6.5 PATENT ANALYSIS 74
6.6 FUTURE APPLICATIONS 75
6.7 IMPACT OF AI/GEN AI ON BIOMETHANE MARKET 77
6.7.1 TOP USE CASES AND MARKET POTENTIAL 78
6.7.2 BEST PRACTICES FOLLOWED BY OEMS IN BIOMETHANE MARKET 78
6.7.3 CASE STUDIES OF AI IMPLEMENTATION IN BIOMETHANE MARKET 79
6.7.4 INTERCONNECTED ECOSYSTEMS AND IMPACT ON MARKET PLAYERS 79
7 REGULATORY LANDSCAPE AND SUSTAINABILITY INITIATIVES 80
7.1 REGIONAL REGULATIONS AND COMPLIANCE 80
7.1.1 REGULATORY BODIES, GOVERNMENT AGENCIES, AND OTHER ORGANIZATIONS 80
7.1.2 INDUSTRY STANDARDS 83
7.2 SUSTAINABILITY INITIATIVES 84
7.2.1 WASTE VALORIZATION AND CIRCULAR FEEDSTOCK UTILIZATION 84
7.2.2 LOW-EMISSION PRODUCTION, UPGRADING EFFICIENCY, AND LIFECYCLE OPTIMIZATION 84
7.3 IMPACT OF REGULATORY POLICIES ON SUSTAINABILITY INITIATIVES 85
8 CUSTOMER LANDSCAPE & BUYING BEHAVIOR 87
8.1 DECISION-MAKING PROCESS 87
8.2 KEY STAKEHOLDERS INVOLVED IN BUYING PROCESS AND THEIR EVALUATION CRITERIA 88
8.2.1 KEY STAKEHOLDERS IN BUYING PROCESS 88
8.2.2 BUYING CRITERIA 89
8.3 ADOPTION BARRIERS AND INTERNAL CHALLENGES 89
8.4 UNMET NEEDS FROM VARIOUS END-USER/END-USE INDUSTRIES 90
8.5 MARKET PROFITABILITY 91
9 DISTRIBUTION MODES IN BIOMETHANE MARKET 92
9.1 INTRODUCTION 92
9.2 PIPELINE INJECTION 93
9.3 COMPRESSED NATURAL GAS 94
9.4 LIQUEFIED NATURAL GAS 95
10 END-USER TYPES IN BIOMETHANE MARKET 96
10.1 INTRODUCTION 96
10.2 INDUSTRIAL 96
10.3 COMMERCIAL 97
10.4 RESIDENTIAL 98
11 BIOMETHANE MARKET, BY FEEDSTOCK 99
11.1 INTRODUCTION 100
11.2 ENERGY CROPS 101
11.2.1 ENERGY CROPS PROVIDE FEEDSTOCK RELIABILITY IN BIOMETHANE VALUE CHAIN 101
11.3 AGRICULTURAL RESIDUES & ANIMAL MANURE 102
11.3.1 AGRICULTURAL RESIDUES & ANIMAL MANURE ANCHOR SCALABLE AND LOW-RISK BIOMETHANE SUPPLY 102
11.4 MUNICIPAL WASTE 103
11.4.1 MUNICIPAL WASTE EMERGES AS PRIMARY ENGINE OF SCALABLE, URBAN BIOMETHANE DEPLOYMENT 103
11.5 OTHER FEEDSTOCKS 104
11.5.1 INDUSTRIAL ORGANIC WASTE 105
11.5.2 SEWAGE SLUDGE 105
11.5.3 WASTEWATER 105
12 BIOMETHANE MARKET, BY PRODUCTION PROCESS 106
12.1 INTRODUCTION 107
12.2 ANAEROBIC DIGESTION & FERMENTATION 108
12.2.1 ANAEROBIC DIGESTION AND FERMENTATION FORM THE BACKBONE OF GLOBAL BIOMETHANE PRODUCTION 108
12.3 THERMAL GASIFICATION 109
12.3.1 THERMAL GASIFICATION EXPANDS BIOMETHANE PRODUCTION BEYOND BIOLOGICAL PATHWAYS 109
12.4 OTHER PRODUCTION PROCESSES 110
13 BIOMETHANE MARKET, BY END-USE APPLICATION 112
13.1 INTRODUCTION 113
13.2 TRANSPORTATION 114
13.2.1 TRANSPORT APPLICATIONS POSITION BIOMETHANE AS A LEADING DROP-IN DECARBONIZATION FUEL FOR MOBILITY 114
13.3 POWER GENERATION 115
13.3.1 BIOMETHANE STRENGTHENS THE POWER GENERATION MIX AS A DISPATCHABLE, LOW-CARBON ALTERNATIVE TO NATURAL GAS 115
13.4 INDUSTRIAL 116
13.4.1 INDUSTRIAL ENERGY TRANSITION INITIATIVES AND GOVERNMENT STRATEGIES TO SUPPORT GROWTH 116
14 BIOMETHANE MARKET, BY REGION 118
14.1 INTRODUCTION 119
14.2 NORTH AMERICA 121
14.2.1 US 124
14.2.1.1 US biomethane market is policy-driven and led by transportation demand 124
14.2.2 CANADA 125
14.2.2.1 Canada is supporting indigenous-led clean energy projects to advance energy independence and emissions reduction 125
14.2.3 MEXICO 126
14.2.3.1 Promising opportunities with strong potential from abundant waste and biomass resources 126
14.3 EUROPE 127
14.3.1 GERMANY 131
14.3.1.1 Germany’s large-scale grid injection and strong policy support ensure market leadership 131
14.3.2 UK 132
14.3.2.1 Despite strong decarbonization potential, growth remains constrained by policy uncertainty and restrictive feedstock regulations 132
14.3.3 FRANCE 132
14.3.3.1 Strong targets and binding supplier obligations make France Europe’s fastest-growing biomethane market 132
14.3.4 DENMARK 133
14.3.4.1 Denmark aims to replace fossil gas fully, but faces slowed growth after subsidy withdrawal 133
14.3.5 ITALY 134
14.3.5.1 Italy is scaling biomethane through strong policy funding, agricultural integration, and transport readiness 134
14.3.6 SWEDEN 135
14.3.6.1 High CO₂ taxes, long-term policy support, and significant reliance on imported biomethane to propel growth 135
14.3.7 REST OF EUROPE 136
14.4 ASIA PACIFIC 137
14.4.1 CHINA 141
14.4.1.1 China is transitioning biomethane from waste-based power use to an industry-driven decarbonization fuel led by state utilities 141
14.4.2 INDIA 142
14.4.2.1 Strong government support, CBG blending mandates, and waste-to-energy policies accelerate biomethane adoption 142
14.4.3 REST OF ASIA PACIFIC 143
14.5 REST OF THE WORLD 144
14.5.1 MIDDLE EAST & AFRICA 146
14.5.1.1 Pipeline of pilot and commercial projects is projected to offer sustained growth in MEA markets 146
14.5.2 SOUTH AMERICA 147
14.5.2.1 Promising initiatives in Brazil, Chile, and Colombia to spearhead growth of biomethane usage 147
15 COMPETITIVE LANDSCAPE 149
15.1 INTRODUCTION 149
15.2 KEY PLAYER COMPETITIVE STRATEGIES/RIGHT TO WIN, 2022–2025 149
15.3 REVENUE ANALYSIS, 2020–2024 151
15.4 MARKET SHARE ANALYSIS, 2024 152
15.5 COMPANY VALUATION AND FINANCIAL METRICS 154
15.6 BRAND COMPARISON 156
15.7 COMPANY EVALUATION MATRIX: KEY PLAYERS, 2024 157
15.7.1 STARS 157
15.7.2 EMERGING LEADERS 157
15.7.3 PERVASIVE PLAYERS 157
15.7.4 PARTICIPANTS 157
15.7.5 COMPANY FOOTPRINT, KEY PLAYERS, 2024 159
15.7.5.1 Company footprint 159
15.7.5.2 Region footprint 159
15.7.5.3 Feedstock footprint 160
15.7.5.4 Production process footprint 161
15.7.5.5 End-use application footprint 162
15.8 COMPANY EVALUATION MATRIX: STARTUPS/SMES, 2024 163
15.8.1 PROGRESSIVE COMPANIES 163
15.8.2 RESPONSIVE COMPANIES 163
15.8.3 DYNAMIC COMPANIES 163
15.8.4 STARTING BLOCKS 163
15.8.5 COMPETITIVE BENCHMARKING: STARTUPS/SMES, 2024 165
15.8.5.1 Detailed list of key startups/SMEs 165
15.8.5.2 Competitive benchmarking of key startups/SMEs 165
15.9 COMPETITIVE SCENARIO 166
15.9.1 DEALS 166
15.9.2 EXPANSIONS 167
15.9.3 OTHER DEVELOPMENTS 168
16 COMPANY PROFILES 169
16.1 KEY PLAYERS 169
16.1.1 SHELL 169
16.1.1.1 Business overview 169
16.1.1.2 Products/Solutions/Services offered 170
16.1.1.3 Recent developments 171
16.1.1.3.1 Deals 171
16.1.1.4 MnM view 171
16.1.1.4.1 Key strengths/Right to win 171
16.1.1.4.2 Strategic choices 172
16.1.1.4.3 Weaknesses/Competitive threats 172
16.1.2 GASUM LTD 173
16.1.2.1 Business overview 173
16.1.2.2 Products/Solutions/Services offered 174
16.1.2.3 Recent developments 175
16.1.2.3.1 Deals 175
16.1.2.3.2 Expansions 176
16.1.2.3.3 Other developments 178
16.1.2.4 MnM view 178
16.1.2.4.1 Key strengths/Right to win 178
16.1.2.4.2 Strategic choices 178
16.1.2.4.3 Weaknesses/Competitive threats 178
16.1.3 AIR LIQUIDE 179
16.1.3.1 Business overview 179
16.1.3.2 Products/Solutions/Services offered 180
16.1.3.3 Recent developments 181
16.1.3.3.1 Expansions 181
16.1.3.4 MnM view 182
16.1.3.4.1 Key strengths/Right to win 182
16.1.3.4.2 Strategic choices 182
16.1.3.4.3 Weaknesses/Competitive threats 182
16.1.4 BP P.L.C. 183
16.1.4.1 Business overview 183
16.1.4.2 Products/Solutions/Services offered 184
16.1.4.3 Recent developments 185
16.1.4.3.1 Deals 185
16.1.4.3.2 Expansions 186
16.1.4.4 MnM view 186
16.1.4.4.1 Key strengths/Right to win 186
16.1.4.4.2 Strategic choices 186
16.1.4.4.3 Weaknesses/Competitive threats 187
16.1.5 VERBIO SE 188
16.1.5.1 Business overview 188
16.1.5.2 Products/Solutions/Services offered 189
16.1.5.3 Recent developments 190
16.1.5.3.1 Deals 190
16.1.5.3.2 Expansions 190
16.1.5.4 MnM view 190
16.1.5.4.1 Key strengths/Right to win 190
16.1.5.4.2 Strategic choices 190
16.1.5.4.3 Weaknesses/Competitive threats 191
16.1.6 TOTALENERGIES 192
16.1.6.1 Business overview 192
16.1.6.2 Products/Solutions/Services offered 193
16.1.6.3 Recent developments 194
16.1.6.3.1 Deals 194
16.1.6.3.2 Expansions 195
16.1.6.4 MnM view 195
16.1.6.4.1 Key strengths/Right to win 195
16.1.6.4.2 Strategic choices 195
16.1.6.4.3 Weaknesses/Competitive threats 195
16.1.7 OPAL FUELS 196
16.1.7.1 Business overview 196
16.1.7.2 Products/Solutions/Services offered 197
16.1.7.3 Recent developments 197
16.1.7.3.1 Deals 197
16.1.7.3.2 Expansions 198
16.1.7.3.3 Other developments 199
16.1.8 CHEVRON CORPORATION 200
16.1.8.1 Business overview 200
16.1.8.2 Products/Solutions/Services offered 201
16.1.8.3 Recent developments 202
16.1.8.3.1 Deals 202
16.1.8.3.2 Expansions 202
16.1.9 E.ON SE 203
16.1.9.1 Business overview 203
16.1.9.2 Products/Solutions/Services offered 204
16.1.10 ENGIE 205
16.1.10.1 Business overview 205
16.1.10.2 Products/Solutions/Services offered 206
16.1.10.3 Recent developments 207
16.1.10.3.1 Deals 207
16.1.10.3.2 Expansions 208
16.1.10.3.3 Other developments 208
16.1.11 VEOLIA 209
16.1.11.1 Business overview 209
16.1.11.2 Products/Solutions/Services offered 210
16.1.11.3 Recent developments 211
16.1.11.3.1 Deals 211
16.1.11.3.2 Other developments 211
16.1.12 KINDER MORGAN 212
16.1.12.1 Business overview 212
16.1.12.2 Products/Solutions/Services offered 213
16.1.12.3 Recent developments 214
16.1.12.3.1 Deals 214
16.1.13 AMERESCO 215
16.1.13.1 Business overview 215
16.1.13.2 Products/Solutions/Services offered 216
16.1.13.3 Recent developments 217
16.1.13.3.1 Deals 217
16.1.13.3.2 Expansions 217
16.1.13.3.3 Other developments 220
16.1.14 CLEAN ENERGY FUELS 221
16.1.14.1 Business overview 221
16.1.14.2 Products/Solutions/Services offered 222
16.1.14.3 Recent developments 223
16.1.14.3.1 Deals 223
16.1.14.3.2 Expansions 225
16.1.15 GÖTEBORG ENERGI 227
16.1.15.1 Business overview 227
16.1.15.2 Products/Solutions/Services offered 228
16.1.15.3 Recent developments 228
16.1.15.3.1 Expansions 228
16.2 OTHER PLAYERS 229
16.2.1 ENVITEC BIOGAS AG 229
16.2.2 RAÍZEN 230
16.2.3 VANGUARD RENEWABLES 231
16.2.4 ANAERGIA 232
16.2.5 WAGA ENERGY 233
16.2.6 WELTEC BIPOWER GMBH 234
16.2.7 ETW ENERGIETECHNIK GMBH 235
16.2.8 GENECO 236
16.2.9 PLANET BIOGAS GROUP 237
16.2.10 EQTEC PLC AND GROUP 238
17 RESEARCH METHODOLOGY 239
17.1 RESEARCH DATA 239
17.2 SECONDARY AND PRIMARY RESEARCH 240
17.2.1 SECONDARY DATA 240
17.2.1.1 List of key secondary sources 240
17.2.1.2 Key data from secondary sources 241
17.2.2 PRIMARY DATA 241
17.2.2.1 List of primary interview participants 241
17.2.2.2 Key industry insights 242
17.2.2.3 Breakdown of primaries 242
17.2.2.4 Key data from primary sources 243
17.3 MARKET SIZE ESTIMATION METHODOLOGY 243
17.3.1 BOTTOM-UP APPROACH 243
17.3.2 TOP-DOWN APPROACH 244
17.3.3 DEMAND-SIDE ANALYSIS 245
17.3.3.1 Demand-side assumptions 245
17.3.3.2 Demand-side calculations 245
17.3.4 SUPPLY-SIDE ANALYSIS 246
17.3.4.1 Supply-side assumptions 247
17.3.4.2 Supply-side calculations 247
17.4 GROWTH FORECASTS 248
17.5 MARKET BREAKDOWN AND DATA TRIANGULATION 249
17.6 RESEARCH LIMITATIONS 250
17.7 RISK ANALYSIS 250
18 APPENDIX 251
18.1 INSIGHTS FROM INDUSTRY EXPERTS 251
18.2 DISCUSSION GUIDE 251
18.3 KNOWLEDGESTORE: MARKETSANDMARKETS’ SUBSCRIPTION PORTAL 256
18.4 CUSTOMIZATION OPTIONS 258
18.5 RELATED REPORTS 258
18.6 AUTHOR DETAILS 259
LIST OF TABLES
TABLE 1 BIOMETHANE MARKET, BY FEEDSTOCK: INCLUSIONS AND EXCLUSIONS 25
TABLE 2 BIOMETHANE MARKET, BY END-USE APPLICATION: INCLUSIONS AND EXCLUSIONS 26
TABLE 3 BIOMETHANE MARKET, BY PRODUCTION PROCESS: INCLUSIONS AND EXCLUSIONS 26
TABLE 4 BIOMETHANE MARKET, BY REGION: INCLUSIONS AND EXCLUSIONS 26
TABLE 5 KEY MOVES AND STRATEGIC FOCUS OF TIER 1/2/3 PLAYERS 45
TABLE 6 IMPACT OF PORTER’S FIVE FORCES ANALYSIS 47
TABLE 7 BIOMETHANE MARKET: ROLE OF PLAYERS IN ECOSYSTEM 53
TABLE 8 EXPORT DATA FOR HS CODE 271111-COMPLIANT PRODUCTS, BY COUNTRY, 2020–2024 (USD THOUSAND) 54
TABLE 9 IMPORT DATA FOR HS CODE 271111-COMPLIANT PRODUCTS, BY COUNTRY, 2020–2024 (USD THOUSAND) 55
TABLE 10 BIOMETHANE MARKET: LIST OF CONFERENCES AND EVENTS, 2025–2026 56
TABLE 11 INDICATIVE PRICING TREND OF BIOMETHANE, BY END-USE APPLICATION,
2024 (USD/CUBIC METER) 57
TABLE 12 AVERAGE SELLING PRICE TREND OF BIOMETHANE, BY REGION,
2020–2024 (USD/CUBIC METER) 58
TABLE 13 US-ADJUSTED RECIPROCAL TARIFF RATES 61
TABLE 14 EXPECTED CHANGE IN PRICES AND POTENTIAL IMPACT ON MARKET PLAYERS DUE TO TARIFFS 62
TABLE 15 ADVANTAGES OF DIFFERENT PRETREATMENT TECHNOLOGIES 68
TABLE 16 LIST OF PATENTS, BIOMETHANE MARKET, JANUARY 2024– OCTOBER 2025 74
TABLE 17 RENEWABLE TRANSPORT FUELS (HEAVY-DUTY & LONG-HAUL MOBILITY) 76
TABLE 18 INDUSTRIAL DECARBONIZATION (LOW-CARBON HEAT & PROCESS ENERGY) 76
TABLE 19 GRID BALANCING & ENERGY STORAGE (FLEXIBLE POWER SUPPORT) 76
TABLE 20 CARBON-NEGATIVE ENERGY SYSTEMS (NEGATIVE EMISSIONS PATHWAYS) 77
TABLE 21 DECENTRALIZED WASTE-TO-ENERGY SYSTEMS (LOCAL ENERGY GENERATION) 77
TABLE 22 TOP USE CASES AND MARKET POTENTIAL 78
TABLE 23 BEST PRACTICES: COMPANIES IMPLEMENTING USE CASES 78
TABLE 24 BIOMETHANE MARKET: CASE STUDIES RELATED TO GEN AI IMPLEMENTATION 79
TABLE 25 INTERCONNECTED ECOSYSTEMS AND IMPACT ON BIOMETHANE MARKET PLAYERS 79
TABLE 26 NORTH AMERICA: REGULATORY BODIES, GOVERNMENT AGENCIES, AND OTHER ORGANIZATIONS 80
TABLE 27 EUROPE: REGULATORY BODIES, GOVERNMENT AGENCIES, AND OTHER ORGANIZATIONS 81
TABLE 28 ASIA PACIFIC: REGULATORY BODIES, GOVERNMENT AGENCIES, AND OTHER ORGANIZATIONS 82
TABLE 29 REST OF THE WORLD: REGULATORY BODIES, GOVERNMENT AGENCIES, AND OTHER ORGANIZATIONS 83
TABLE 30 STANDARDS RELATED TO THE BIOMETHANE MARKET 83
TABLE 31 BIOMETHANE MARKET: RELEVANT STANDARDS 85
TABLE 32 INFLUENCE OF STAKEHOLDERS ON BUYING PROCESS, BY END USER 88
TABLE 33 KEY BUYING CRITERIA, BY END-USE APPLICATION 89
TABLE 34 PRIMARY DISTRIBUTION PATHWAYS FOR BIOMETHANE 92
TABLE 35 BIOMETHANE FOR INDUSTRIAL END USERS 97
TABLE 36 CASE STUDIES: COMMERCIAL BIOMETHANE ADOPTION 98
TABLE 37 BIOMETHANE MARKET, BY FEEDSTOCK, 2020–2024 (USD MILLION) 100
TABLE 38 BIOMETHANE MARKET, BY FEEDSTOCK, 2025–2030 (USD MILLION) 101
TABLE 39 ENERGY CROPS: BIOMETHANE MARKET, BY REGION, 2020–2024 (USD MILLION) 101
TABLE 40 ENERGY CROPS: BIOMETHANE MARKET, BY REGION, 2025–2030 (USD MILLION) 102
TABLE 41 AGRICULTURAL RESIDUES & ANIMAL MANURE: BIOMETHANE MARKET,
BY REGION, 2020–2024 (USD MILLION) 103
TABLE 42 AGRICULTURAL RESIDUES & ANIMAL MANURE: BIOMETHANE MARKET,
BY REGION, 2025–2030 (USD MILLION) 103
TABLE 43 MUNICIPAL WASTE: BIOMETHANE MARKET, BY REGION,
2020–2024 (USD MILLION) 104
TABLE 44 MUNICIPAL WASTE: BIOMETHANE MARKET, BY REGION,
2025–2030 (USD MILLION) 104
TABLE 45 OTHER FEEDSTOCKS: BIOMETHANE MARKET, BY REGION,
2020–2024 (USD MILLION) 105
TABLE 46 OTHER FEEDSTOCKS: BIOMETHANE MARKET, BY REGION,
2025–2030 (USD MILLION) 105
TABLE 47 BIOMETHANE MARKET, BY PRODUCTION PROCESS, 2020–2024 (USD MILLION) 107
TABLE 48 BIOMETHANE MARKET, BY PRODUCTION PROCESS, 2025–2030 (USD MILLION) 108
TABLE 49 ANAEROBIC DIGESTION & FERMENTATION: BIOMETHANE MARKET, BY REGION, 2020–2024 (USD MILLION) 109
TABLE 50 ANAEROBIC DIGESTION & FERMENTATION: BIOMETHANE MARKET, BY REGION, 2025–2030 (USD MILLION) 109
TABLE 51 THERMAL GASIFICATION: BIOMETHANE MARKET, BY REGION,
2020–2024 (USD MILLION) 110
TABLE 52 THERMAL GASIFICATION: BIOMETHANE MARKET, BY REGION,
2025–2030 (USD MILLION) 110
TABLE 53 OTHER PRODUCTION PROCESSES: BIOMETHANE MARKET, BY REGION,
2020–2024 (USD MILLION) 111
TABLE 54 OTHER PRODUCTION PROCESSES: BIOMETHANE MARKET, BY REGION,
2025–2030 (USD MILLION) 111
TABLE 55 BIOMETHANE MARKET, BY END-USE APPLICATION, 2020–2024 (USD MILLION) 113
TABLE 56 BIOMETHANE MARKET, BY END-USE APPLICATION, 2025–2030 (USD MILLION) 113
TABLE 57 BIOMETHANE MARKET, BY END-USE APPLICATION, 2020–2024 (BCM) 114
TABLE 58 BIOMETHANE MARKET, BY END-USE APPLICATION, 2025–2030 (BCM) 114
TABLE 59 TRANSPORTATION: BIOMETHANE MARKET, BY REGION,
2020–2024 (USD MILLION) 115
TABLE 60 TRANSPORTATION: BIOMETHANE MARKET, BY REGION,
2025–2030 (USD MILLION) 115
TABLE 61 POWER GENERATION: BIOMETHANE MARKET, BY REGION,
2020–2024 (USD MILLION) 116
TABLE 62 POWER GENERATION: BIOMETHANE MARKET, BY REGION,
2025–2030 (USD MILLION) 116
TABLE 63 INDUSTRIAL: BIOMETHANE MARKET, BY REGION, 2020–2024 (USD MILLION) 117
TABLE 64 INDUSTRIAL: BIOMETHANE MARKET, BY REGION, 2025–2030 (USD MILLION) 117
TABLE 65 BIOMETHANE MARKET, BY REGION, 2020–2024 (USD MILLION) 120
TABLE 66 BIOMETHANE MARKET, BY REGION, 2025–2030 (USD MILLION) 120
TABLE 67 BIOMETHANE MARKET, BY REGION, 2020–2024 (BCM) 120
TABLE 68 BIOMETHANE MARKET, BY REGION, 2025–2030 (BCM) 120
TABLE 69 NORTH AMERICA: BIOMETHANE MARKET, BY FEEDSTOCK,
2020–2024 (USD MILLION) 121
TABLE 70 NORTH AMERICA: BIOMETHANE MARKET, BY FEEDSTOCK,
2025–2030 (USD MILLION) 121
TABLE 71 NORTH AMERICA: BIOMETHANE MARKET, BY PRODUCTION PROCESS,
2020–2024 (USD MILLION) 122
TABLE 72 NORTH AMERICA: BIOMETHANE MARKET, BY PRODUCTION PROCESS,
2025–2030 (USD MILLION) 122
TABLE 73 NORTH AMERICA: BIOMETHANE MARKET, BY END-USE APPLICATION,
2020–2024 (USD MILLION) 122
TABLE 74 NORTH AMERICA: BIOMETHANE MARKET, BY END-USE APPLICATION,
2025–2030 (USD MILLION) 122
TABLE 75 NORTH AMERICA: BIOMETHANE MARKET, BY COUNTRY,
2020–2024 (USD MILLION) 123
TABLE 76 NORTH AMERICA: BIOMETHANE MARKET, BY COUNTRY,
2025–2030 (USD MILLION) 123
TABLE 77 NORTH AMERICA: BIOMETHANE MARKET, BY COUNTRY, 2020–2024 (BCM) 123
TABLE 78 NORTH AMERICA: BIOMETHANE MARKET, BY COUNTRY, 2025–2030 (BCM) 123
TABLE 79 US: BIOMETHANE MARKET, BY END-USE APPLICATION, 2020–2024 (USD MILLION) 124
TABLE 80 US: BIOMETHANE MARKET, BY END-USE APPLICATION, 2025–2030 (USD MILLION) 124
TABLE 81 CANADA: BIOMETHANE MARKET, BY END-USE APPLICATION,
2020–2024 (USD MILLION) 125
TABLE 82 CANADA: BIOMETHANE MARKET, BY END-USE APPLICATION,
2025–2030 (USD MILLION) 125
TABLE 83 MEXICO: BIOMETHANE MARKET, BY END-USE APPLICATION,
2020–2024 (USD MILLION) 126
TABLE 84 MEXICO: BIOMETHANE MARKET, BY END-USE APPLICATION,
2025–2030 (USD MILLION) 126
TABLE 85 EUROPE: BIOMETHANE MARKET, BY FEEDSTOCK, 2020–2024 (USD MILLION) 128
TABLE 86 EUROPE: BIOMETHANE MARKET, BY FEEDSTOCK, 2025–2030 (USD MILLION) 128
TABLE 87 EUROPE: BIOMETHANE MARKET, BY PRODUCTION PROCESS,
2020–2024 (USD MILLION) 128
TABLE 88 EUROPE: BIOMETHANE MARKET, BY PRODUCTION PROCESS,
2025–2030 (USD MILLION) 128
TABLE 89 EUROPE: BIOMETHANE MARKET, BY END-USE APPLICATION,
2020–2024 (USD MILLION) 129
TABLE 90 EUROPE: BIOMETHANE MARKET, BY END-USE APPLICATION,
2025–2030 (USD MILLION) 129
TABLE 91 EUROPE: BIOMETHANE MARKET, BY COUNTRY, 2020–2024 (USD MILLION) 129
TABLE 92 EUROPE: BIOMETHANE MARKET, BY COUNTRY, 2025–2030 (USD MILLION) 130
TABLE 93 EUROPE: BIOMETHANE MARKET, BY COUNTRY, 2020–2024 (BCM) 130
TABLE 94 EUROPE: BIOMETHANE MARKET, BY COUNTRY, 2025–2030 (BCM) 130
TABLE 95 GERMANY: BIOMETHANE MARKET, BY END-USE APPLICATION,
2020–2024 (USD MILLION) 131
TABLE 96 GERMANY: BIOMETHANE MARKET, BY END-USE APPLICATION,
2025–2030 (USD MILLION) 131
TABLE 97 UK: BIOMETHANE MARKET, BY END-USE APPLICATION, 2020–2024 (USD MILLION) 132
TABLE 98 UK: BIOMETHANE MARKET, BY END-USE APPLICATION, 2025–2030 (USD MILLION) 132
TABLE 99 FRANCE: BIOMETHANE MARKET, BY END-USE APPLICATION,
2020–2024 (USD MILLION) 133
TABLE 100 FRANCE: BIOMETHANE MARKET, BY END-USE APPLICATION,
2025–2030 (USD MILLION) 133
TABLE 101 DENMARK: BIOMETHANE MARKET, BY END-USE APPLICATION,
2020–2024 (USD MILLION) 134
TABLE 102 DENMARK: BIOMETHANE MARKET, BY END-USE APPLICATION,
2025–2030 (USD MILLION) 134
TABLE 103 ITALY: BIOMETHANE MARKET, BY END-USE APPLICATION,
2020–2024 (USD MILLION) 135
TABLE 104 ITALY: BIOMETHANE MARKET, BY END-USE APPLICATION,
2025–2030 (USD MILLION) 135
TABLE 105 SWEDEN: BIOMETHANE MARKET, BY END-USE APPLICATION,
2020–2024 (USD MILLION) 136
TABLE 106 SWEDEN: BIOMETHANE MARKET, BY END-USE APPLICATION,
2025–2030 (USD MILLION) 136
TABLE 107 REST OF EUROPE: BIOMETHANE MARKET, BY END-USE APPLICATION,
2020–2024 (USD MILLION) 136
TABLE 108 REST OF EUROPE: BIOMETHANE MARKET, BY END-USE APPLICATION,
2025–2030 (USD MILLION) 137
TABLE 109 ASIA PACIFIC: BIOMETHANE MARKET, BY FEEDSTOCK, 2020–2024 (USD MILLION) 138
TABLE 110 ASIA PACIFIC: BIOMETHANE MARKET, BY FEEDSTOCK, 2025–2030 (USD MILLION) 138
TABLE 111 ASIA PACIFIC: BIOMETHANE MARKET, BY PRODUCTION PROCESS,
2020–2024 (USD MILLION) 139
TABLE 112 ASIA PACIFIC: BIOMETHANE MARKET, BY PRODUCTION PROCESS,
2025–2030 (USD MILLION) 139
TABLE 113 ASIA PACIFIC: BIOMETHANE MARKET, BY END-USE APPLICATION,
2020–2024 (USD MILLION) 139
TABLE 114 ASIA PACIFIC: BIOMETHANE MARKET, BY END-USE APPLICATION,
2025–2030 (USD MILLION) 139
TABLE 115 ASIA PACIFIC: BIOMETHANE MARKET, BY COUNTRY, 2020–2024 (USD MILLION) 140
TABLE 116 ASIA PACIFIC: BIOMETHANE MARKET, BY COUNTRY, 2025–2030 (USD MILLION) 140
TABLE 117 ASIA PACIFIC: BIOMETHANE MARKET, BY COUNTRY, 2020–2024 (BCM) 140
TABLE 118 ASIA PACIFIC: BIOMETHANE MARKET, BY COUNTRY, 2025–2030 (BCM) 140
TABLE 119 CHINA: BIOMETHANE MARKET, BY END-USE APPLICATION,
2020–2024 (USD MILLION) 141
TABLE 120 CHINA: BIOMETHANE MARKET, BY END-USE APPLICATION,
2025–2030 (USD MILLION) 141
TABLE 121 INDIA: BIOMETHANE MARKET, BY END-USE APPLICATION,
2020–2024 (USD MILLION) 142
TABLE 122 INDIA: BIOMETHANE MARKET, BY END-USE APPLICATION,
2025–2030 (USD MILLION) 142
TABLE 123 REST OF ASIA PACIFIC: BIOMETHANE MARKET, BY END-USE APPLICATION,
2020–2024 (USD MILLION) 143
TABLE 124 REST OF ASIA PACIFIC: BIOMETHANE MARKET, BY END-USE APPLICATION,
2025–2030 (USD MILLION) 143
TABLE 125 REST OF THE WORLD: BIOMETHANE MARKET, BY FEEDSTOCK,
2020–2024 (USD MILLION) 144
TABLE 126 REST OF THE WORLD: BIOMETHANE MARKET, BY FEEDSTOCK,
2025–2030 (USD MILLION) 144
TABLE 127 REST OF THE WORLD: BIOMETHANE MARKET, BY PRODUCTION PROCESS,
2020–2024 (USD MILLION) 145
TABLE 128 REST OF THE WORLD: BIOMETHANE MARKET, BY PRODUCTION PROCESS,
2025–2030 (USD MILLION) 145
TABLE 129 REST OF THE WORLD: BIOMETHANE MARKET, BY END-USE APPLICATION,
2020–2024 (USD MILLION) 145
TABLE 130 REST OF THE WORLD: BIOMETHANE MARKET, BY END-USE APPLICATION,
2025–2030 (USD MILLION) 145
TABLE 131 REST OF THE WORLD: BIOMETHANE MARKET, BY REGION,
2020–2024 (USD MILLION) 146
TABLE 132 REST OF THE WORLD: BIOMETHANE MARKET, BY REGION,
2025–2030 (USD MILLION) 146
TABLE 133 REST OF THE WORLD: BIOMETHANE MARKET, BY REGION, 2020–2024 (BCM) 146
TABLE 134 REST OF THE WORLD: BIOMETHANE MARKET, BY REGION, 2025–2030 (BCM) 146
TABLE 135 MIDDLE EAST & AFRICA: BIOMETHANE MARKET, BY END-USE APPLICATION, 2020–2024 (USD MILLION) 147
TABLE 136 MIDDLE EAST & AFRICA: BIOMETHANE MARKET, BY END-USE APPLICATION, 2025–2030 (USD MILLION) 147
TABLE 137 SOUTH AMERICA: BIOMETHANE MARKET, BY END-USE APPLICATION,
2020–2024 (USD MILLION) 148
TABLE 138 SOUTH AMERICA: BIOMETHANE MARKET, BY END-USE APPLICATION,
2025–2030 (USD MILLION) 148
TABLE 139 BIOMETHANE MARKET: OVERVIEW OF STRATEGIES ADOPTED BY KEY PLAYERS, JANUARY 2022–JULY 2025 149
TABLE 140 BIOMETHANE MARKET: DEGREE OF COMPETITION, 2024 152
TABLE 141 BIOMETHANE MARKET: REGION FOOTPRINT 159
TABLE 142 BIOMETHANE MARKET: FEEDSTOCK FOOTPRINT 160
TABLE 143 BIOMETHANE MARKET: PRODUCTION PROCESS FOOTPRINT 161
TABLE 144 BIOMETHANE MARKET: END-USE APPLICATION FOOTPRINT 162
TABLE 145 BIOMETHANE MARKET: DETAILED LIST OF KEY STARTUPS/SMES 165
TABLE 146 BIOMETHANE MARKET: COMPETITIVE BENCHMARKING OF KEY STARTUPS/SMES 165
TABLE 147 BIOMETHANE MARKET: DEALS, JANUARY 2022–JULY 2025 166
TABLE 148 BIOMETHANE MARKET: EXPANSIONS, JANUARY 2020–DECEMBER 2025 167
TABLE 149 BIOMETHANE MARKET: OTHER DEVELOPMENTS,
JANUARY 2020–DECEMBER 2025 168
TABLE 150 SHELL: COMPANY OVERVIEW 169
TABLE 151 SHELL: PRODUCTS/SOLUTIONS/SERVICES OFFERED 170
TABLE 152 SHELL: DEALS 171
TABLE 153 GASUM LTD: COMPANY OVERVIEW 173
TABLE 154 GASUM LTD: PRODUCTS/SOLUTIONS/SERVICES OFFERED 174
TABLE 155 GASUM LTD: DEALS 175
TABLE 156 GASUM LTD: EXPANSIONS 176
TABLE 157 GASUM LTD: OTHER DEVELOPMENTS 178
TABLE 158 AIR LIQUIDE: COMPANY OVERVIEW 179
TABLE 159 AIR LIQUIDE: PRODUCTS/SOLUTIONS/SERVICES OFFERED 180
TABLE 160 AIR LIQUIDE: EXPANSIONS 181
TABLE 161 BP P.L.C.: COMPANY OVERVIEW 183
TABLE 162 BP P.L.C.: PRODUCTS/SOLUTIONS/SERVICES OFFERED 184
TABLE 163 BP P.L.C.: DEALS 185
TABLE 164 BP P.L.C.: EXPANSIONS 186
TABLE 165 VERBIO SE: COMPANY OVERVIEW 188
TABLE 166 VERBIO SE: PRODUCTS/SOLUTIONS/SERVICES OFFERED 189
TABLE 167 VERBIO SE: DEALS 190
TABLE 168 VERBIO SE: EXPANSIONS 190
TABLE 169 TOTALENERGIES: COMPANY OVERVIEW 192
TABLE 170 TOTALENERGIES: PRODUCTS/SOLUTIONS/SERVICES OFFERED 193
TABLE 171 TOTALENERGIES: DEALS 194
TABLE 172 TOTALENERGIES: EXPANSIONS 195
TABLE 173 OPAL FUELS: COMPANY OVERVIEW 196
TABLE 174 OPAL FUELS: PRODUCTS/SOLUTIONS/SERVICES OFFERED 197
TABLE 175 OPAL FUELS: DELAS 197
TABLE 176 OPAL FUELS: EXPANSIONS 198
TABLE 177 OPAL FUELS: OTHER DEVELOPMENTS 199
TABLE 178 CHEVRON CORPORATION: COMPANY OVERVIEW 200
TABLE 179 CHEVRON CORPORATION: PRODUCTS/SOLUTIONS/SERVICES OFFERED 201
TABLE 180 CHEVRON CORPORATION: DEALS 202
TABLE 181 CHEVRON CORPORATION: EXPANSIONS 202
TABLE 182 E.ON SE: COMPANY OVERVIEW 203
TABLE 183 E.ON SE: PRODUCTS/SOLUTIONS/SERVICES OFFERED 204
TABLE 184 ENGIE: COMPANY OVERVIEW 205
TABLE 185 ENGIE: PRODUCTS/SOLUTIONS/SERVICES OFFERED 206
TABLE 186 ENGIE: DEALS 207
TABLE 187 ENGIE: EXPANSIONS 208
TABLE 188 ENGIE: OTHER DEVELOPMENTS 208
TABLE 189 VEOLIA: COMPANY OVERVIEW 209
TABLE 190 VEOLIA: PRODUCTS/SOLUTIONS/SERVICES OFFERED 210
TABLE 191 VEOLIA: DEALS 211
TABLE 192 VEOLIA: OTHER DEVELOPMENTS 211
TABLE 193 KINDER MORGAN: COMPANY OVERVIEW 212
TABLE 194 KINDER MORGAN: PRODUCTS/SOLUTIONS/SERVICES OFFERED 213
TABLE 195 KINDER MORGAN: DEALS 214
TABLE 196 AMERESCO: COMPANY OVERVIEW 215
TABLE 197 AMERESCO: PRODUCTS/SOLUTIONS/SERVICES OFFERED 216
TABLE 198 AMERESCO: DEALS 217
TABLE 199 AMERESCO: EXPANSIONS 217
TABLE 200 AMERESCO: OTHER DEVELOPMENTS 220
TABLE 201 CLEAN ENERGY FUELS: COMPANY OVERVIEW 221
TABLE 202 CLEAN ENERGY FUELS: PRODUCTS/SOLUTIONS/SERVICES OFFERED 222
TABLE 203 CLEAN ENERGY FUELS: DEALS 223
TABLE 204 CLEAN ENERGY FUELS: EXPANSIONS 225
TABLE 205 GÖTEBORG ENERGI: COMPANY OVERVIEW 227
TABLE 206 GÖTEBORG ENERGI: PRODUCTS/SOLUTIONS/SERVICES OFFERED 228
TABLE 207 GÖTEBORG ENERGI: EXPANSIONS 228
TABLE 208 ENVITEC BIOGAS AG: COMPANY OVERVIEW 229
TABLE 209 RAÍZEN: COMPANY OVERVIEW 230
TABLE 210 VANGUARD RENEWABLES: COMPANY OVERVIEW 231
TABLE 211 ANAERGIA: COMPANY OVERVIEW 232
TABLE 212 WAGA ENERGY: COMPANY OVERVIEW 233
TABLE 213 WELTEC BIPOWER GMBH: COMPANY OVERVIEW 234
TABLE 214 ETW ENERGIETECHNIK GMBH: COMPANY OVERVIEW 235
TABLE 215 GENECO: COMPANY OVERVIEW 236
TABLE 216 PLANET BIOGAS GROUP: COMPANY OVERVIEW 237
TABLE 217 EQTEC PLC AND GROUP: COMPANY OVERVIEW 238
TABLE 218 LIST OF PRIMARY INTERVIEW PARTICIPANTS 241
TABLE 219 DATA OBTAINED FROM PRIMARY SOURCES 243
LIST OF FIGURES
FIGURE 1 BIOMETHANE MARKET SEGMENTATION AND REGIONAL SCOPE 25
FIGURE 2 BIOMETHANE MARKET HIGHLIGHTS AND KEY INSIGHTS 30
FIGURE 3 GLOBAL BIOMETHANE MARKET, 2025–2030 (USD MILLION) 30
FIGURE 4 MAJOR STRATEGIES ADOPTED BY KEY PLAYERS IN BIOMETHANE MARKET,
2022–2025 31
FIGURE 5 DISRUPTIONS IMPACTING GROWTH OF CIRCUIT BREAKER MARKET 31
FIGURE 6 HIGH-GROWTH SEGMENTS IN BIOMETHANE MARKET, 2025-2030 32
FIGURE 7 ASIA PACIFIC TO REGISTER HIGHEST GROWTH DURING FORECAST PERIOD 33
FIGURE 8 STRONG POLICY SUPPORT FOR DECARBONIZATION AND WASTE-TO-ENERGY SOLUTIONS ACCELERATES GLOBAL BIOMETHANE MARKET GROWTH 34
FIGURE 9 ASIA PACIFIC TO REGISTER HIGHEST CAGR IN BIOMETHANE MARKET
FROM 2025 TO 2030 35
FIGURE 10 AGRICULTURE RESIDUE AND ANIMAL MANURE SEGMENT TO ACCOUNT FOR LARGEST MARKET SHARE IN 2030 35
FIGURE 11 ANAEROBIC DIGESTION & FERMENTATION SEGMENT TO CAPTURE LARGEST MARKET SHARE IN 2030 36
FIGURE 12 TRANSPORTATION SEGMENT TO HOLD LARGEST MARKET SHARE IN 2030 36
FIGURE 13 POWER GENERATION SEGMENT AND GERMANY HELD LARGEST SHARE OF BIOMETHANE MARKET IN EUROPE IN 2024 37
FIGURE 14 BIOMETHANE MARKET: DRIVERS, RESTRAINTS, OPPORTUNITIES, AND CHALLENGES 38
FIGURE 15 BIOMETHANE PRODUCTION IN EUROPE (BCM), 2015-2024 39
FIGURE 16 UPGRADING TECHNOLOGIES FOR BIOMETHANE PRODUCTION IN EUROPE, 2024 40
FIGURE 17 PORTER’S FIVE FORCES ANALYSIS 46
FIGURE 18 BIOMETHANE MARKET: SUPPLY CHAIN ANALYSIS 50
FIGURE 19 BIOMETHANE MARKET: ECOSYSTEM ANALYSIS 52
FIGURE 20 EXPORT SCENARIO FOR HS CODE 271111-COMPLIANT PRODUCTS, BY COUNTRY, 2020–2024 54
FIGURE 21 IMPORT SCENARIO FOR HS CODE 271111-COMPLIANT PRODUCTS, BY COUNTRY, 2020–2024 55
FIGURE 22 AVERAGE SELLING PRICE TREND OF BIOMETHANE, BY REGION,
2020–2024 (USD/CUBIC METER) 58
FIGURE 23 BIOMETHANE MARKET: TRENDS/DISRUPTIONS IMPACTING CUSTOMER BUSINESS 59
FIGURE 24 INVESTMENT AND FUNDING SCENARIO, 2024 60
FIGURE 25 TWO-STAGE MEMBRANE SEPARATION PROCESS FOR BIOMETHANE UPGRADING 66
FIGURE 26 CRYOGENIC SEPARATION PROCESS FOR BIOMETHANE UPGRADING 67
FIGURE 27 BIOMETHANE MARKET: PATENTS GRANTED AND APPLIED, 2016–2025 74
FIGURE 28 FUTURE APPLICATIONS IN BIOMETHANE MARKET 75
FIGURE 29 BIOMETHANE MARKET: DECISION-MAKING FACTORS 87
FIGURE 30 INFLUENCE OF STAKEHOLDERS ON BUYING PROCESS, BY END USER 88
FIGURE 31 KEY BUYING CRITERIA, BY END-USE APPLICATION 89
FIGURE 32 BIOMETHANE DISTRIBUTION THROUGH PIPELINE INJECTION 93
FIGURE 33 BIOMETHANE DISTRIBUTION AS COMPRESSED NATURAL GAS 94
FIGURE 34 BIOMETHANE DISTRIBUTION AS LIQUIFIED NATURAL GAS 95
FIGURE 35 BIOMETHANE MARKET, BY FEEDSTOCK, 2024 100
FIGURE 36 BIOMETHANE MARKET, BY PRODUCTION PROCESS, 2024 107
FIGURE 37 BIOMETHANE MARKET, BY END-USE APPLICATION, 2024 113
FIGURE 38 ASIA PACIFIC TO RECORD HIGHEST CAGR DURING FORECAST PERIOD 119
FIGURE 39 BIOMETHANE MARKET SHARE, BY REGION, 2025 119
FIGURE 40 EUROPE: BIOMETHANE MARKET SNAPSHOT 127
FIGURE 41 ASIA PACIFIC: BIOMETHANE MARKET SNAPSHOT 138
FIGURE 42 BIOMETHANE MARKET: SEGMENTAL REVENUE ANALYSIS OF KEY PLAYERS,
2020–2024 151
FIGURE 43 MARKET SHARE ANALYSIS OF COMPANIES OFFERING BIOMETHANE, 2024 152
FIGURE 44 COMPANY VALUATION 154
FIGURE 45 FINANCIAL METRICS 155
FIGURE 46 BIOMETHANE MARKET: BRAND COMPARISON 156
FIGURE 47 BIOMETHANE MARKET: COMPANY EVALUATION MATRIX (KEY PLAYERS), 2024 158
FIGURE 48 BIOMETHANE MARKET: COMPANY FOOTPRINT 159
FIGURE 49 BIOMETHANE MARKET: COMPANY EVALUATION MATRIX (STARTUPS/SMES), 2024 164
FIGURE 50 SHELL: COMPANY SNAPSHOT 170
FIGURE 51 GASUM LTD: COMPANY SNAPSHOT 174
FIGURE 52 AIR LIQUIDE: COMPANY SNAPSHOT 180
FIGURE 53 BP P.L.C.: COMPANY SNAPSHOT 184
FIGURE 54 VERBIO SE: COMPANY SNAPSHOT 189
FIGURE 55 TOTALENERGIES: COMPANY SNAPSHOT 193
FIGURE 56 OPAL FUELS: COMPANY SNAPSHOT 196
FIGURE 57 CHEVRON CORPORATION: COMPANY SNAPSHOT 201
FIGURE 58 E.ON SE: COMPANY SNAPSHOT 204
FIGURE 59 ENGIE: COMPANY SNAPSHOT 206
FIGURE 60 VEOLIA: COMPANY SNAPSHOT 210
FIGURE 61 KINDER MORGAN: COMPANY SNAPSHOT 213
FIGURE 62 AMERESCO: COMPANY SNAPSHOT 216
FIGURE 63 CLEAN ENERGY FUELS: COMPANY SNAPSHOT 222
FIGURE 64 GÖTEBORG ENERGI: COMPANY SNAPSHOT 227
FIGURE 65 BIOMETHANE MARKET: RESEARCH DESIGN 239
FIGURE 66 KEY DATA FROM SECONDARY SOURCES 241
FIGURE 67 INSIGHTS FROM INDUSTRY EXPERTS 242
FIGURE 68 BREAKDOWN OF PRIMARIES: BY COMPANY TYPE, DESIGNATION, AND REGION 242
FIGURE 69 BIOMETHANE MARKET: BOTTOM-UP APPROACH 244
FIGURE 70 BIOMETHANE MARKET: TOP-DOWN APPROACH 244
FIGURE 71 KEY METRICS CONSIDERED TO ANALYZE DEMAND FOR BIOMETHANE 245
FIGURE 72 KEY METRICS CONSIDERED TO ASSESS SUPPLY OF BIOMETHANE 246
FIGURE 73 BIOMETHANE MARKET: SUPPLY-SIDE ANALYSIS 247
FIGURE 74 INDUSTRY CONCENTRATION, 2024 248
FIGURE 75 BIOMETHANE MARKET: DATA TRIANGULATION 249
FIGURE 76 BIOMETHANE MARKET: RESEARCH LIMITATIONS 250
FIGURE 77 BIOMETHANE MARKET: INSIGHTS FROM INDUSTRY EXPERTS 251