Brain Computer Interface Market Size, Share & Trends Analysis Report
ブレインコンピュータインターフェース市場 - 製品(侵襲性、非侵襲性)、用途(ヘルスケア、通信・制御、エンターテイメント・ゲーム)、最終用途(医療、教育・研究)およびセグメント別予測による市場規模、成長と動向分析レポート 2026-2033年
Brain Computer Interface Market Size, Share & Trends Analysis Report By Product (Invasive, Non-invasive), Application (Healthcare, Communication & Control, Entertainment & Gaming), End Use (Medical, Education & Research) And Segment Forecasts, 2026 - 2033
| 出版 | Mordor Intelligence |
| 出版年月 | 2025年12月 |
| ページ数 | 150 |
| 価格 | 記載以外のライセンスについてはお問合せください |
| シングルユーザ | USD 5,950 |
| 種別 | 英文調査報告書 |
| 商品番号 | SMR-12347 |

世界のブレインコンピュータインターフェース(BCI)市場では、侵襲性BCIを考慮すると、2025年の総アドレス可能市場規模(TAM)は1,682.7億米ドルと推定され、2026年から2033年にかけて1.52%のCAGRで成長すると予想されています。いくつかの調査研究によると、侵襲性BCIは、筋萎縮性側索硬化症(ALS)、脊髄損傷、脳卒中などの患者の運動機能とコミュニケーション能力の回復において、より高いレベルの確実性を提供します。
一方、非侵襲性BCIについては、実用可能市場(SOM)は2025年に3億9,759万米ドルと推定され、2026年から2033年にかけて年平均成長率(CAGR)8.73%で成長すると予測されています。市場を牽引する主な要因としては、神経補綴装置を必要とする疾患の増加、世界的な高齢化人口の増加、麻痺患者のコミュニケーションと動作を促進する技術の進歩などが挙げられます。さらに、ホームコントロールシステム、バーチャルゲーム、軍事通信における非侵襲性BCIの普及は、市場の適用性をさらに高め、市場の成長を支えています。
このレポートでは、収益の成長を予測し、2021年から2033年までの各サブセグメントの最新動向を世界、地域、国レベルで分析しています。このレポートでは、Grand View Researchが製品、用途、最終用途、地域に基づいて、世界の脳コンピューターインターフェース市場レポートをセグメント化しています。
Brain Computer Interface Market Summary
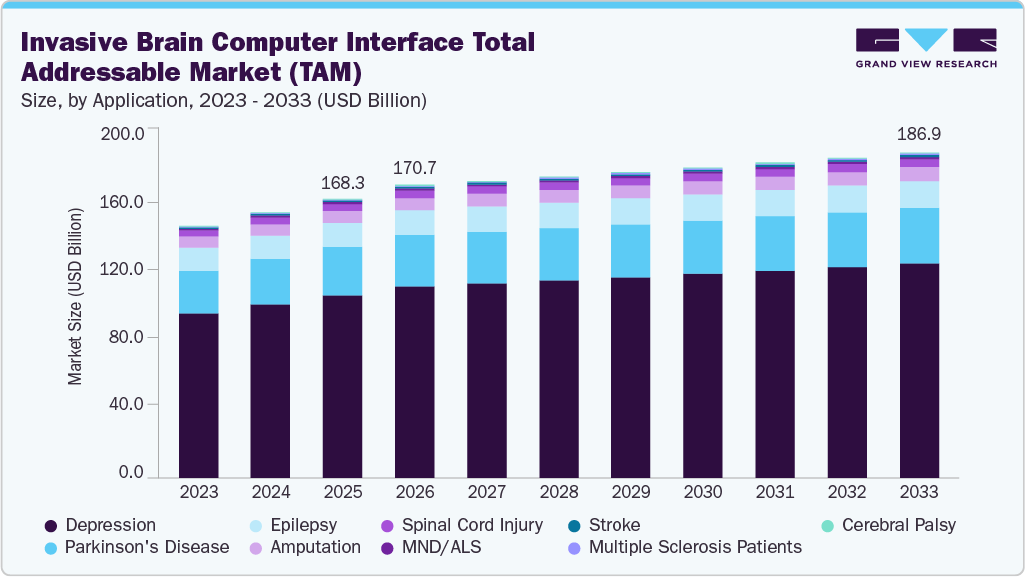
The global brain computer interface (BCI) market, considering invasive BCIs, the total addressable market (TAM) was estimated at USD 168.27 billion in 2025 and is expected to grow at a CAGR of 1.52% from 2026 to 2033. Several research studies indicate that invasive BCIs offer a higher level of assurance in restoring motor function and communication capabilities in patients with conditions such as Amyotrophic Lateral Sclerosis (ALS), spinal cord injuries, and stroke.
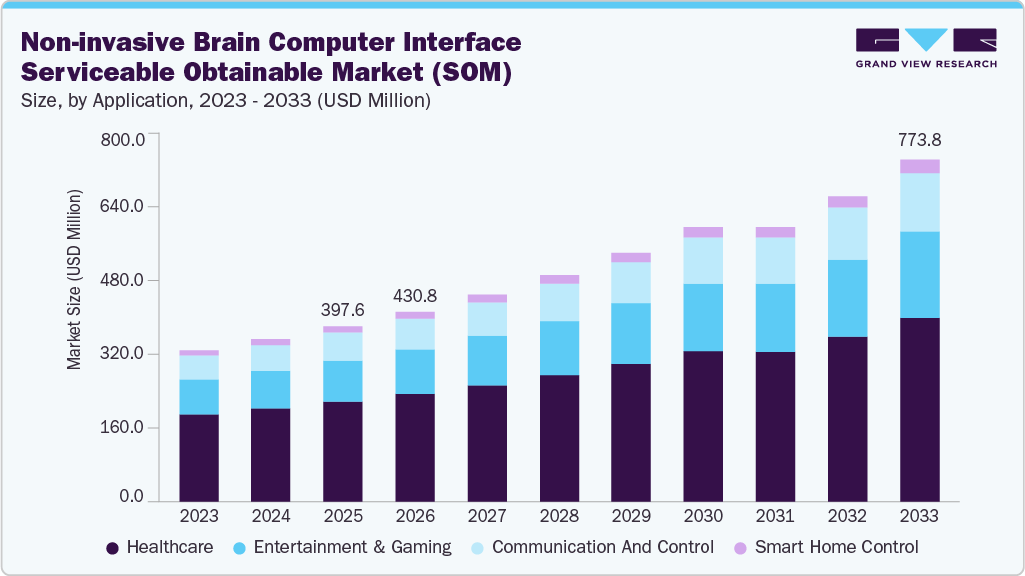
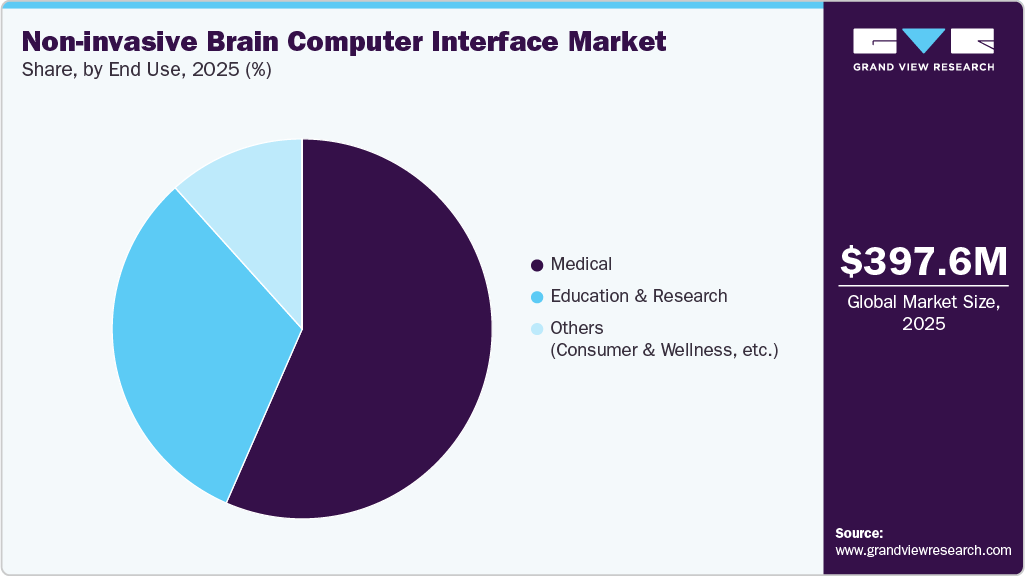
In contrast, considering non-invasive BCIs, the serviceable obtainable market (SOM) was estimated at USD 397.59 million in 2025 and is projected to grow at a CAGR of 8.73% from 2026 to 2033. Key market drivers include the increasing prevalence of conditions requiring neuroprosthetic devices, the rising global geriatric population, and technological advancements that facilitate communication and movement in paralytic patients. Additionally, the expanding use of non-invasive BCIs in home control systems, virtual gaming, and military communication further enhances market applicability, thereby supporting market growth.
BCI technology is primarily utilized in medical and research settings to assist individuals with disabilities in controlling prosthetic limbs or restoring their communication ability. These systems employ electrodes placed on the scalp or implanted in the brain to capture and interpret neural signals, which are then converted into commands for external devices. Recently, advancements in BCI technology have made it more accessible, affordable, and versatile. Consumer-grade BCI devices, such as the Muse and NeuroSky headsets, are available in the market. These headsets utilize wireless dry electrodes that eliminate the need for conductive gel, making them comfortable for users to wear for extended periods. Thus, the availability of such products in the market boosts the market growth.
invasive-brain-computer-interface-total-addressable-market-size
The increasing prevalence of neurodegenerative disorders is a significant driver of growth in the BCI market. Neurodegenerative disorders, such as Alzheimer’s disease, Parkinson’s disease, Amyotrophic Lateral Sclerosis (ALS), and Multiple Sclerosis (MS), are characterized by the progressive degeneration of neurons, leading to a gradual loss of function in the affected areas of the brain and nervous system.
According to the WHO report, around 82 million people will be affected by dementia by 2030 and this number will reach 152 million by 2050. This shows the potential demand for BCI in the coming years. These conditions can severely impact an individual’s motor functions, communication abilities, and overall quality of life. As the global population ages, the incidence of these disorders is expected to rise, creating a pressing need for innovative solutions that can help manage symptoms, restore lost functions, and improve the lives of affected individuals.
Brain Computer Interface Market Report Scope
| Report Attribute | Details |
| Invasive BCI Total Addressable Market (TAM) value in 2026 | USD 170,709.3 million |
| Invasive BCI Total Addressable Market (TAM) value forecast in 2033 | USD 189,718.3 million |
| Non-invasive BCI Market size value in 2026 | USD 430.83 million |
| Non-invasive BCI Revenue forecast in 2033 | USD 773.82 million |
| Invasive BCI Growth Rate | CAGR of 1.52% from 2026 to 2033 |
| Non-invasive BCI Growth Rate | CAGR of 8.73% from 2026 to 2033 |
| Actual data | 2021 – 2025 |
| Forecast period | 2026 – 2033 |
| Quantitative units | Revenue in USD million and CAGR from 2026 to 2033 |
| Report coverage | Revenue forecast, company ranking, competitive landscape, growth factors, and trends |
| Segments covered | Product, application, end use, region |
| Regional scope | North America; Europe; Asia Pacific; Latin America; MEA |
| Country scope | U.S.; Canada; Mexico; U.K.; Germany; France; Italy; Spain; Denmark; Sweden; Norway; China; Japan; India; Australia; South Korea; Thailand; Brazil; Argentina; South Africa; Saudi Arabia; UAE; Kuwait |
| Key companies profiled | Medtronic; g.tec medical engineering GmbH; Natus Medical Incorporated; Compumedics Neuroscan; Brain Products GmbH; Integra LifeSciences Corporation; Advanced Brain Monitoring, Inc.; EMOTIV; NeuroSky; ANT Neuro; NIRx Medical Technologies, LLC; Ripple Neuro.; Neuroelectrics; OpenBCI; COGNIONICS, INC. (CGX); Blackrock Neurotech; Synchron; Neurable |
| Customization scope | Free report customization (equivalent up to 8 analysts working days) with purchase. Addition or alteration to country, regional & segment scope. |
Global Brain Computer Interface Market Report Segmentation
This report forecasts revenue growth and provides at global, regional, and country levels an analysis of the latest trends in each of the sub-segments from 2021 to 2033. For this report, Grand View Research has segmented the global brain computer interface market report based on product, application, end use, and region:
- Brain-Computer Interface (BCI) Product Outlook (Revenue, USD Million, 2021 – 2033)
- Invasive Brain-Computer Interface (BCI) [Total Addressable Market (TAM)]
- Non Invasive Brain-Computer Interface (BCI) [Serviceable Obtainable Market (SOM)]
- Invasive Brain-Computer Interface (BCI) Application Outlook :(Revenue in USD Million; 2021 – 2033) [Total Addressable Market (TAM)]
- MND/ALS
- Stroke
- Spinal Cord Injury
- Multiple Sclerosis Patients
- Cerebral Palsy
- Amputation
- Epilepsy
- Depression
- Parkinson’s Disease
- Non Invasive BCI Application Outlook (Revenue in USD Million; 2021 – 2033) [Serviceable Obtainable Market (SOM)]
- Healthcare
o Disabilities Restoration
o Brain Function Repair
- Smart Home Control
- Communication and control
- Entertainment & Gaming
- Non Invasive BCI End Use Outlook (Revenue in USD Million, 2021 – 2033) [Serviceable Obtainable Market (SOM)]
- Medical
- Education & Research
- Others (Consumer & Wellness, etc.)
- Non Invasive BCI Regional Outlook (Revenue, USD Million, 2021 – 2033) [Serviceable Obtainable Market (SOM)]
- North America
o U.S.
o Canada
o Mexico
- Europe
o UK
o Germany
o France
o Italy
o Spain
o Denmark
o Sweden
o Norway
- Asia Pacific
o Japan
o China
o India
o Australia
o South Korea
o Thailand
- Latin America
o Brazil
o Argentina
- Middle East & Africa
o South Africa
o Saudi Arabia
o UAE
o Kuwait
Table of Contents
Chapter 1. Research Methodology and Scope
1.1. Market Segmentation & Scope
1.1.1. Application
1.1.2. End Use
1.1.3. Regional scope
1.1.4. Estimates and forecast timeline.
1.2. Research Methodology
1.3. Information Procurement
1.3.1. Purchased database.
1.3.2. GVR’s internal database
1.3.3. Secondary sources
1.3.4. Primary research
1.3.5. Details of primary research
1.4. Information or Data Analysis
1.4.1. Data analysis models
1.5. Market Formulation & Validation
1.6. Model Details
1.6.1. Commodity flow analysis (Model 1)
1.6.2. Approach 1: Commodity flow approach
1.7. List of Secondary Sources
1.8. List of Primary Sources
1.9. Objectives
Chapter 2. Executive Summary
2.1. Market Outlook
2.2. Segment Outlook
2.3. Competitive Insights
Chapter 3. Brain Computer Interface Market Variables, Trends & Scope
3.1. Market Dynamics
3.1.1. Market driver analysis
3.1.2. Market restraint analysis
3.1.3. Market Opportunities
3.2. Brain Computer Interface Market Analysis Tools
3.2.1. Industry Analysis – Porter’s
3.2.1.1. Supplier power
3.2.1.2. Buyer power
3.2.1.3. Substitution threat
3.2.1.4. Threat of new entrant
3.2.1.5. Competitive rivalry
3.2.2. PESTEL Analysis
3.2.2.1. Political landscape
3.2.2.2. Economic landscape
3.2.2.3. Social landscape
3.2.2.4. Technological landscape
3.2.2.5. Environmental landscape
3.2.2.6. Legal landscape
3.2.3. Clinical Trial Pipelines in the BCI Technologies
3.2.4. Case Studies
Chapter 4. Invasive Brain-Computer Interface (BCI) Total Addressable Market (TAM) Application Estimates & Trend Analysis
4.1. Application Market Share, 2025 & 2033
4.2. Segment Dashboard
4.3. Global Brain Computer Interface Market by Application Outlook
4.4. MND/ALS
4.4.1. Market estimates and forecast 2021 to 2033 (USD Million)
4.5. Stroke
4.5.1. Market estimates and forecast 2021 to 2033 (USD Million)
4.6. Spinal Cord Injury
4.6.1. Market estimates and forecast 2021 to 2033 (USD Million)
4.7. Multiple Sclerosis Patients
4.7.1. Market estimates and forecast 2021 to 2033 (USD Million)
4.8. Cerebral Palsy
4.8.1. Market estimates and forecast 2021 to 2033 (USD Million)
4.9. Amputation
4.9.1. Market estimates and forecast 2021 to 2033 (USD Million)
4.10. Epilepsy
4.10.1. Market estimates and forecast 2021 to 2033 (USD Million)
4.11. Depression
4.11.1. Market estimates and forecast 2021 to 2033 (USD Million)
4.12. Parkinson’s Disease
4.12.1. Market estimates and forecast 2021 to 2033 (USD Million)
Chapter 5. Non-Invasive Brain Computer Interface Market: Application Estimates & Trend Analysis
5.1. Indication Market Share, 2025 & 2033
5.2. Segment Dashboard
5.3. Global Brain Computer Interface Market by Indication Outlook
5.4. Healthcare
5.4.1. Market estimates and forecast 2021 to 2033 (USD Million)
5.4.2. Disabilities Restoration
5.4.3. Market estimates and forecast 2021 to 2033 (USD Million)
5.4.4. Brain Function Repair
5.4.5. Market estimates and forecast 2021 to 2033 (USD Million)
5.5. Smart Home Control
5.5.1. Market estimates and forecast 2021 to 2033 (USD Million)
5.6. Communication and control
5.6.1. Market estimates and forecast 2021 to 2033 (USD Million)
5.7. Entertainment & Gaming
5.7.1. Market estimates and forecast 2021 to 2033 (USD Million)
Chapter 6. Non-Invasive Brain Computer Interface Market: End Use Estimates & Trend Analysis
6.1. End Use Market Share, 2025 & 2033
6.2. Segment Dashboard
6.3. Global Brain Computer Interface Market by End Use Outlook
6.4. Medical
6.4.1. Market estimates and forecast 2021 to 2033 (USD Million)
6.5. Education & Research
6.5.1. Market estimates and forecast 2021 to 2033 (USD Million)
6.6. Others
6.6.1. Market estimates and forecast 2021 to 2033 (USD Million)
Chapter 7. Non-Invasive Brain Computer Interface Market: Regional Estimates & Trend Analysis, By Type
7.1. Regional Market Share Analysis, 2025 & 2033
7.2. Regional Market Dashboard
7.3. Global Regional Market Snapshot
7.4. Market Size, & Forecasts Trend Analysis, 2021 to 2033:
7.5. North America
7.5.1. U.S.
7.5.1.1. Key country dynamics
7.5.1.2. Regulatory framework/ reimbursement structure
7.5.1.3. Competitive scenario
7.5.1.4. U.S. market estimates and forecasts 2021 to 2033 (USD Million)
7.5.2. Canada
7.5.2.1. Key country dynamics
7.5.2.2. Regulatory framework/ reimbursement structure
7.5.2.3. Competitive scenario
7.5.2.4. Canada market estimates and forecasts 2021 to 2033 (USD Million)
7.5.3. Mexico
7.5.3.1. Key country dynamics
7.5.3.2. Regulatory framework/ reimbursement structure
7.5.3.3. Competitive scenario
7.5.3.4. Canada market estimates and forecasts 2021 to 2033 (USD Million)
7.6. Europe
7.6.1. UK
7.6.1.1. Key country dynamics
7.6.1.2. Regulatory framework/ reimbursement structure
7.6.1.3. Competitive scenario
7.6.1.4. UK market estimates and forecasts 2021 to 2033 (USD Million)
7.6.2. Germany
7.6.2.1. Key country dynamics
7.6.2.2. Regulatory framework/ reimbursement structure
7.6.2.3. Competitive scenario
7.6.2.4. Germany market estimates and forecasts 2021 to 2033 (USD Million)
7.6.3. France
7.6.3.1. Key country dynamics
7.6.3.2. Regulatory framework/ reimbursement structure
7.6.3.3. Competitive scenario
7.6.3.4. France market estimates and forecasts 2021 to 2033 (USD Million)
7.6.4. Italy
7.6.4.1. Key country dynamics
7.6.4.2. Regulatory framework/ reimbursement structure
7.6.4.3. Competitive scenario
7.6.4.4. Italy market estimates and forecasts 2021 to 2033 (USD Million)
7.6.5. Spain
7.6.5.1. Key country dynamics
7.6.5.2. Regulatory framework/ reimbursement structure
7.6.5.3. Competitive scenario
7.6.5.4. Spain market estimates and forecasts 2021 to 2033 (USD Million)
7.6.6. Norway
7.6.6.1. Key country dynamics
7.6.6.2. Regulatory framework/ reimbursement structure
7.6.6.3. Competitive scenario
7.6.6.4. Norway market estimates and forecasts 2021 to 2033 (USD Million)
7.6.7. Sweden
7.6.7.1. Key country dynamics
7.6.7.2. Regulatory framework/ reimbursement structure
7.6.7.3. Competitive scenario
7.6.7.4. Sweden market estimates and forecasts 2021 to 2033 (USD Million)
7.6.8. Denmark
7.6.8.1. Key country dynamics
7.6.8.2. Regulatory framework/ reimbursement structure
7.6.8.3. Competitive scenario
7.6.8.4. Denmark market estimates and forecasts 2021 to 2033 (USD Million)
7.7. Asia Pacific
7.7.1. Japan
7.7.1.1. Key country dynamics
7.7.1.2. Regulatory framework/ reimbursement structure
7.7.1.3. Competitive scenario
7.7.1.4. Japan market estimates and forecasts 2021 to 2033 (USD Million)
7.7.2. China
7.7.2.1. Key country dynamics
7.7.2.2. Regulatory framework/ reimbursement structure
7.7.2.3. Competitive scenario
7.7.2.4. China market estimates and forecasts 2021 to 2033 (USD Million)
7.7.3. India
7.7.3.1. Key country dynamics
7.7.3.2. Regulatory framework/ reimbursement structure
7.7.3.3. Competitive scenario
7.7.3.4. India market estimates and forecasts 2021 to 2033 (USD Million)
7.7.4. Australia
7.7.4.1. Key country dynamics
7.7.4.2. Regulatory framework/ reimbursement structure
7.7.4.3. Competitive scenario
7.7.4.4. Australia market estimates and forecasts 2021 to 2033 (USD Million)
7.7.5. South Korea
7.7.5.1. Key country dynamics
7.7.5.2. Regulatory framework/ reimbursement structure
7.7.5.3. Competitive scenario
7.7.5.4. South Korea market estimates and forecasts 2021 to 2033 (USD Million)
7.7.6. Thailand
7.7.6.1. Key country dynamics
7.7.6.2. Regulatory framework/ reimbursement structure
7.7.6.3. Competitive scenario
7.7.6.4. Singapore market estimates and forecasts 2021 to 2033 (USD Million)
7.8. Latin America
7.8.1. Brazil
7.8.1.1. Key country dynamics
7.8.1.2. Regulatory framework/ reimbursement structure
7.8.1.3. Competitive scenario
7.8.1.4. Brazil market estimates and forecasts 2021 to 2033 (USD Million)
7.8.2. Argentina
7.8.2.1. Key country dynamics
7.8.2.2. Regulatory framework/ reimbursement structure
7.8.2.3. Competitive scenario
7.8.2.4. Argentina market estimates and forecasts 2021 to 2033 (USD Million)
7.9. MEA
7.9.1. South Africa
7.9.1.1. Key country dynamics
7.9.1.2. Regulatory framework/ reimbursement structure
7.9.1.3. Competitive scenario
7.9.1.4. South Africa market estimates and forecasts 2021 to 2033 (USD Million)
7.9.2. Saudi Arabia
7.9.2.1. Key country dynamics
7.9.2.2. Regulatory framework/ reimbursement structure
7.9.2.3. Competitive scenario
7.9.2.4. Saudi Arabia market estimates and forecasts 2021 to 2033 (USD Million)
7.9.3. UAE
7.9.3.1. Key country dynamics
7.9.3.2. Regulatory framework/ reimbursement structure
7.9.3.3. Competitive scenario
7.9.3.4. UAE market estimates and forecasts 2021 to 2033 (USD Million)
7.9.4. Kuwait
7.9.4.1. Key country dynamics
7.9.4.2. Regulatory framework/ reimbursement structure
7.9.4.3. Competitive scenario
7.9.4.4. Kuwait market estimates and forecasts 2021 to 2033 (USD Million)
Chapter 8. Competitive Landscape
8.1. Recent Developments & Impact Analysis, By Key Market Participants
8.2. Company/Competition Categorization
8.3. Key company market share/position analysis, 2025
8.4. Company Profiles
8.4.1. Medtronic
8.4.1.1. Company overview
8.4.1.2. Financial performance
8.4.1.3. Technology Type benchmarking
8.4.1.4. Strategic initiatives
8.4.2. G.Tec medical engineering GmbH
8.4.2.1. Company overview
8.4.2.2. Financial performance
8.4.2.3. Technology Type benchmarking
8.4.2.4. Strategic initiatives
8.4.3. Natus Medical Incorporated
8.4.3.1. Company overview
8.4.3.2. Financial performance
8.4.3.3. Technology Type benchmarking
8.4.3.4. Strategic initiatives
8.4.4. Compumedics Neuroscan
8.4.4.1. Company overview
8.4.4.2. Financial performance
8.4.4.3. Technology Type benchmarking
8.4.4.4. Strategic initiatives
8.4.5. Brain Products GmbH
8.4.5.1. Company overview
8.4.5.2. Financial performance
8.4.5.3. Technology Type benchmarking
8.4.5.4. Strategic initiatives
8.4.6. Integra LifeSciences Corporation
8.4.6.1. Company overview
8.4.6.2. Financial performance
8.4.6.3. Technology Type benchmarking
8.4.6.4. Strategic initiatives
8.4.7. Advanced Brain Monitoring, Inc.
8.4.7.1. Company overview
8.4.7.2. Financial performance
8.4.7.3. Technology Type benchmarking
8.4.7.4. Strategic initiatives
8.4.8. EMOTIV
8.4.8.1. Company overview
8.4.8.2. Financial performance
8.4.8.3. Technology Type benchmarking
8.4.8.4. Strategic initiatives
8.4.9. NeuroSky
8.4.9.1. Company overview
8.4.9.2. Financial performance
8.4.9.3. Technology Type benchmarking
8.4.9.4. Strategic initiatives
8.4.10. ANT Neuro
8.4.10.1. Company overview
8.4.10.2. Financial performance
8.4.10.3. Technology Type benchmarking
8.4.10.4. Strategic initiatives
8.4.11. NIRx Medical Technologies, LLC
8.4.11.1. Company overview
8.4.11.2. Financial performance
8.4.11.3. Technology Type benchmarking
8.4.11.4. Strategic initiatives
8.4.12. Ripple Neuro.
8.4.12.1. Company overview
8.4.12.2. Financial performance
8.4.12.3. Technology Type benchmarking
8.4.12.4. Strategic initiatives
8.4.13. Neuroelectrics
8.4.13.1. Company overview
8.4.13.2. Financial performance
8.4.13.3. Technology Type benchmarking
8.4.13.4. Strategic initiatives
8.4.14. OpenBCI
8.4.14.1. Company overview
8.4.14.2. Financial performance
8.4.14.3. Technology Type benchmarking
8.4.14.4. Strategic initiatives
8.4.15. COGNIONICS, INC. (CGX)
8.4.15.1. Company overview
8.4.15.2. Financial performance
8.4.15.3. Technology Type benchmarking
8.4.15.4. Strategic initiatives
8.4.16. Blackrock Neurotech
8.4.16.1. Company overview
8.4.16.2. Financial performance
8.4.16.3. Technology Type benchmarking
8.4.16.4. Strategic initiatives
8.4.17. Synchron
8.4.17.1. Company overview
8.4.17.2. Financial performance
8.4.17.3. Technology Type benchmarking
8.4.17.4. Strategic initiatives
8.4.18. Neurable
8.4.18.1. Company overview
8.4.18.2. Financial performance
8.4.18.3. Technology Type benchmarking
8.4.18.4. Strategic initiatives
List of Tables
Table 1 List of secondary sources
Table 2 List of abbreviation
Table 3 North America brain computer interface market, by region, 2021 – 2033 (USD Million)
Table 4 North America brain computer interface market, by product, 2021 – 2033 (USD Million)
Table 5 North America brain computer interface market, by application, 2021 – 2033 (USD Million)
Table 6 North America brain computer interface market, by end use, 2021 – 2033 (USD Million)
Table 7 U.S. brain computer interface market, by application, 2021 – 2033 (USD Million)
Table 8 U.S. brain computer interface market, by end use, 2021 – 2033 (USD Million)
Table 9 Canada brain computer interface market, by application, 2021 – 2033 (USD Million)
Table 10 Canada brain computer interface market, by end use, 2021 – 2033 (USD Million)
Table 11 Mexico brain computer interface market, by application, 2021 – 2033 (USD Million)
Table 12 Mexico brain computer interface market, by end use, 2021 – 2033 (USD Million)
Table 13 Europe brain computer interface market, by region, 2021 – 2033 (USD Million)
Table 14 Europe brain computer interface market, by product, 2021 – 2033 (USD Million)
Table 15 Europe brain computer interface market, by application, 2021 – 2033 (USD Million)
Table 16 Europe brain computer interface market, by end use, 2021 – 2033 (USD Million)
Table 17 Germany brain computer interface market, by product, 2021 – 2033 (USD Million)
Table 18 Germany brain computer interface market, by application, 2021 – 2033 (USD Million)
Table 19 Germany brain computer interface market, by end use, 2021 – 2033 (USD Million)
Table 20 UK brain computer interface market, by application, 2021 – 2033 (USD Million)
Table 21 UK brain computer interface market, by end use, 2021 – 2033 (USD Million)
Table 22 France brain computer interface market, by application, 2021 – 2033 (USD Million)
Table 23 France brain computer interface market, by end use, 2021 – 2033 (USD Million)
Table 24 Italy brain computer interface market, by application, 2021 – 2033 (USD Million)
Table 25 Italy brain computer interface market, by end use, 2021 – 2033 (USD Million)
Table 26 Spain brain computer interface market, by application, 2021 – 2033 (USD Million)
Table 27 Spain brain computer interface market, by end use, 2021 – 2033 (USD Million)
Table 28 Denmark brain computer interface market, by application, 2021 – 2033 (USD Million)
Table 29 Denmark brain computer interface market, by end use, 2021 – 2033 (USD Million)
Table 30 Sweden brain computer interface market, by application, 2021 – 2033 (USD Million)
Table 31 Sweden brain computer interface market, by end use, 2021 – 2033 (USD Million)
Table 32 Norway brain computer interface market, by application, 2021 – 2033 (USD Million)
Table 33 Norway brain computer interface market, by end use, 2021 – 2033 (USD Million)
Table 34 Asia Pacific brain computer interface market, by region, (USD Million) 2021 –
Table 35 Asia Pacific brain computer interface market, by application, 2021 – 2033 (USD Million)
Table 36 Asia Pacific brain computer interface market, by end use, 2021 – 2033 (USD Million)
Table 37 China brain computer interface market, by application, 2021 – 2033 (USD Million)
Table 38 China brain computer interface market, by end use, 2021 – 2033 (USD Million)
Table 39 Japan brain computer interface market, by application, 2021 – 2033 (USD Million)
Table 40 Japan brain computer interface market, by end use, 2021 – 2033 (USD Million)
Table 41 India brain computer interface market, by application, 2021 – 2033 (USD Million)
Table 42 India brain computer interface market, by end use, (USD Million) 2021 – 203
Table 43 South Korea brain computer interface market, by application, 2021 – 2033 (USD Million)
Table 44 South Korea brain computer interface market, by end use, 2021 – 2033 (USD Million)
Table 45 Australia brain computer interface market, by application, 2021 – 2033 (USD Million)
Table 46 Australia brain computer interface market, by end use, 2021 – 2033 (USD Million)
Table 47 Thailand brain computer interface market, by application, 2021 – 2033 (USD Million)
Table 48 Thailand brain computer interface market, by end use, 2021 – 2033 (USD Million)
Table 49 Latin America brain computer interface market, by region, 2021 – 2033 (USD Million)
Table 50 Latin America brain computer interface market, by product, 2021 – 2033 (USD Million)
Table 51 Latin America brain computer interface market, by application, 2021 – 2033 (USD Million)
Table 52 Latin America brain computer interface market, by end use, 2021 – 2033 (USD Million)
Table 53 Brazil brain computer interface market, by application, 2021 – 2033 (USD Million)
Table 54 Brazil brain computer interface market, by end use, 2021 – 2033 (USD Million)
Table 55 Argentina brain computer interface market, by application, 2021 – 2033 (USD Million)
Table 56 Argentina brain computer interface market, by end use, 2021 – 2033 (USD Million)
Table 57 MEA brain computer interface market, by region, 2021 – 2033 (USD Million)
Table 58 MEA brain computer interface market, by product, 2021 – 2033 (USD Million)
Table 59 MEA brain computer interface market, by application, 2021 – 2033 (USD Million)
Table 60 MEA brain computer interface market, by end use, 2021 – 2033 (USD Million)
Table 61 South Africa brain computer interface market, by application, 2021 – 2033 (USD Million)
Table 62 South Africa brain computer interface market, by end use, 2021 – 2033 (USD Million)
Table 63 Saudi Arabia brain computer interface market, by application, 2021 – 2033 (USD Million)
Table 64 Saudi Arabia brain computer interface market, by end use, 2021 – 2033 (USD Million)
Table 65 UAE brain computer interface market, by application, 2021 – 2033 (USD Million)
Table 66 UAE brain computer interface market, by end use, 2021 – 2033 (USD Million)
Table 67 Kuwait brain computer interface market, by application, 2021 – 2033 (USD Million)
Table 68 Kuwait brain computer interface market, by end use, 2021 – 2033 (USD Million)
List of Figures
Fig. 1 Brain computer devices market segmentation
Fig. 2 Market research process
Fig. 3 Data triangulation techniques
Fig. 4 Primary research pattern
Fig. 5 Market research approaches
Fig. 6 Value-chain-based sizing & forecasting
Fig. 7 Market formulation & validation
Fig. 10 Non-invasive BCI segment snapshot
Fig. 12 Invasive BCI segment snapshot
Fig. 14 Brain computer interface market dynamics
Fig. 15 Emerging trends & technologies
Fig. 16 Brain computer interface market: PESTLE analysis
Fig. 17 Brain computer interface market: Porter’s five forces analysis
Fig. 18 Non-Invasive Brain computer interface Serviceable Obtainable Market (SOM), Application outlook key takeaways (USD Million)
Fig. 19 Non-Invasive Brain computer interface Serviceable Obtainable Market (SOM): Application movement analysis, 2025 & 2033
Fig. 20 Healthcare Serviceable Obtainable Market (SOM) estimates and forecasts, 2021 – 2033 (USD Million)
Fig. 21 Disabilities restoration Serviceable Obtainable Market (SOM) estimates and forecasts, 2021 – 2033 (USD Million)
Fig. 22 Brain function repair Serviceable Obtainable Market (SOM) estimates and forecasts, 2021 – 2033 (USD Million)
Fig. 23 Smart home control Serviceable Obtainable Market (SOM) estimates and forecasts, 2021 – 2033 (USD Million)
Fig. 24 Communication and control Serviceable Obtainable Market (SOM) estimates and forecasts, 2021 – 2033 (USD Million)
Fig. 25 Entertainment & Gaming Serviceable Obtainable Market (SOM) estimates and forecasts, 2021 – 2033 (USD Million)
Fig. 26 Non-Invasive Brain computer interface Serviceable Obtainable Market (SOM), End Use outlook key takeaways (USD million)
Fig. 27 Non-Invasive Brain computer interface Serviceable Obtainable Market (SOM): End use movement analysis, 2025 & 2033 (USD Million)
Fig. 28 Medical market estimates and forecasts, 2021 – 2033 (USD Million)
Fig. 29 Education and research Serviceable Obtainable Market (SOM) estimates and forecasts, 2021 – 2033 (USD Million)
Fig. 30 Others Serviceable Obtainable Market (SOM) estimates and forecasts, 2021 – 2033 (USD Million)
Fig. 31 Invasive brain computer interface Total Addressable Market (TAM), application outlook key takeaways (USD Billion)
Fig. 32 Invasive brain computer interface Total addressable market (TAM): Application movement analysis, 2025 & 2033
Fig. 33 MND/ALS Total Addressable Market (TAM) estimates and forecasts, 2021 – 2033 (USD Million)
Fig. 34 Stroke Total Addressable Market (TAM) estimates and forecasts, 2021 – 2033 (USD Million)
Fig. 35 Spinal cord injury Total Addressable Market (TAM) estimates and forecasts, 2021 – 2033 (USD Million)
Fig. 36 Multiple sclerosis Total Addressable Market (TAM) estimates and forecasts, 2021 – 2033 (USD Million)
Fig. 37 Cerebral palsy Total Addressable Market (TAM) estimates and forecasts, 2021 – 2033 (USD Million)
Fig. 38 Amputation Total Addressable Market (TAM) estimates and forecasts, 2021 – 2033 (USD Million)
Fig. 39 Epilepsy Total Addressable Market (TAM) estimates and forecasts, 2021 – 2033 (USD Million)
Fig. 40 Depression Total Addressable Market (TAM) estimates and forecasts, 2021 – 2033 (USD Million)
Fig. 41 Non-invasive brain computer interface serviceable obtainable market (SOM), by region
Fig. 42 Non-invasive brain computer interface serviceable obtainable market (SOM): Regional marketplace key takeaways (Part 1)
Fig. 43 Non-invasive brain computer interface serviceable obtainable market (SOM): Regional marketplace key takeaways (Part 2)
Fig. 44 Invasive brain computer interface Total Addressable Market (TAM), by region
Fig. 45 North America Non-invasive Brain Computer Interface Serviceable Obtainable Market (SOM), 2021 – 2033 (USD Million)
Fig. 46 North America Invasive Brain Computer Interface Total Addressable Market (TAM), 2021 – 2033 (USD Million)
Fig. 47 Key country dynamics
Fig. 48 U.S. Non-invasive Brain Computer Interface Serviceable Obtainable Market (SOM), 2021 – 2033 (USD Million)
Fig. 49 Key country dynamics
Fig. 50 Canada Non-invasive Brain Computer Interface Serviceable Obtainable Market (SOM), 2021 – 2033 (USD Million)
Fig. 51 Key country dynamics
Fig. 52 Mexico Non-invasive Brain Computer Interface Serviceable Obtainable Market (SOM), 2021 – 2033 (USD Million)
Fig. 53 Europe Non-invasive Brain Computer Interface Serviceable Obtainable Market (SOM), 2021 – 2033 (USD Million)
Fig. 54 Europe Invasive Brain Computer Interface Total Addressable Market (TAM), 2021 – 2033 (USD Million)
Fig. 55 Key country dynamics
Fig. 56 UK: Non-invasive Brain Computer Interface Serviceable Obtainable Market (SOM), 2021 – 2033 (USD Million)
Fig. 57 Key country dynamics
Fig. 58 Germany Non-invasive Brain Computer Interface Serviceable Obtainable Market (SOM), 2021 – 2033 (USD Million)
Fig. 59 Key country dynamics
Fig. 60 France Non-invasive Brain Computer Interface Serviceable Obtainable Market (SOM), 2021 – 2033 (USD Million)
Fig. 61 Key country dynamics
Fig. 62 Italy Non-invasive Brain Computer Interface Serviceable Obtainable Market (SOM), 2021 – 2033 (USD Million)
Fig. 63 Key country dynamics
Fig. 64 Spain Non-invasive Brain Computer Interface Serviceable Obtainable Market (SOM), 2021 – 2033 (USD Million)
Fig. 65 Key country dynamics
Fig. 66 Norway Non-invasive Brain Computer Interface Serviceable Obtainable Market (SOM), 2021 – 2033 (USD Million)
Fig. 67 Key country dynamics
Fig. 68 Sweden Non-invasive Brain Computer Interface Serviceable Obtainable Market (SOM), 2021 – 2033 (USD Million)
Fig. 69 Key country dynamics
Fig. 70 Denmark Non-invasive Brain Computer Interface Serviceable Obtainable Market (SOM), 2021 – 2033 (USD Million)
Fig. 71 Asia Pacific Non-invasive Brain Computer Interface Serviceable Obtainable Market (SOM), 2021 – 2033 (USD Million)
Fig. 72 Asia Pacific Invasive Brain Computer Interface Total Addressable Market (TAM), 2021 – 2033 (USD Million)
Fig. 73 Key country dynamics
Fig. 74 Japan Non-invasive Brain Computer Interface Serviceable Obtainable Market (SOM), 2021 – 2033 (USD Million)
Fig. 75 Key country dynamics
Fig. 76 China Non-invasive Brain Computer Interface Serviceable Obtainable Market (SOM), 2021 – 2033 (USD Million)
Fig. 77 Key country dynamics
Fig. 78 India Non-invasive Brain Computer Interface Serviceable Obtainable Market (SOM), 2021 – 2033 (USD Million)
Fig. 79 Key country dynamics
Fig. 80 Australia Non-invasive Brain Computer Interface Serviceable Obtainable Market (SOM), 2021 – 2033 (USD Million)
Fig. 81 Key country dynamics
Fig. 82 South Korea Non-invasive Brain Computer Interface Serviceable Obtainable Market (SOM), 2021 – 2033 (USD Million)
Fig. 83 Key country dynamics
Fig. 84 Thailand Non-invasive Brain Computer Interface Serviceable Obtainable Market (SOM), 2021 – 2033 (USD Million)
Fig. 85 Latin America Non-invasive Brain Computer Interface Serviceable Obtainable Market (SOM), 2021 – 2033 (USD Million)
Fig. 86 Latin America Invasive Brain Computer Interface Total Addressable Market (TAM), 2021 – 2033 (USD Million)
Fig. 87 Key country dynamics
Fig. 88 Brazil Non-invasive Brain Computer Interface Serviceable Obtainable Market (SOM), 2021 – 2033 (USD Million)
Fig. 89 Key country dynamics
Fig. 90 Argentina Non-invasive Brain Computer Interface Serviceable Obtainable Market (SOM), 2021 – 2033 (USD Million)
Fig. 91 MEA Non-invasive Brain Computer Interface Serviceable Obtainable Market (SOM), 2021 – 2033 (USD Million)
Fig. 92 MEA Invasive Brain Computer Interface Total Addressable Market (TAM), 2021 – 2033 (USD Million)
Fig. 93 Key country dynamics
Fig. 94 South Africa Non-invasive Brain Computer Interface Serviceable Obtainable Market (SOM), 2021 – 2033 (USD Million)
Fig. 95 Key country dynamics
Fig. 96 Saudi Arabia Non-invasive Brain Computer Interface Serviceable Obtainable Market (SOM), 2021 – 2033 (USD Million)
Fig. 97 Key country dynamics
Fig. 98 UAE Non-invasive Brain Computer Interface Serviceable Obtainable Market (SOM), 2021 – 2033 (USD Million)
Fig. 99 Key country dynamics
Fig. 100 Kuwait Non-invasive Brain Computer Interface Serviceable Obtainable Market (SOM), 2021 – 2033 (USD Million)
Fig. 101 Key company categorization
Fig. 102 Key company categorization
Fig. 103 Y-o-Y funding trends in brain computer interface industry in Millions
Fig. 104 Y-o-Y funding rounds in brain computer interface industry
Fig. 105 Top Funding Rounds in last 2 years Part I
Fig. 106 Top Funding Rounds in last 2 years Part II
Fig. 107 Funding by geography in brain computer interface industry in Millions
Fig. 108 Y-o-Y stage-wise funding trends in brain computer interface industry in Millions
Fig. 109 Y-o-Y stage-wise funding trends in brain computer interface industry (Stage-wise number of rounds)
Fig. 110 Y-o-Y number of active investors in brain computer interface industry
Fig. 111 Company market position analysis
Fig. 112 Strategy mapping