Catalyst Market Size, Share & Trends Analysis Report
触媒市場 - 原材料(化合物、金属、ゼオライト)、用途別(不均一触媒、均一触媒)、地域、セグメント別予測による市場規模、成長と動向分析レポート 2026-2033年
Catalyst Market Size, Share & Trends Analysis Report By Raw Material (Chemical compounds, Metals, Zeolites), By Application (Heterogeneous Catalyst, Homogeneous Catalyst), By Region, And Segment Forecasts, 2026 - 2033
| 出版 | Grand View Research |
| 出版年月 | 2025年12月 |
| ページ数 | 80 |
| 価格 | 記載以外のライセンスについてはお問合せください |
| シングルユーザ | USD 5,950 |
| 種別 | 英文調査報告書 |
| 商品番号 | SMR-12272 |

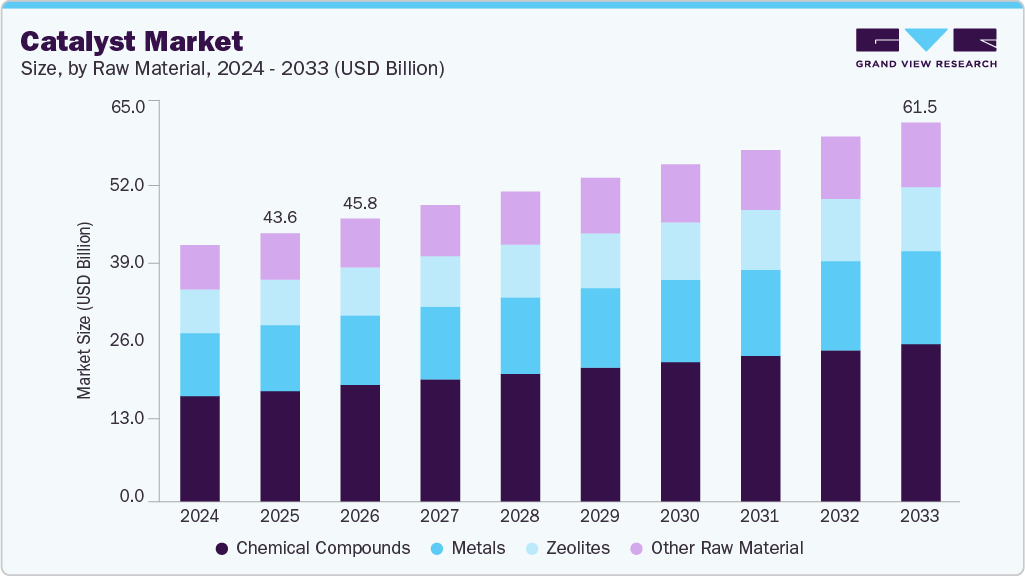
世界の触媒市場規模は、2025年に436億米ドルと推定され、2033年には615億米ドルに達すると予測されており、2026年から2033年にかけて4.3%のCAGRで成長します。化学、精製、環境プロセスでは、より高い効率、より低い排出量、およびより優れた選択性が求められるため、触媒の需要が高まっています。イノベーターは、プロセスの強化、資源の保全、厳格化する環境基準への準拠を可能にするカスタマイズされた材料と配合を提供し、触媒は、重工業の世界中の産業エコシステム全体にわたる脱炭素化と循環性の取り組みの中心となっています。
この成長は、石油化学製品の処理量拡大、製油所の近代化、そして特殊な触媒化学を必要とする低炭素原料への移行を反映しています。医薬品および特殊化学品における排出規制の厳格化と純度への要求水準の高まりにより、副産物を最小限に抑えながら収率を向上させる触媒への需要が高まっています。担体、合金化、リサイクル性に関する材料科学の取り組みにより、総所有コストは削減され、また、業界の連続製造への移行により、反応器の性能とプロセス統合を向上させる、設計された粒子サイズと構造化媒体が有利になっています。
Catalyst Market Summary
The global catalyst market size was estimated at USD 43.6 billion in 2025 and is projected to reach USD 61.5 billion by 2033, growing at a CAGR of 4.3% from 2026 to 2033. Demand for catalysts rises as chemical, refining, and environmental processes require higher efficiency, lower emissions, and improved selectivity; innovators deliver tailored materials and formulations that enable process intensification, resource conservation, and compliance with tightening environmental standards, making catalysts central to decarbonization and circularity efforts across heavy industries worldwide industrial ecosystems.
Growth reflects expanding petrochemical throughput, refinery modernization, and a transition toward lower-carbon feedstocks that demand specialized catalytic chemistry. Stricter emissions protocols and higher purity expectations in pharmaceuticals and specialty chemicals increase preference for catalysts that minimize by-products while boosting yield. Material science efforts in supports, alloying, and recyclability have reduced total ownership costs, and the industry’s move to continuous manufacturing favors engineered particle sizes and structured media that improve reactor performance and process integration.
The sector faces challenges from volatile precious-metal markets and feedstock price swings that pressure margins and encourage substitution strategies. Long qualification timelines slow adoption in risk-averse plants, and regional regulatory divergence fragments demand patterns, forcing more tailored commercial approaches. Strong intellectual property protections and proprietary formulations preserve competitive differentiation, prompting collaborative research with industrial partners. At the same time, advances in regeneration and lifetime extension reduce downtime and improve lifecycle economics, reshaping procurement and service models across applications.
Opportunities concentrate around low-carbon process routes where catalysts enabling hydrogen production, CO₂ conversion, and electrified chemistries attract investment. Circularity initiatives expand the need for catalysts that support polymer depolymerization, chemical recycling, and material recovery from waste streams. Pharmaceutical and fine-chemical makers adopting continuous flow processes demand high-selectivity systems and supported precious-metal grades. Emerging areas such as bio-derived chemicals and fuel cells require bespoke materials and long-term development partnerships, while policy support for clean fuels and emissions reduction encourages pilot projects and early commercial deployments, positioning catalyst developers for steady, innovation-led expansion.
Catalyst Market Report Scope
| Report Attribute | Details |
| Market size value in 2026 | USD 45.8 billion |
| Revenue forecast in 2033 | USD 61.5 billion |
| Growth rate | CAGR of 4.3% from 2026 to 2033 |
| Base year for estimation | 2025 |
| Historical data | 2018 – 2023 |
| Forecast period | 2026 – 2033 |
| Quantitative units | Revenue in USD billion, Volume in Kilotons, and CAGR from 2026 to 2033 |
| Report coverage | Revenue forecast, company ranking, competitive landscape, growth factors, and trends |
| Segments covered | Raw material, application, region |
| Regional scope | North America; Europe; Asia Pacific; Latin America; Middle East & Africa |
| Country scope | U.S.; Canada; Mexico; Brazil; Argentina; Germany; UK; Italy; Spain; France; China; India; Japan; South Korea; Saudi Arabia; South Africa |
| Key companies profiled | Albemarle Corporation; Haldor Topsoe A/S; BASF SE; Evonik Industries AG; LyondellBasell Industries Holdings B.V.; Arkema; The Dow Chemical Company; W. R. Grace & Co.-Conn.; Johnson Matthey; Axens; Honeywell UOP; Zeolyst International; Clariant, Umicore; Exxon Mobil Corporation |
| Customization scope | Free report customization (equivalent to up to 8 analysts’ working days) with purchase. Addition or alteration to country, regional & segment scope. |
Global Catalyst Market Report Segmentation
This report forecasts revenue growth at global, regional, and country levels and provides an analysis of the latest industry trends in each of the sub-segments from 2018 to 2033. For this study, Grand View Research has segmented the global catalyst market report based on raw material, application, and region
• Product Outlook (Revenue, USD Billion; Volume, Kilotons; 2021 – 2033)
• Chemical compounds
o Peroxides
o Acids
o Amines & others
• Metals
o Precious metals
o Base metals
• Zeolites
• Other Raw Material
• Application Outlook (Revenue, USD Billion; Volume, Kilotons; 2021 – 2033)
• Heterogeneous Catalyst
o Chemical synthesis
o Chemical catalysts
o Adsorbents
o Syngas production
o Others
o Petroleum refining
o FCC
o Alkylation
o Hydrotreating
o Catalytic Reforming
o Purification
o Bed grading
o Others
o Polymers and petrochemicals
o Ziegler Natta
o Reaction Initiator
o Chromium
o Urethane
o Solid Phosphorous Acid catalyst
o Others
o Environmental
o Light-duty vehicles
o Motorcycles
o Heavy-duty vehicles
o Others
• Homogeneous Catalyst
o Chemical synthesis
o Chemical catalysts
o Adsorbents
o Syngas production
o Others
o Petroleum refining
o FCC
o Alkylation
o Hydrotreating
o Catalytic Reforming
o Bed grading
o Purification
o Others
o Polymers and petrochemicals
o Ziegler Natta
o Reaction Initiator
o Chromium
o Urethane
o Solid Phosphorous Acid catalyst
o Others
o Environmental
o Light-duty vehicles
o Motorcycles
o Heavy-duty vehicles
o Others
• Regional Outlook (Revenue, USD Billion; Volume, Kilotons; 2021 – 2033)
• North America
o U.S.
o Canada
o Mexico
• Latin America
o Brazil
o Argentina
• Europe
o Germany
o UK
o Italy
o Spain
o France
• Asia Pacific
o China
o India
o Japan
o South Korea
• Middle East & Africa
o Saudi Arabia
o South Africa
Table of Contents
Chapter 1. Methodology and Scope
1.1. Market Segmentation & Scope
1.2. Market Definition
1.3. Information Procurement
1.3.1. Purchased Database
1.3.2. GVR’s Internal Database
1.3.3. Secondary Sources & Third-Party Perspectives
1.3.4. Primary Research
1.4. Information Analysis
1.4.1. Data Analysis Models
1.5. Market Formulation & Data Visualization
1.6. Data Validation & Publishing
Chapter 2. Executive Summary
2.1. Market Snapshot
2.2. Segment Snapshot
2.3. Competitive Landscape Snapshot
Chapter 3. Catalyst Market Variables, Trends & Scope
3.1. Market Lineage Outlook
3.1.1. Catalyst Market Outlook
3.2. Industry Value Chain Analysis
3.2.1. Raw Material Outlook
3.2.2. Manufacturing Trends
3.2.3. Sales Channel Analysis
3.3. Price Trend Analysis, 2018 – 2033
3.3.1. Factor Influencing Prince Trends
3.4. Regulatory Framework
3.5. Market Dynamics
3.5.1. Market Driver Analysis
3.5.2. Market Restraint Analysis
3.5.3. Industry Challenges
3.5.4. Industry Opportunities
3.6. Industry Analysis Tools
3.6.1. Porter’s Five Forces Analysis
3.6.2. Macro-Environmental Analysis
Chapter 4. Catalyst Market: Raw Material Estimates & Trend Analysis
4.1. Product Movement Analysis & Market Share, 2023 & 2033
4.2. Catalyst Market Estimates & Forecast, By Raw Material, 2018 To 2033 (Kilotons) (USD Billion)
4.2.1. Chemical compounds
4.2.1.1. Peroxides
4.2.1.2. Acids
4.2.1.3. Amines & others
4.2.2. Metals
4.2.2.1. Precious metals
4.2.2.2. Base metals
4.2.3. Zeolites
4.2.4. Other Raw Material
Chapter 5. Catalyst Market: Application Estimates & Trend Analysis
5.1. Application Movement Analysis & Market Share, 2023 & 2033
5.2. Catalyst Market Estimates & Forecast, By Application, 2018 To 2033 (Kilotons) (USD Billion)
5.2.1. Heterogeneous Catalyst
5.2.1.1. Chemical synthesis
5.2.1.1.1. Chemical catalysts
5.2.1.1.2. Adsorbents
5.2.1.1.3. Syngas production
5.2.1.1.4. Others
5.2.1.2. Petroleum refining
5.2.1.2.1. FCC
5.2.1.2.2. Alkylation
5.2.1.2.3. Hydrotreating
5.2.1.2.4. Catalytic Reforming
5.2.1.2.5. Purification
5.2.1.2.6. Bed grading
5.2.1.2.7. Others
5.2.1.3. Polymers and petrochemicals
5.2.1.3.1. Ziegler Natta
5.2.1.3.2. Reaction Initiator
5.2.1.3.3. Chromium
5.2.1.3.4. Urethane
5.2.1.3.5. Solid Phosphorous Acid catalyst
5.2.1.3.6. Others
5.2.1.4. Environmental
5.2.1.4.1. Light-duty vehicles
5.2.1.4.2. Motorcycles
5.2.1.4.3. Heavy-duty vehicles
5.2.1.4.4. Others
5.2.2. Homogeneous Catalyst
5.2.2.1. Chemical synthesis
5.2.2.1.1. Chemical catalysts
5.2.2.1.2. Adsorbents
5.2.2.1.3. Syngas production
5.2.2.1.4. Others
5.2.2.2. Petroleum refining
5.2.2.2.1. FCC
5.2.2.2.2. Alkylation
5.2.2.2.3. Hydrotreating
5.2.2.2.4. Catalytic Reforming
5.2.2.2.5. Bed grading
5.2.2.2.6. Purification
5.2.2.2.7. Others
5.2.2.3. Polymers and petrochemicals
5.2.2.3.1. Ziegler Natta
5.2.2.3.2. Reaction Initiator
5.2.2.3.3. Chromium
5.2.2.3.4. Urethane
5.2.2.3.5. Solid Phosphorous Acid catalyst
5.2.2.3.6. Others
5.2.2.4. Environmental
5.2.2.4.1. Light-duty vehicles
5.2.2.4.2. Motorcycles
5.2.2.4.3. Heavy-duty vehicles
5.2.2.4.4. Others
Chapter 6. Catalyst Market: Regional Estimates & Trend Analysis
6.1. Regional Movement Analysis & Market Share, 2023 & 2033
6.2. North America
6.2.1. North America Catalyst Estimates & Forecast, By Raw Material, 2018 – 2033 (Kilotons) (USD Billion)
6.2.2. North America Catalyst Estimates & Forecast, By Application, 2018 – 2033 (Kilotons) (USD Billion)
6.2.3. U.S.
6.2.3.1. Key Country Dynamics
6.2.3.2. U.S. Catalyst Estimates & Forecast, By Raw Material, 2018 – 2033 (Kilotons) (USD Billion)
6.2.3.3. U.S. Catalyst Estimates & Forecast, By Application, 2018 – 2033 (Kilotons) (USD Billion)
6.2.4. Canada
6.2.4.1. Key Country Dynamics
6.2.4.2. Canada Catalyst Estimates & Forecast, By Raw Material, 2018 – 2033 (Kilotons) (USD Billion)
6.2.4.3. Canada Catalyst Estimates & Forecast, By Application, 2018 – 2033 (Kilotons) (USD Billion)
6.2.5. Mexico
6.2.5.1. Key Country Dynamics
6.2.5.2. Mexico Catalyst Estimates & Forecast, By Raw Material, 2018 – 2033 (Kilotons) (USD Billion)
6.2.5.3. Mexico Catalyst Estimates & Forecast, By Application, 2018 – 2033 (Kilotons) (USD Billion)
6.3. Europe
6.3.1. Europe Catalyst Estimates & Forecast, By Raw Material, 2018 – 2033 (Kilotons) (USD Billion)
6.3.2. Europe Catalyst Estimates & Forecast, By Application, 2018 – 2033 (Kilotons) (USD Billion)
6.3.3. Germany
6.3.3.1. Key Country Dynamics
6.3.3.2. Germany Catalyst Estimates & Forecast, By Raw Material, 2018 – 2033 (Kilotons) (USD Billion)
6.3.3.3. Germany Catalyst Estimates & Forecast, By Application, 2018 – 2033 (Kilotons) (USD Billion)
6.3.4. UK
6.3.4.1. Key Country Dynamics
6.3.4.2. UK Catalyst Estimates & Forecast, By Raw Material, 2018 – 2033 (Kilotons) (USD Billion)
6.3.4.3. UK Catalyst Estimates & Forecast, By Application, 2018 – 2033 (Kilotons) (USD Billion)
6.3.5. France
6.3.5.1. Key Country Dynamics
6.3.5.2. France Catalyst Estimates & Forecast, By Raw Material, 2018 – 2033 (Kilotons) (USD Billion)
6.3.5.3. France Catalyst Estimates & Forecast, By Application, 2018 – 2033 (Kilotons) (USD Billion)
6.3.6. Italy
6.3.6.1. Key Country Dynamics
6.3.6.2. Italy Catalyst Estimates & Forecast, By Raw Material, 2018 – 2033 (Kilotons) (USD Billion)
6.3.6.3. Italy Catalyst Estimates & Forecast, By Application, 2018 – 2033 (Kilotons) (USD Billion)
6.3.7. Spain
6.3.7.1. Key Country Dynamics
6.3.7.2. Spain Catalyst Estimates & Forecast, By Raw Material, 2018 – 2033 (Kilotons) (USD Billion)
6.3.7.3. Spain Catalyst Estimates & Forecast, By Application, 2018 – 2033 (Kilotons) (USD Billion)
6.4. Asia Pacific
6.4.1. Asia Pacific Catalyst Estimates & Forecast, By Raw Material, 2018 – 2033 (Kilotons) (USD Billion)
6.4.2. Asia Pacific Catalyst Estimates & Forecast, By Application, 2018 – 2033 (Kilotons) (USD Billion)
6.4.3. China
6.4.3.1. Key Country Dynamics
6.4.3.2. China Catalyst Estimates & Forecast, By Raw Material, 2018 – 2033 (Kilotons) (USD Billion)
6.4.3.3. China Catalyst Estimates & Forecast, By Application, 2018 – 2033 (Kilotons) (USD Billion)
6.4.4. India
6.4.4.1. Key Country Dynamics
6.4.4.2. India Catalyst Estimates & Forecast, By Raw Material, 2018 – 2033 (Kilotons) (USD Billion)
6.4.4.3. India Catalyst Estimates & Forecast, By Application, 2018 – 2033 (Kilotons) (USD Billion)
6.4.5. Japan
6.4.5.1. Key Country Dynamics
6.4.5.2. Japan Catalyst Estimates & Forecast, By Raw Material, 2018 – 2033 (Kilotons) (USD Billion)
6.4.5.3. Japan Catalyst Estimates & Forecast, By Application, 2018 – 2033 (Kilotons) (USD Billion)
6.4.6. South Korea
6.4.6.1. Key Country Dynamics
6.4.6.2. South Korea Catalyst Estimates & Forecast, By Raw Material, 2018 – 2033 (Kilotons) (USD Billion)
6.4.6.3. South Korea Catalyst Estimates & Forecast, By Application, 2018 – 2033 (Kilotons) (USD Billion)
6.5. Latin America
6.5.1. Latin America Catalyst Estimates & Forecast, By Raw Material, 2018 – 2033 (Kilotons) (USD Billion)
6.5.2. Latin America Catalyst Estimates & Forecast, By Application, 2018 – 2033 (Kilotons) (USD Billion)
6.5.3. Brazil
6.5.3.1. Key Country Dynamics
6.5.3.2. Brazil Catalyst Estimates & Forecast, By Raw Material, 2018 – 2033 (Kilotons) (USD Billion)
6.5.3.3. Brazil Catalyst Estimates & Forecast, By Application, 2018 – 2033 (Kilotons) (USD Billion)
6.5.4. Argentina
6.5.4.1. Key Country Dynamics
6.5.4.2. Argentina Catalyst Estimates & Forecast, By Raw Material, 2018 – 2033 (Kilotons) (USD Billion)
6.5.4.3. Argentina Catalyst Estimates & Forecast, By Application, 2018 – 2033 (Kilotons) (USD Billion)
6.6. Middle East & Africa
6.6.1. Middle East & Africa Catalyst Estimates & Forecast, By Raw Material, 2018 – 2033 (Kilotons) (USD Billion)
6.6.2. Middle East & Africa Catalyst Estimates & Forecast, By Application, 2018 – 2033 (Kilotons) (USD Billion)
6.6.3. Saudi Arabia
6.6.3.1. Key Country Dynamics
6.6.3.2. Saudi Arabia Catalyst Estimates & Forecast, By Raw Material, 2018 – 2033 (Kilotons) (USD Billion)
6.6.3.3. Saudi Arabia Catalyst Estimates & Forecast, By Application, 2018 – 2033 (Kilotons) (USD Billion)
6.6.4. South Africa
6.6.4.1. Key Country Dynamics
6.6.4.2. South Africa Catalyst Estimates & Forecast, By Raw Material, 2018 – 2033 (Kilotons) (USD Billion)
6.6.4.3. South Africa Catalyst Estimates & Forecast, By Application, 2018 – 2033 (Kilotons) (USD Billion)
Chapter 7. Catalyst Market – Competitive Landscape
7.1. Recent Developments & Impact Analysis, By Key Market Participants
7.2. Company Categorization
7.3. Company Market Share/Position Analysis, 2025
7.4. Company Heat Map Analysis
7.5. Strategy Mapping
7.6. Company Profiles
7.6.1. Albemarle Corporation
7.6.1.1. Participant’s Overview
7.6.1.2. Financial Performance
7.6.1.3. Product Benchmarking
7.6.1.4. Recent Developments
7.6.2. Haldor Topsoe A/S
7.6.2.1. Participant’s Overview
7.6.2.2. Financial Performance
7.6.2.3. Product Benchmarking
7.6.2.4. Recent Developments
7.6.3. BASF SE
7.6.3.1. Participant’s Overview
7.6.3.2. Financial Performance
7.6.3.3. Product Benchmarking
7.6.3.4. Recent Developments
7.6.4. Evonik Industries AG
7.6.4.1. Participant’s Overview
7.6.4.2. Financial Performance
7.6.4.3. Product Benchmarking
7.6.4.4. Recent Developments
7.6.5. LyondellBasell Industries Holdings B.V.
7.6.5.1. Participant’s Overview
7.6.5.2. Financial Performance
7.6.5.3. Product Benchmarking
7.6.5.4. Recent Developments
7.6.6. Arkema
7.6.6.1. Participant’s Overview
7.6.6.2. Financial Performance
7.6.6.3. Product Benchmarking
7.6.6.4. Recent Developments
7.6.7. The Dow Chemical Company
7.6.7.1. Participant’s Overview
7.6.7.2. Financial Performance
7.6.7.3. Product Benchmarking
7.6.7.4. Recent Developments
7.6.8. Haldor Topsoe A/S
7.6.8.1. Participant’s Overview
7.6.8.2. Financial Performance
7.6.8.3. Product Benchmarking
7.6.8.4. Recent Developments
7.6.9. W. R. Grace & Co.-Conn.
7.6.9.1. Participant’s Overview
7.6.9.2. Financial Performance
7.6.9.3. Product Benchmarking
7.6.9.4. Recent Developments
7.6.10. Johnson Matthey
7.6.10.1. Participant’s Overview
7.6.10.2. Financial Performance
7.6.10.3. Product Benchmarking
7.6.10.4. Recent Developments
7.6.11. Axens
7.6.11.1. Participant’s Overview
7.6.11.2. Financial Performance
7.6.11.3. Product Benchmarking
7.6.11.4. Recent Developments
7.6.12. Honeywell UOP
7.6.12.1. Participant’s Overview
7.6.12.2. Financial Performance
7.6.12.3. Product Benchmarking
7.6.12.4. Recent Developments
7.6.13. Zeolyst International
7.6.13.1. Participant’s Overview
7.6.13.2. Financial Performance
7.6.13.3. Product Benchmarking
7.6.13.4. Recent Developments
7.6.14. Clariant
7.6.14.1. Participant’s Overview
7.6.14.2. Financial Performance
7.6.14.3. Product Benchmarking
7.6.14.4. Recent Developments
7.6.15. Umicore
7.6.15.1. Participant’s Overview
7.6.15.2. Financial Performance
7.6.15.3. Product Benchmarking
7.6.15.4. Recent Developments
7.6.16. Exxon Mobil Corporation
7.6.16.1. Participant’s Overview
7.6.16.2. Financial Performance
7.6.16.3. Product Benchmarking
7.6.16.4. Recent Developments
List of Tables
Table 1 Regulatory Framework, by Regions
Table 2 U.S. Macroeconomic Outlay
Table 3 Canada Macroeconomic Outlay
Table 4 Mexico Macroeconomic Outlay
Table 5 Germany Macroeconomic Outlay
Table 6 UK Macroeconomic Outlay
Table 7 France Macroeconomic Outlay
Table 8 Italy Macroeconomic Outlay
Table 9 Spain Macroeconomic Outlay
Table 10 China Macroeconomic Outlay
Table 11 India Macroeconomic Outlay
Table 12 Japan Macroeconomic Outlay
Table 13 South Korea Macroeconomic Outlay
Table 14 Australia Macroeconomic Outlay
Table 15 Brazil Macroeconomic Outlay
Table 16 Argentina Macroeconomic Outlay
Table 17 Saudi Arabia Macroeconomic Outlay
Table 18 South Africa Macroeconomic Outlay
Table 19 Participant’s Overview
Table 20 Financial Performance
Table 21 Product Benchmarking
Table 22 Company Heat Map Analysis
Table 23 Key Strategy Mapping
List of Figures
Fig. 1 Catalyst Market Segmentation
Fig. 2 Information Procurement
Fig. 3 Data Analysis Models
Fig. 4 Data Validating & Publishing
Fig. 5 Catalyst Market Snapshot
Fig. 6 Catalyst Market Segmental Outlook, 2025 (Kilotons) (USD Billion)
Fig. 7 Catalyst Market: Competitive Insights
Fig. 8 Global Catalyst Market, 2025 (Kilotons) (USD Billion)
Fig. 9 Global Catalyst Market Value Chain Analysis
Fig. 10 Catalyst Market Dynamics
Fig. 11 Catalyst Market: Porter’s Analysis
Fig. 12 Catalyst Market: Pestle Analysis
Fig. 13 Catalyst Market Analysis & Segment Forecast, By Raw Material, 2018-2033 (Kilotons) (USD Billion)
Fig. 14 Chemical compounds Catalyst Estimates & Forecast, By Raw Material, 2018 – 2033 (Kilotons) (USD Billion)
Fig. 15 Peroxides Catalyst Estimates & Forecast, By Raw Material, 2018 – 2033 (Kilotons) (USD Billion)
Fig. 16 Acids Catalyst Estimates & Forecast, By Raw Material, 2018 – 2033 (Kilotons) (USD Billion)
Fig. 17 Amines & others Catalyst Estimates & Forecast, By Raw Material, 2018 – 2033 (Kilotons) (USD Billion)
Fig. 18 Metals Catalyst Estimates & Forecast, By Raw Material, 2018 – 2033 (Kilotons) (USD Billion)
Fig. 19 Precious metals Catalyst Estimates & Forecast, By Raw Material, 2018 – 2033 (Kilotons) (USD Billion)
Fig. 20 Base metals Catalyst Estimates & Forecast, By Raw Material, 2018 – 2033 (Kilotons) (USD Billion)
Fig. 21 Zeolites Catalyst Estimates & Forecast, By Raw Material, 2018 – 2033 (Kilotons) (USD Billion)
Fig. 22 Other Raw Material Catalyst Estimates & Forecast, By Raw Material, 2018 – 2033 (Kilotons) (USD Billion)
Fig. 23 Catalyst Market Analysis & Segment Forecast, By Application, 2018-2033 (Kilotons) (USD Billion)
Fig. 24 Heterogeneous Catalyst Estimates & Forecast, By Raw Material, 2018 – 2033 (Kilotons) (USD Billion)
Fig. 25 Chemical synthesis Catalyst Estimates & Forecast, By Raw Material, 2018 – 2033 (Kilotons) (USD Billion)
Fig. 26 Chemical catalysts Catalyst Estimates & Forecast, By Raw Material, 2018 – 2033 (Kilotons) (USD Billion)
Fig. 27 Adsorbents Catalyst Estimates & Forecast, By Raw Material, 2018 – 2033 (Kilotons) (USD Billion)
Fig. 28 Syngas production Catalyst Estimates & Forecast, By Raw Material, 2018 – 2033 (Kilotons) (USD Billion)
Fig. 29 Others Catalyst Estimates & Forecast, By Raw Material, 2018 – 2033 (Kilotons) (USD Billion)
Fig. 30 Petroleum refining Catalyst Estimates & Forecast, By Raw Material, 2018 – 2033 (Kilotons) (USD Billion)
Fig. 31 FCC Catalyst Estimates & Forecast, By Raw Material, 2018 – 2033 (Kilotons) (USD Billion)
Fig. 32 Alkylation Catalyst Estimates & Forecast, By Raw Material, 2018 – 2033 (Kilotons) (USD Billion)
Fig. 33 Hydrotreating Catalyst Estimates & Forecast, By Raw Material, 2018 – 2033 (Kilotons) (USD Billion)
Fig. 34 Catalytic Reforming Catalyst Estimates & Forecast, By Raw Material, 2018 – 2033 (Kilotons) (USD Billion)
Fig. 35 Purification Catalyst Estimates & Forecast, By Raw Material, 2018 – 2033 (Kilotons) (USD Billion)
Fig. 36 Bed grading Catalyst Estimates & Forecast, By Raw Material, 2018 – 2033 (Kilotons) (USD Billion)
Fig. 37 Others Catalyst Estimates & Forecast, By Raw Material, 2018 – 2033 (Kilotons) (USD Billion)
Fig. 38 Polymers and petrochemicals Catalyst Estimates & Forecast, By Raw Material, 2018 – 2033 (Kilotons) (USD Billion)
Fig. 39 Ziegler Natta Catalyst Estimates & Forecast, By Raw Material, 2018 – 2033 (Kilotons) (USD Billion)
Fig. 40 Reaction Initiator Catalyst Estimates & Forecast, By Raw Material, 2018 – 2033 (Kilotons) (USD Billion)
Fig. 41 Chromium Catalyst Estimates & Forecast, By Raw Material, 2018 – 2033 (Kilotons) (USD Billion)
Fig. 42 Urethane Catalyst Estimates & Forecast, By Raw Material, 2018 – 2033 (Kilotons) (USD Billion)
Fig. 43 Solid Phosphorous Acid catalyst Estimates & Forecast, By Raw Material, 2018 – 2033 (Kilotons) (USD Billion)
Fig. 44 Others Catalyst Estimates & Forecast, By Raw Material, 2018 – 2033 (Kilotons) (USD Billion)
Fig. 45 Environmental Catalyst Estimates & Forecast, By Raw Material, 2018 – 2033 (Kilotons) (USD Billion)
Fig. 46 Light-duty vehicles Catalyst Estimates & Forecast, By Raw Material, 2018 – 2033 (Kilotons) (USD Billion)
Fig. 47 Motorcycles Catalyst Estimates & Forecast, By Raw Material, 2018 – 2033 (Kilotons) (USD Billion)
Fig. 48 Heavy-duty vehicles Catalyst Estimates & Forecast, By Raw Material, 2018 – 2033 (Kilotons) (USD Billion)
Fig. 49 Others Catalyst Estimates & Forecast, By Raw Material, 2018 – 2033 (Kilotons) (USD Billion)
Fig. 50 Homogeneous Catalyst Estimates & Forecast, By Raw Material, 2018 – 2033 (Kilotons) (USD Billion)
Fig. 51 Chemical synthesis Catalyst Estimates & Forecast, By Raw Material, 2018 – 2033 (Kilotons) (USD Billion)
Fig. 52 Chemical catalysts Catalyst Estimates & Forecast, By Raw Material, 2018 – 2033 (Kilotons) (USD Billion)
Fig. 53 Adsorbents Catalyst Estimates & Forecast, By Raw Material, 2018 – 2033 (Kilotons) (USD Billion)
Fig. 54 Syngas production Catalyst Estimates & Forecast, By Raw Material, 2018 – 2033 (Kilotons) (USD Billion)
Fig. 55 Others Catalyst Estimates & Forecast, By Raw Material, 2018 – 2033 (Kilotons) (USD Billion)
Fig. 56 Petroleum refining Catalyst Estimates & Forecast, By Raw Material, 2018 – 2033 (Kilotons) (USD Billion)
Fig. 57 FCC Catalyst Estimates & Forecast, By Raw Material, 2018 – 2033 (Kilotons) (USD Billion)
Fig. 58 Alkylation Catalyst Estimates & Forecast, By Raw Material, 2018 – 2033 (Kilotons) (USD Billion)
Fig. 59 Hydrotreating Catalyst Estimates & Forecast, By Raw Material, 2018 – 2033 (Kilotons) (USD Billion)
Fig. 60 Catalytic Reforming Catalyst Estimates & Forecast, By Raw Material, 2018 – 2033 (Kilotons) (USD Billion)
Fig. 61 Bed grading Catalyst Estimates & Forecast, By Raw Material, 2018 – 2033 (Kilotons) (USD Billion)
Fig. 62 Purification Catalyst Estimates & Forecast, By Raw Material, 2018 – 2033 (Kilotons) (USD Billion)
Fig. 63 Others Catalyst Estimates & Forecast, By Raw Material, 2018 – 2033 (Kilotons) (USD Billion)
Fig. 64 Polymers and petrochemicals Catalyst Estimates & Forecast, By Raw Material, 2018 – 2033 (Kilotons) (USD Billion)
Fig. 65 Ziegler Natta Catalyst Estimates & Forecast, By Raw Material, 2018 – 2033 (Kilotons) (USD Billion)
Fig. 66 Reaction Initiator Catalyst Estimates & Forecast, By Raw Material, 2018 – 2033 (Kilotons) (USD Billion)
Fig. 67 Chromium Catalyst Estimates & Forecast, By Raw Material, 2018 – 2033 (Kilotons) (USD Billion)
Fig. 68 Urethane Catalyst Estimates & Forecast, By Raw Material, 2018 – 2033 (Kilotons) (USD Billion)
Fig. 69 Solid Phosphorous Acid catalyst Estimates & Forecast, By Raw Material, 2018 – 2033 (Kilotons) (USD Billion)
Fig. 70 Others Catalyst Estimates & Forecast, By Raw Material, 2018 – 2033 (Kilotons) (USD Billion)
Fig. 71 Environmental Catalyst Estimates & Forecast, By Raw Material, 2018 – 2033 (Kilotons) (USD Billion)
Fig. 72 Light-duty vehicles Catalyst Estimates & Forecast, By Raw Material, 2018 – 2033 (Kilotons) (USD Billion)
Fig. 73 Motorcycles Catalyst Estimates & Forecast, By Raw Material, 2018 – 2033 (Kilotons) (USD Billion)
Fig. 74 Heavy-duty vehicles Catalyst Estimates & Forecast, By Raw Material, 2018 – 2033 (Kilotons) (USD Billion)
Fig. 75 Others Catalyst Estimates & Forecast, By Raw Material, 2018 – 2033 (Kilotons) (USD Billion)
Fig. 76 Catalyst Market: Regional Estimates & Trend Analysis
Fig. 77 North America Catalyst Estimates & Forecast, By Raw Material, 2018 – 2033 (Kilotons) (USD Billion)
Fig. 78 North America Catalyst Estimates & Forecast, By Application, 2018 – 2033 (Kilotons) (USD Billion)
Fig. 79 U.S. Catalyst Estimates & Forecast, By Raw Material, 2018 – 2033 (Kilotons) (USD Billion)
Fig. 80 U.S. Catalyst Estimates & Forecast, By Application, 2018 – 2033 (Kilotons) (USD Billion)
Fig. 81 Canada Catalyst Estimates & Forecast, By Raw Material, 2018 – 2033 (Kilotons) (USD Billion)
Fig. 82 Canada Catalyst Estimates & Forecast, By Application, 2018 – 2033 (Kilotons) (USD Billion)
Fig. 83 Mexico Catalyst Estimates & Forecast, By Raw Material, 2018 – 2033 (Kilotons) (USD Billion)
Fig. 84 Mexico Catalyst Estimates & Forecast, By Application, 2018 – 2033 (Kilotons) (USD Billion)
Fig. 85 Europe Catalyst Estimates & Forecast, By Raw Material, 2018 – 2033 (Kilotons) (USD Billion)
Fig. 86 Europe Catalyst Estimates & Forecast, By Application, 2018 – 2033 (Kilotons) (USD Billion)
Fig. 87 Germany Catalyst Estimates & Forecast, By Raw Material, 2018 – 2033 (Kilotons) (USD Billion)
Fig. 88 Germany Catalyst Estimates & Forecast, By Application, 2018 – 2033 (Kilotons) (USD Billion)
Fig. 89 UK Catalyst Estimates & Forecast, By Raw Material, 2018 – 2033 (Kilotons) (USD Billion)
Fig. 90 UK Catalyst Estimates & Forecast, By Application, 2018 – 2033 (Kilotons) (USD Billion)
Fig. 91 France Catalyst Estimates & Forecast, By Raw Material, 2018 – 2033 (Kilotons) (USD Billion)
Fig. 92 France Catalyst Estimates & Forecast, By Application, 2018 – 2033 (Kilotons) (USD Billion)
Fig. 93 Italy Catalyst Estimates & Forecast, By Raw Material, 2018 – 2033 (Kilotons) (USD Billion)
Fig. 94 Italy Catalyst Estimates & Forecast, By Application, 2018 – 2033 (Kilotons) (USD Billion)
Fig. 95 Spain Catalyst Estimates & Forecast, By Raw Material, 2018 – 2033 (Kilotons) (USD Billion)
Fig. 96 Spain Catalyst Estimates & Forecast, By Application, 2018 – 2033 (Kilotons) (USD Billion)
Fig. 97 Asia Pacific Catalyst Estimates & Forecast, By Raw Material, 2018 – 2033 (Kilotons) (USD Billion)
Fig. 98 Asia Pacific Catalyst Estimates & Forecast, By Application, 2018 – 2033 (Kilotons) (USD Billion)
Fig. 99 China Catalyst Estimates & Forecast, By Raw Material, 2018 – 2033 (Kilotons) (USD Billion)
Fig. 100 China Catalyst Estimates & Forecast, By Application, 2018 – 2033 (Kilotons) (USD Billion)
Fig. 101 India Catalyst Estimates & Forecast, By Raw Material, 2018 – 2033 (Kilotons) (USD Billion)
Fig. 102 India Catalyst Estimates & Forecast, By Application, 2018 – 2033 (Kilotons) (USD Billion)
Fig. 103 Japan Catalyst Estimates & Forecast, By Raw Material, 2018 – 2033 (Kilotons) (USD Billion)
Fig. 104 Japan Catalyst Estimates & Forecast, By Application, 2018 – 2033 (Kilotons) (USD Billion)
Fig. 105 South Korea Catalyst Estimates & Forecast, By Raw Material, 2018 – 2033 (Kilotons) (USD Billion)
Fig. 106 South Korea Catalyst Estimates & Forecast, By Application, 2018 – 2033 (Kilotons) (USD Billion)
Fig. 107 Latin America Catalyst Estimates & Forecast, By Raw Material, 2018 – 2033 (Kilotons) (USD Billion)
Fig. 108 Latin America Catalyst Estimates & Forecast, By Application, 2018 – 2033 (Kilotons) (USD Billion)
Fig. 109 Brazil Catalyst Estimates & Forecast, By Raw Material, 2018 – 2033 (Kilotons) (USD Billion)
Fig. 110 Brazil Catalyst Estimates & Forecast, By Application, 2018 – 2033 (Kilotons) (USD Billion)
Fig. 111 Argentina Catalyst Estimates & Forecast, By Raw Material, 2018 – 2033 (Kilotons) (USD Billion)
Fig. 112 Argentina Catalyst Estimates & Forecast, By Application, 2018 – 2033 (Kilotons) (USD Billion)
Fig. 113 Middle East & Africa Catalyst Estimates & Forecast, By Raw Material, 2018 – 2033 (Kilotons) (USD Billion)
Fig. 114 Middle East & Africa Catalyst Estimates & Forecast, By Application, 2018 – 2033 (Kilotons) (USD Billion)
Fig. 115 Saudi Arabia Catalyst Estimates & Forecast, By Raw Material, 2018 – 2033 (Kilotons) (USD Billion)
Fig. 116 Saudi Arabia Catalyst Estimates & Forecast, By Application, 2018 – 2033 (Kilotons) (USD Billion)
Fig. 117 South Africa Catalyst Estimates & Forecast, By Raw Material, 2018 – 2033 (Kilotons) (USD Billion)
Fig. 118 South Africa Catalyst Estimates & Forecast, By Application, 2018 – 2033 (Kilotons) (USD Billion)
Fig. 119 Catalyst Market: Company Categorization
Fig. 120 Catalyst Market: Company Market Share Analysis
Fig. 121 Catalyst Market: Company Market Positioning Analysis
Fig. 122 Catalyst Market: Strategy Mapping