Composite Cylinder Market : Global Opportunity Analysis and Industry Forecast, 2025-2030
複合シリンダー市場 - シリンダータイプ(LPG、CNG、水素、酸素)、材質別(アラミド繊維複合材、HDPEパイプ/ライナー、ガラス繊維複合材、炭素繊維複合材)、タンクタイプ別(タイプII、タイプIII、タイプIV)、最終用途別(ガス運搬・貯蔵、輸送、生命維持、レクリエーション、その他):機会分析と業界予測、2025年-2030年
Composite Cylinder Market By Cylinder Type (LPG, CNG, Hydrogen, Oxygen), By Material Type (Aramid Fiber Composites, HDPE Pipe/Liner, Glass Fiber Composites, Carbon Fiber Composites), By Tank Type (Type II, Type III, Type IV), By End-Use (Gas Carrier and Storage, Transportation, Life Support, Recreation, Others): Global Opportunity Analysis and Industry Forecast, 2025-2030
| 出版 | Allied Market Research |
| 出版年月 | 2025年09月 |
| ページ数 | 472 |
| 価格 | 記載以外のライセンスについてはお問合せください |
| シングルユーザ | USD 4,335 |
| 種別 | 英文調査報告書 |
| 商品番号 | SMR-12242 |

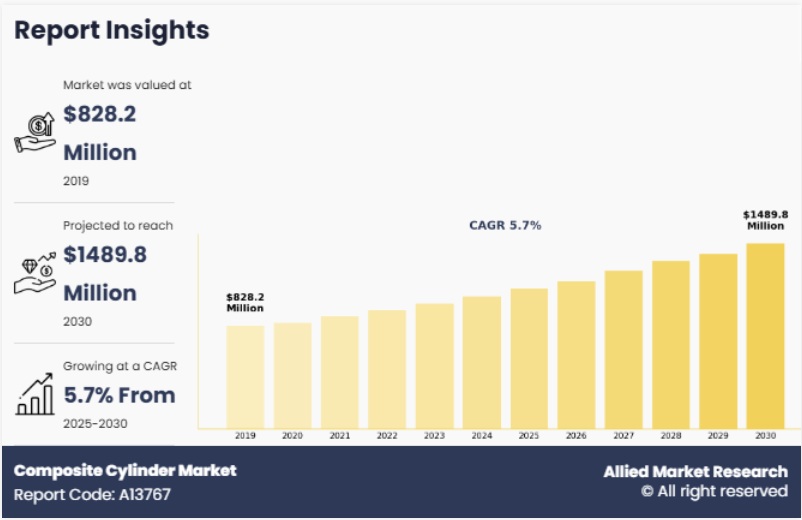
世界の複合シリンダー市場は2019年に8億2,820万ドルと評価され、2025年から2030年にかけて5.7%のCAGRで成長し、2030年には15億ドルに達すると予測されています。
複合シリンダーは、従来の鋼鉄やアルミニウムではなく、先進的な複合材料を用いて製造される高圧ガスボンベの一種です。これらのボンベは通常、軽量ポリマー、グラスファイバー、炭素繊維、またはアラミド繊維を熱可塑性樹脂または熱硬化性樹脂マトリックスと組み合わせたものです。この複合構造は、従来のボンベに比べて軽量、優れた耐腐食性、強度対重量比の向上、安全性の向上など、いくつかの利点を備えています。複合ボンベは、より軽量で耐久性が高く、取り扱いが容易になるように設計されており、産業、商業、家庭環境における多様な用途に最適です。
複合シリンダーはエネルギー産業において、特に液化石油ガス(LPG)および圧縮天然ガス(CNG)の貯蔵において重要な役割を果たしています。軽量で安全な設計により、従来家庭用および業務用に使用されてきた鋼製LPGボンベの理想的な代替品となります。発電所では、操業に必要な特殊ガスの貯蔵にも複合材ボンベが使用されています。耐腐食性とメンテナンスコストの低減により、過酷な気候下における屋外エネルギー貯蔵において非常に有用です。
The global composite cylinder market was valued at $828.2 million in 2019, and is projected to reach $1.5 billion by 2030, growing at a CAGR of 5.7% from 2025 to 2030.
Introduction
A composite cylinder is a type of high-pressure gas cylinder made using advanced composite materials rather than traditional steel or aluminum. These cylinders typically combine lightweight polymers, fiberglass, carbon fiber, or aramid fibers with a thermoplastic or thermoset resin matrix. This composite construction offers several advantages over conventional cylinders, including reduced weight, superior corrosion resistance, improved strength-to-weight ratio, and enhanced safety. Composite cylinders are designed to be lighter, more durable, and easier to handle, making them highly suitable for diverse applications in industrial, commercial, and domestic environments.
Composite Cylinder Market
Composite cylinders play a crucial role in the energy industry, particularly for Liquefied Petroleum Gas (LPG) and Compressed Natural Gas (CNG) storage. Their lightweight and safe design make them an ideal replacement for steel LPG cylinders traditionally used in households and industries. In power generation plants, composite cylinders are also used to store specialty gases required for operations. Their resistance to corrosion and reduced maintenance cost makes them highly valuable for outdoor energy storage in harsh climates.
Market Dynamics
Growing demand for clean energy and LPG gas is expected to drive the growth of the composite cylinder market. Composite cylinders are increasingly replacing traditional steel cylinders due to their superior safety features, lightweight construction, and extended service life. They are resistant to rust and chemical reactions, ensuring durability even in harsh climatic conditions. Their explosion-resistant design, along with the ability to visually monitor gas levels, provides significant safety advantages for end-users, particularly in densely populated urban regions where safety concerns are critical. In December 2023, Patna in India, consumers began adopting Indane composite LPG cylinders extensively (since the September 2021). Around 25% of customers transitioned among wealthier or better-informed users, due to benefits like lighter weight, translucence, and rust-proof design.
However, high manufacturing cost of composite cylinder is expected to hamper the growth of the market. The production of these cylinders requires advanced raw materials such as carbon fiber, fiberglass, and specialized resins, which are significantly more expensive than steel. In addition, the manufacturing process involves sophisticated techniques like filament winding, precision molding, and stringent quality control testing to ensure safety and performance under high pressure. These advanced processes demand high levels of technical expertise and specialized machinery, further adding to production expenses.
Segments Overview
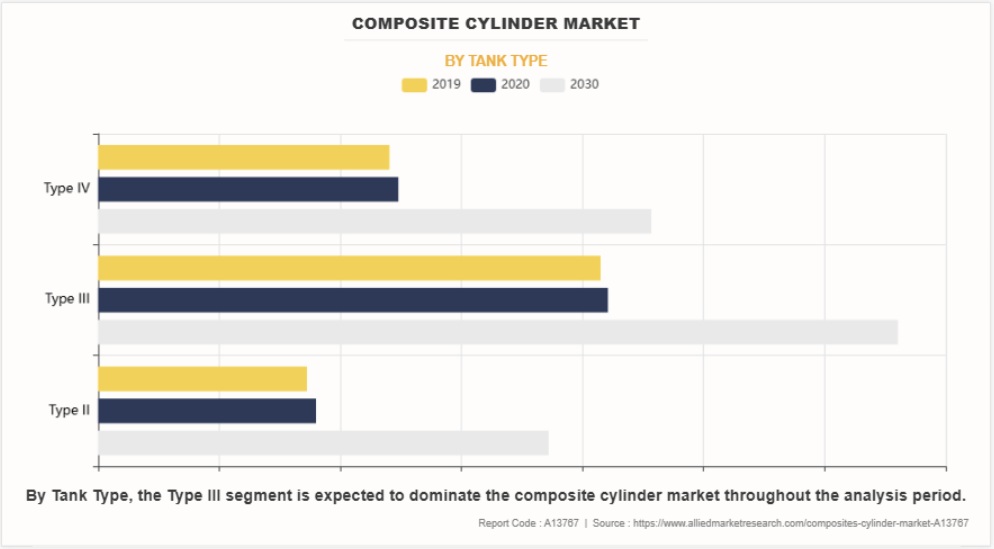
The composite cylinder market is segmented into cylinder type, material type, tank type, end-use, and region. On the basis of cylinder type, the market is categorized into LPG, CNG, hydrogen, and oxygen. On the basis of material type, the market is categorized into aramid fiber composites, HDPE pipe/liner, glass fiber composite, and carbon fiber composites. On the basis of tank type, the market is classified into type II, type III, and type IV. On the basis of end-use, the market is categorized into transportation, life support, recreation, and others. On the basis of region, the market is analyzed across North America, Europe, Asia-Pacific, and LAMEA.
On the basis of material type LPG dominated the composite cylinder market in 2019. Composite cylinders are increasingly being adopted in the liquefied petroleum gas (LPG) industry due to their advantages over conventional steel cylinders. These cylinders are typically made from advanced materials such as glass fiber or carbon fiber reinforced polymers, combined with a plastic liner. Their lightweight structure makes them easier to handle, transport, and store compared to traditional steel cylinders, which are often bulky and heavy.
On the basis of material type, glass fiber composites dominated the composite cylinder market in 2019. In pressure vessel applications, glass fiber composite cylinders are commonly used for storing gases such as compressed natural gas (CNG), hydrogen, and oxygen. These cylinders are preferred because they can withstand high internal pressures while maintaining a much lighter profile compared to steel or aluminum alternatives. The high fatigue resistance of glass fiber composites also ensures longer service life, making them reliable for both industrial and consumer use, such as in portable breathing apparatus, firefighting equipment, and SCUBA diving gear.
Regional Analysis
On the basis of region, Asia-Pacific dominated the composite cylinder market in 2019. In developed economies like Japan, South Korea, and Australia, composite cylinders are finding wider applications beyond domestic use, particularly in recreational activities such as camping, barbecuing, and caravanning, where lightweight and durable solutions are preferred. Industrial sectors in these countries are also gradually shifting to composite cylinders for welding, medical gases, and specialty applications, benefiting from reduced maintenance costs and longer service life compared to steel alternatives. The strong emphasis on safety standards and eco-friendly solutions in these countries further supports the transition toward composites.
Competitive Analysis
The major prominent players operating in the composite cylinder market include Hexagon Ragasco AS, NPROXX, Amtrol-Alfa, Drägerwerk AG & Co. KGaA, EVAS, FABER INDUSTRIE SPA, Luxfer Gas Cylinders, Quantum Fuel Systems, Sinoma International Engineering Co., Ltd., and AMS Composite Cylinders, and others.
Key Benefits For Stakeholders
- This report provides a quantitative analysis of the market segments, current trends, estimations, and dynamics of the composite cylinder market analysis from 2019 to 2030 to identify the prevailing composite cylinder market opportunities.
- The market research is offered along with information related to key drivers, restraints, and opportunities.
- Porter’s five forces analysis highlights the potency of buyers and suppliers to enable stakeholders make profit-oriented business decisions and strengthen their supplier-buyer network.
- In-depth analysis of the composite cylinder market segmentation assists to determine the prevailing market opportunities.
- Major countries in each region are mapped according to their revenue contribution to the global market.
- Market player positioning facilitates benchmarking and provides a clear understanding of the present position of the market players.
- The report includes the analysis of the regional as well as global composite cylinder market trends, key players, market segments, application areas, and market growth strategies.
Additional benefits you will get with this purchase are:
- Quarterly Update and* (only available with a corporate license, on listed price)
- 5 additional Company Profile of client Choice pre- or Post-purchase, as a free update.
- Free Upcoming Version on the Purchase of Five and Enterprise User License.
- 16 analyst hours of support* (post-purchase, if you find additional data requirements upon review of the report, you may receive support amounting to 16 analyst hours to solve questions, and post-sale queries)
- 15% Free Customization* (in case the scope or segment of the report does not match your requirements, 15% is equivalent to 3 working days of free work, applicable once)
- Free data Pack on the Five and Enterprise User License. (Excel version of the report)
- Free Updated report if the report is 6-12 months old or older.
- 24-hour priority response*
- Free Industry updates and white papers.
Possible Customization with this report (with additional cost and timeline, please talk to the sales executive to know more)
- Analysis of raw material in a product (by %)
- Investment Opportunities
- Product Benchmarking / Product specification and applications
- Upcoming/New Entrant by Regions
- Technology Trend Analysis
- Consumer Preference and Product Specifications
- Market share analysis of players by products/segments
- New Product Development/ Product Matrix of Key Players
- Patient/epidemiology data at country, region, global level
- Regulatory Guidelines
- Additional company profiles with specific to client’s interest
- Additional country or region analysis- market size and forecast
- Expanded list for Company Profiles
- Historic market data
- Import Export Analysis/Data
- Key player details (including location, contact details, supplier/vendor network etc. in excel format)
- List of customers/consumers/raw material suppliers- value chain analysis
- Market share analysis of players at global/region/country level
- SWOT Analysis
- Volume Market Size and Forecast
Composite Cylinder Market Report Highlights
| Aspects | Details |
|
Market Size By 2030
|
USD 1.5 billion |
|
Growth Rate
|
CAGR of 5.7% |
|
Forecast period
|
2019 – 2030 |
|
Report Pages
|
472 |
|
By Cylinder Type
|
|
|
By Material Type
|
|
|
By Tank Type
|
|
|
By End-Use
|
|
|
By Region
|
|
|
Key Market Players
|
Luxfer Holdings PLC, NPROXX, AMS Composite Cylinders, Sinoma International Engineering Co., Ltd., FABER INDUSTRIE SPA, EVAS, Hexagon Ragasco AS, Amtrol-Alfa, Quantum Fuel Systems LLC, Drgerwerk AG & Co. KGaA |
Table of Content
CHAPTER 1: INTRODUCTION
1.1. Report description
1.2. Key market segments
1.3. Key benefits to the stakeholders
1.4. Research methodology
1.4.1. Primary research
1.4.2. Secondary research
1.4.3. Analyst tools and models
CHAPTER 2: EXECUTIVE SUMMARY
2.1. CXO perspective
CHAPTER 3: MARKET OVERVIEW
3.1. Market definition and scope
3.2. Key findings
3.2.1. Top impacting factors
3.2.2. Top investment pockets
3.3. Porter’s five forces analysis
3.3.1. Moderate bargaining power of suppliers
3.3.2. Moderate threat of new entrants
3.3.3. Moderate threat of substitutes
3.3.4. Moderate intensity of rivalry
3.3.5. Moderate bargaining power of buyers
3.4. Market dynamics
3.4.1. Drivers
3.4.1.1. Growth in Demand for Clean Energy and LPG
3.4.1.2. Adoption in Automotive and Aerospace
3.4.2. Restraints
3.4.2.1. Recycling and Disposal Challenges
3.4.3. Opportunities
3.4.3.1. Rise in Use in Hydrogen Economy
3.4.3.2. Surge in Portable Energy Storage for Outdoor and Recreational Use
3.5. Value Chain Analysis
3.6. Patient Epidemiology Data
3.7. Regulatory Guidelines
3.8. Pricing Analysis Overview
CHAPTER 4: COMPOSITE CYLINDER MARKET, BY CYLINDER TYPE
4.1. Overview
4.1.1. Market size and forecast
4.2. LPG
4.2.1. Key market trends, growth factors and opportunities
4.2.2. Market size and forecast, by region
4.2.3. Market share analysis by country
4.3. CNG
4.3.1. Key market trends, growth factors and opportunities
4.3.2. Market size and forecast, by region
4.3.3. Market share analysis by country
4.4. Hydrogen
4.4.1. Key market trends, growth factors and opportunities
4.4.2. Market size and forecast, by region
4.4.3. Market share analysis by country
4.5. Oxygen
4.5.1. Key market trends, growth factors and opportunities
4.5.2. Market size and forecast, by region
4.5.3. Market share analysis by country
CHAPTER 5: COMPOSITE CYLINDER MARKET, BY MATERIAL TYPE
5.1. Overview
5.1.1. Market size and forecast
5.2. Aramid Fiber Composites
5.2.1. Key market trends, growth factors and opportunities
5.2.2. Market size and forecast, by region
5.2.3. Market share analysis by country
5.3. HDPE Pipe/Liner
5.3.1. Key market trends, growth factors and opportunities
5.3.2. Market size and forecast, by region
5.3.3. Market share analysis by country
5.4. Glass Fiber Composites
5.4.1. Key market trends, growth factors and opportunities
5.4.2. Market size and forecast, by region
5.4.3. Market share analysis by country
5.5. Carbon Fiber Composites
5.5.1. Key market trends, growth factors and opportunities
5.5.2. Market size and forecast, by region
5.5.3. Market share analysis by country
CHAPTER 6: COMPOSITE CYLINDER MARKET, BY TANK TYPE
6.1. Overview
6.1.1. Market size and forecast
6.2. Type II
6.2.1. Key market trends, growth factors and opportunities
6.2.2. Market size and forecast, by region
6.2.3. Market share analysis by country
6.3. Type III
6.3.1. Key market trends, growth factors and opportunities
6.3.2. Market size and forecast, by region
6.3.3. Market share analysis by country
6.4. Type IV
6.4.1. Key market trends, growth factors and opportunities
6.4.2. Market size and forecast, by region
6.4.3. Market share analysis by country
CHAPTER 7: COMPOSITE CYLINDER MARKET, BY END-USE
7.1. Overview
7.1.1. Market size and forecast
7.2. Gas Carrier and Storage
7.2.1. Key market trends, growth factors and opportunities
7.2.2. Market size and forecast, by region
7.2.3. Market share analysis by country
7.3. Transportation
7.3.1. Key market trends, growth factors and opportunities
7.3.2. Market size and forecast, by region
7.3.3. Market share analysis by country
7.4. Life Support
7.4.1. Key market trends, growth factors and opportunities
7.4.2. Market size and forecast, by region
7.4.3. Market share analysis by country
7.5. Recreation
7.5.1. Key market trends, growth factors and opportunities
7.5.2. Market size and forecast, by region
7.5.3. Market share analysis by country
7.6. Others
7.6.1. Key market trends, growth factors and opportunities
7.6.2. Market size and forecast, by region
7.6.3. Market share analysis by country
CHAPTER 8: COMPOSITE CYLINDER MARKET, BY REGION
8.1. Overview
8.1.1. Market size and forecast By Region
8.2. North America
8.2.1. Key market trends, growth factors and opportunities
8.2.2. Market size and forecast, by Cylinder Type
8.2.3. Market size and forecast, by Material Type
8.2.4. Market size and forecast, by Tank Type
8.2.5. Market size and forecast, by End-Use
8.2.6. Market size and forecast, by country
8.2.6.1. U.S.
8.2.6.1.1. Market size and forecast, by Cylinder Type
8.2.6.1.2. Market size and forecast, by Material Type
8.2.6.1.3. Market size and forecast, by Tank Type
8.2.6.1.4. Market size and forecast, by End-Use
8.2.6.2. Canada
8.2.6.2.1. Market size and forecast, by Cylinder Type
8.2.6.2.2. Market size and forecast, by Material Type
8.2.6.2.3. Market size and forecast, by Tank Type
8.2.6.2.4. Market size and forecast, by End-Use
8.2.6.3. Mexico
8.2.6.3.1. Market size and forecast, by Cylinder Type
8.2.6.3.2. Market size and forecast, by Material Type
8.2.6.3.3. Market size and forecast, by Tank Type
8.2.6.3.4. Market size and forecast, by End-Use
8.3. Europe
8.3.1. Key market trends, growth factors and opportunities
8.3.2. Market size and forecast, by Cylinder Type
8.3.3. Market size and forecast, by Material Type
8.3.4. Market size and forecast, by Tank Type
8.3.5. Market size and forecast, by End-Use
8.3.6. Market size and forecast, by country
8.3.6.1. Germany
8.3.6.1.1. Market size and forecast, by Cylinder Type
8.3.6.1.2. Market size and forecast, by Material Type
8.3.6.1.3. Market size and forecast, by Tank Type
8.3.6.1.4. Market size and forecast, by End-Use
8.3.6.2. France
8.3.6.2.1. Market size and forecast, by Cylinder Type
8.3.6.2.2. Market size and forecast, by Material Type
8.3.6.2.3. Market size and forecast, by Tank Type
8.3.6.2.4. Market size and forecast, by End-Use
8.3.6.3. Italy
8.3.6.3.1. Market size and forecast, by Cylinder Type
8.3.6.3.2. Market size and forecast, by Material Type
8.3.6.3.3. Market size and forecast, by Tank Type
8.3.6.3.4. Market size and forecast, by End-Use
8.3.6.4. Spain
8.3.6.4.1. Market size and forecast, by Cylinder Type
8.3.6.4.2. Market size and forecast, by Material Type
8.3.6.4.3. Market size and forecast, by Tank Type
8.3.6.4.4. Market size and forecast, by End-Use
8.3.6.5. UK
8.3.6.5.1. Market size and forecast, by Cylinder Type
8.3.6.5.2. Market size and forecast, by Material Type
8.3.6.5.3. Market size and forecast, by Tank Type
8.3.6.5.4. Market size and forecast, by End-Use
8.3.6.6. Rest of Europe
8.3.6.6.1. Market size and forecast, by Cylinder Type
8.3.6.6.2. Market size and forecast, by Material Type
8.3.6.6.3. Market size and forecast, by Tank Type
8.3.6.6.4. Market size and forecast, by End-Use
8.4. Asia-Pacific
8.4.1. Key market trends, growth factors and opportunities
8.4.2. Market size and forecast, by Cylinder Type
8.4.3. Market size and forecast, by Material Type
8.4.4. Market size and forecast, by Tank Type
8.4.5. Market size and forecast, by End-Use
8.4.6. Market size and forecast, by country
8.4.6.1. China
8.4.6.1.1. Market size and forecast, by Cylinder Type
8.4.6.1.2. Market size and forecast, by Material Type
8.4.6.1.3. Market size and forecast, by Tank Type
8.4.6.1.4. Market size and forecast, by End-Use
8.4.6.2. India
8.4.6.2.1. Market size and forecast, by Cylinder Type
8.4.6.2.2. Market size and forecast, by Material Type
8.4.6.2.3. Market size and forecast, by Tank Type
8.4.6.2.4. Market size and forecast, by End-Use
8.4.6.3. Indonesia
8.4.6.3.1. Market size and forecast, by Cylinder Type
8.4.6.3.2. Market size and forecast, by Material Type
8.4.6.3.3. Market size and forecast, by Tank Type
8.4.6.3.4. Market size and forecast, by End-Use
8.4.6.4. Malaysia
8.4.6.4.1. Market size and forecast, by Cylinder Type
8.4.6.4.2. Market size and forecast, by Material Type
8.4.6.4.3. Market size and forecast, by Tank Type
8.4.6.4.4. Market size and forecast, by End-Use
8.4.6.5. Thailand
8.4.6.5.1. Market size and forecast, by Cylinder Type
8.4.6.5.2. Market size and forecast, by Material Type
8.4.6.5.3. Market size and forecast, by Tank Type
8.4.6.5.4. Market size and forecast, by End-Use
8.4.6.6. Taiwan, Republic Of China
8.4.6.6.1. Market size and forecast, by Cylinder Type
8.4.6.6.2. Market size and forecast, by Material Type
8.4.6.6.3. Market size and forecast, by Tank Type
8.4.6.6.4. Market size and forecast, by End-Use
8.4.6.7. Vietnam
8.4.6.7.1. Market size and forecast, by Cylinder Type
8.4.6.7.2. Market size and forecast, by Material Type
8.4.6.7.3. Market size and forecast, by Tank Type
8.4.6.7.4. Market size and forecast, by End-Use
8.4.6.8. Rest of Asia-Pacific
8.4.6.8.1. Market size and forecast, by Cylinder Type
8.4.6.8.2. Market size and forecast, by Material Type
8.4.6.8.3. Market size and forecast, by Tank Type
8.4.6.8.4. Market size and forecast, by End-Use
8.5. LAMEA
8.5.1. Key market trends, growth factors and opportunities
8.5.2. Market size and forecast, by Cylinder Type
8.5.3. Market size and forecast, by Material Type
8.5.4. Market size and forecast, by Tank Type
8.5.5. Market size and forecast, by End-Use
8.5.6. Market size and forecast, by country
8.5.6.1. Brazil
8.5.6.1.1. Market size and forecast, by Cylinder Type
8.5.6.1.2. Market size and forecast, by Material Type
8.5.6.1.3. Market size and forecast, by Tank Type
8.5.6.1.4. Market size and forecast, by End-Use
8.5.6.2. UAE
8.5.6.2.1. Market size and forecast, by Cylinder Type
8.5.6.2.2. Market size and forecast, by Material Type
8.5.6.2.3. Market size and forecast, by Tank Type
8.5.6.2.4. Market size and forecast, by End-Use
8.5.6.3. Bahrain
8.5.6.3.1. Market size and forecast, by Cylinder Type
8.5.6.3.2. Market size and forecast, by Material Type
8.5.6.3.3. Market size and forecast, by Tank Type
8.5.6.3.4. Market size and forecast, by End-Use
8.5.6.4. Egypt
8.5.6.4.1. Market size and forecast, by Cylinder Type
8.5.6.4.2. Market size and forecast, by Material Type
8.5.6.4.3. Market size and forecast, by Tank Type
8.5.6.4.4. Market size and forecast, by End-Use
8.5.6.5. Saudi Arabia
8.5.6.5.1. Market size and forecast, by Cylinder Type
8.5.6.5.2. Market size and forecast, by Material Type
8.5.6.5.3. Market size and forecast, by Tank Type
8.5.6.5.4. Market size and forecast, by End-Use
8.5.6.6. Rest of LAMEA
8.5.6.6.1. Market size and forecast, by Cylinder Type
8.5.6.6.2. Market size and forecast, by Material Type
8.5.6.6.3. Market size and forecast, by Tank Type
8.5.6.6.4. Market size and forecast, by End-Use
CHAPTER 9: COMPETITIVE LANDSCAPE
9.1. Introduction
9.2. Top winning strategies
9.3. Product mapping of top 10 player
9.4. Competitive dashboard
9.5. Competitive heatmap
9.6. Top player positioning, 2019
CHAPTER 10: COMPANY PROFILES
10.1. Hexagon Ragasco AS
10.1.1. Company overview
10.1.2. Key executives
10.1.3. Company snapshot
10.1.4. Operating business segments
10.1.5. Product portfolio
10.2. NPROXX
10.2.1. Company overview
10.2.2. Key executives
10.2.3. Company snapshot
10.2.4. Operating business segments
10.2.5. Product portfolio
10.2.6. Key strategic moves and developments
10.3. Amtrol-Alfa
10.3.1. Company overview
10.3.2. Key executives
10.3.3. Company snapshot
10.3.4. Operating business segments
10.3.5. Product portfolio
10.3.6. Key strategic moves and developments
10.4. Drgerwerk AG & Co. KGaA
10.4.1. Company overview
10.4.2. Key executives
10.4.3. Company snapshot
10.4.4. Operating business segments
10.4.5. Product portfolio
10.4.6. Business performance
10.5. EVAS
10.5.1. Company overview
10.5.2. Key executives
10.5.3. Company snapshot
10.5.4. Operating business segments
10.5.5. Product portfolio
10.6. FABER INDUSTRIE SPA
10.6.1. Company overview
10.6.2. Key executives
10.6.3. Company snapshot
10.6.4. Operating business segments
10.6.5. Product portfolio
10.6.6. Key strategic moves and developments
10.7. Luxfer Holdings PLC
10.7.1. Company overview
10.7.2. Key executives
10.7.3. Company snapshot
10.7.4. Operating business segments
10.7.5. Product portfolio
10.8. Quantum Fuel Systems LLC
10.8.1. Company overview
10.8.2. Key executives
10.8.3. Company snapshot
10.8.4. Operating business segments
10.8.5. Product portfolio
10.8.6. Key strategic moves and developments
10.9. Sinoma International Engineering Co., Ltd.
10.9.1. Company overview
10.9.2. Key executives
10.9.3. Company snapshot
10.9.4. Operating business segments
10.9.5. Product portfolio
10.10. AMS Composite Cylinders
10.10.1. Company overview
10.10.2. Key executives
10.10.3. Company snapshot
10.10.4. Operating business segments
10.10.5. Product portfolio
LIST OF TABLES
TABLE 01. GLOBAL COMPOSITE CYLINDER MARKET, BY CYLINDER TYPE, 2019-2030 ($MILLION)
TABLE 02. GLOBAL COMPOSITE CYLINDER MARKET, BY CYLINDER TYPE, 2019-2030 (000 UNITS)
TABLE 03. COMPOSITE CYLINDER MARKET FOR LPG, BY REGION, 2019-2030 ($MILLION)
TABLE 04. COMPOSITE CYLINDER MARKET FOR LPG, BY REGION, 2019-2030 (000 UNITS)
TABLE 05. COMPOSITE CYLINDER MARKET FOR CNG, BY REGION, 2019-2030 ($MILLION)
TABLE 06. COMPOSITE CYLINDER MARKET FOR CNG, BY REGION, 2019-2030 (000 UNITS)
TABLE 07. COMPOSITE CYLINDER MARKET FOR HYDROGEN, BY REGION, 2019-2030 ($MILLION)
TABLE 08. COMPOSITE CYLINDER MARKET FOR HYDROGEN, BY REGION, 2019-2030 (000 UNITS)
TABLE 09. COMPOSITE CYLINDER MARKET FOR OXYGEN, BY REGION, 2019-2030 ($MILLION)
TABLE 10. COMPOSITE CYLINDER MARKET FOR OXYGEN, BY REGION, 2019-2030 (000 UNITS)
TABLE 11. GLOBAL COMPOSITE CYLINDER MARKET, BY MATERIAL TYPE, 2019-2030 ($MILLION)
TABLE 12. GLOBAL COMPOSITE CYLINDER MARKET, BY MATERIAL TYPE, 2019-2030 (000 UNITS)
TABLE 13. COMPOSITE CYLINDER MARKET FOR ARAMID FIBER COMPOSITES, BY REGION, 2019-2030 ($MILLION)
TABLE 14. COMPOSITE CYLINDER MARKET FOR ARAMID FIBER COMPOSITES, BY REGION, 2019-2030 (000 UNITS)
TABLE 15. COMPOSITE CYLINDER MARKET FOR HDPE PIPE/LINER, BY REGION, 2019-2030 ($MILLION)
TABLE 16. COMPOSITE CYLINDER MARKET FOR HDPE PIPE/LINER, BY REGION, 2019-2030 (000 UNITS)
TABLE 17. COMPOSITE CYLINDER MARKET FOR GLASS FIBER COMPOSITES, BY REGION, 2019-2030 ($MILLION)
TABLE 18. COMPOSITE CYLINDER MARKET FOR GLASS FIBER COMPOSITES, BY REGION, 2019-2030 (000 UNITS)
TABLE 19. COMPOSITE CYLINDER MARKET FOR CARBON FIBER COMPOSITES, BY REGION, 2019-2030 ($MILLION)
TABLE 20. COMPOSITE CYLINDER MARKET FOR CARBON FIBER COMPOSITES, BY REGION, 2019-2030 (000 UNITS)
TABLE 21. GLOBAL COMPOSITE CYLINDER MARKET, BY TANK TYPE, 2019-2030 ($MILLION)
TABLE 22. GLOBAL COMPOSITE CYLINDER MARKET, BY TANK TYPE, 2019-2030 (000 UNITS)
TABLE 23. COMPOSITE CYLINDER MARKET FOR TYPE II, BY REGION, 2019-2030 ($MILLION)
TABLE 24. COMPOSITE CYLINDER MARKET FOR TYPE II, BY REGION, 2019-2030 (000 UNITS)
TABLE 25. COMPOSITE CYLINDER MARKET FOR TYPE III, BY REGION, 2019-2030 ($MILLION)
TABLE 26. COMPOSITE CYLINDER MARKET FOR TYPE III, BY REGION, 2019-2030 (000 UNITS)
TABLE 27. COMPOSITE CYLINDER MARKET FOR TYPE IV, BY REGION, 2019-2030 ($MILLION)
TABLE 28. COMPOSITE CYLINDER MARKET FOR TYPE IV, BY REGION, 2019-2030 (000 UNITS)
TABLE 29. GLOBAL COMPOSITE CYLINDER MARKET, BY END-USE, 2019-2030 ($MILLION)
TABLE 30. GLOBAL COMPOSITE CYLINDER MARKET, BY END-USE, 2019-2030 (000 UNITS)
TABLE 31. COMPOSITE CYLINDER MARKET FOR GAS CARRIER AND STORAGE, BY REGION, 2019-2030 ($MILLION)
TABLE 32. COMPOSITE CYLINDER MARKET FOR GAS CARRIER AND STORAGE, BY REGION, 2019-2030 (000 UNITS)
TABLE 33. COMPOSITE CYLINDER MARKET FOR TRANSPORTATION, BY REGION, 2019-2030 ($MILLION)
TABLE 34. COMPOSITE CYLINDER MARKET FOR TRANSPORTATION, BY REGION, 2019-2030 (000 UNITS)
TABLE 35. COMPOSITE CYLINDER MARKET FOR LIFE SUPPORT, BY REGION, 2019-2030 ($MILLION)
TABLE 36. COMPOSITE CYLINDER MARKET FOR LIFE SUPPORT, BY REGION, 2019-2030 (000 UNITS)
TABLE 37. COMPOSITE CYLINDER MARKET FOR RECREATION, BY REGION, 2019-2030 ($MILLION)
TABLE 38. COMPOSITE CYLINDER MARKET FOR RECREATION, BY REGION, 2019-2030 (000 UNITS)
TABLE 39. COMPOSITE CYLINDER MARKET FOR OTHERS, BY REGION, 2019-2030 ($MILLION)
TABLE 40. COMPOSITE CYLINDER MARKET FOR OTHERS, BY REGION, 2019-2030 (000 UNITS)
TABLE 41. COMPOSITE CYLINDER MARKET, BY REGION, 2019-2030 ($MILLION)
TABLE 42. COMPOSITE CYLINDER MARKET, BY REGION, 2019-2030 (000 UNITS)
TABLE 43. NORTH AMERICA COMPOSITE CYLINDER MARKET, BY CYLINDER TYPE, 2019-2030 ($MILLION)
TABLE 44. NORTH AMERICA COMPOSITE CYLINDER MARKET, BY CYLINDER TYPE, 2019-2030 (000 UNITS)
TABLE 45. NORTH AMERICA COMPOSITE CYLINDER MARKET, BY MATERIAL TYPE, 2019-2030 ($MILLION)
TABLE 46. NORTH AMERICA COMPOSITE CYLINDER MARKET, BY MATERIAL TYPE, 2019-2030 (000 UNITS)
TABLE 47. NORTH AMERICA COMPOSITE CYLINDER MARKET, BY TANK TYPE, 2019-2030 ($MILLION)
TABLE 48. NORTH AMERICA COMPOSITE CYLINDER MARKET, BY TANK TYPE, 2019-2030 (000 UNITS)
TABLE 49. NORTH AMERICA COMPOSITE CYLINDER MARKET, BY END-USE, 2019-2030 ($MILLION)
TABLE 50. NORTH AMERICA COMPOSITE CYLINDER MARKET, BY END-USE, 2019-2030 (000 UNITS)
TABLE 51. NORTH AMERICA COMPOSITE CYLINDER MARKET, BY COUNTRY, 2019-2030 ($MILLION)
TABLE 52. NORTH AMERICA COMPOSITE CYLINDER MARKET, BY COUNTRY, 2019-2030 (000 UNITS)
TABLE 53. U.S. COMPOSITE CYLINDER MARKET, BY CYLINDER TYPE, 2019-2030 ($MILLION)
TABLE 54. U.S. COMPOSITE CYLINDER MARKET, BY CYLINDER TYPE, 2019-2030 (000 UNITS)
TABLE 55. U.S. COMPOSITE CYLINDER MARKET, BY MATERIAL TYPE, 2019-2030 ($MILLION)
TABLE 56. U.S. COMPOSITE CYLINDER MARKET, BY MATERIAL TYPE, 2019-2030 (000 UNITS)
TABLE 57. U.S. COMPOSITE CYLINDER MARKET, BY TANK TYPE, 2019-2030 ($MILLION)
TABLE 58. U.S. COMPOSITE CYLINDER MARKET, BY TANK TYPE, 2019-2030 (000 UNITS)
TABLE 59. U.S. COMPOSITE CYLINDER MARKET, BY END-USE, 2019-2030 ($MILLION)
TABLE 60. U.S. COMPOSITE CYLINDER MARKET, BY END-USE, 2019-2030 (000 UNITS)
TABLE 61. CANADA COMPOSITE CYLINDER MARKET, BY CYLINDER TYPE, 2019-2030 ($MILLION)
TABLE 62. CANADA COMPOSITE CYLINDER MARKET, BY CYLINDER TYPE, 2019-2030 (000 UNITS)
TABLE 63. CANADA COMPOSITE CYLINDER MARKET, BY MATERIAL TYPE, 2019-2030 ($MILLION)
TABLE 64. CANADA COMPOSITE CYLINDER MARKET, BY MATERIAL TYPE, 2019-2030 (000 UNITS)
TABLE 65. CANADA COMPOSITE CYLINDER MARKET, BY TANK TYPE, 2019-2030 ($MILLION)
TABLE 66. CANADA COMPOSITE CYLINDER MARKET, BY TANK TYPE, 2019-2030 (000 UNITS)
TABLE 67. CANADA COMPOSITE CYLINDER MARKET, BY END-USE, 2019-2030 ($MILLION)
TABLE 68. CANADA COMPOSITE CYLINDER MARKET, BY END-USE, 2019-2030 (000 UNITS)
TABLE 69. MEXICO COMPOSITE CYLINDER MARKET, BY CYLINDER TYPE, 2019-2030 ($MILLION)
TABLE 70. MEXICO COMPOSITE CYLINDER MARKET, BY CYLINDER TYPE, 2019-2030 (000 UNITS)
TABLE 71. MEXICO COMPOSITE CYLINDER MARKET, BY MATERIAL TYPE, 2019-2030 ($MILLION)
TABLE 72. MEXICO COMPOSITE CYLINDER MARKET, BY MATERIAL TYPE, 2019-2030 (000 UNITS)
TABLE 73. MEXICO COMPOSITE CYLINDER MARKET, BY TANK TYPE, 2019-2030 ($MILLION)
TABLE 74. MEXICO COMPOSITE CYLINDER MARKET, BY TANK TYPE, 2019-2030 (000 UNITS)
TABLE 75. MEXICO COMPOSITE CYLINDER MARKET, BY END-USE, 2019-2030 ($MILLION)
TABLE 76. MEXICO COMPOSITE CYLINDER MARKET, BY END-USE, 2019-2030 (000 UNITS)
TABLE 77. EUROPE COMPOSITE CYLINDER MARKET, BY CYLINDER TYPE, 2019-2030 ($MILLION)
TABLE 78. EUROPE COMPOSITE CYLINDER MARKET, BY CYLINDER TYPE, 2019-2030 (000 UNITS)
TABLE 79. EUROPE COMPOSITE CYLINDER MARKET, BY MATERIAL TYPE, 2019-2030 ($MILLION)
TABLE 80. EUROPE COMPOSITE CYLINDER MARKET, BY MATERIAL TYPE, 2019-2030 (000 UNITS)
TABLE 81. EUROPE COMPOSITE CYLINDER MARKET, BY TANK TYPE, 2019-2030 ($MILLION)
TABLE 82. EUROPE COMPOSITE CYLINDER MARKET, BY TANK TYPE, 2019-2030 (000 UNITS)
TABLE 83. EUROPE COMPOSITE CYLINDER MARKET, BY END-USE, 2019-2030 ($MILLION)
TABLE 84. EUROPE COMPOSITE CYLINDER MARKET, BY END-USE, 2019-2030 (000 UNITS)
TABLE 85. EUROPE COMPOSITE CYLINDER MARKET, BY COUNTRY, 2019-2030 ($MILLION)
TABLE 86. EUROPE COMPOSITE CYLINDER MARKET, BY COUNTRY, 2019-2030 (000 UNITS)
TABLE 87. GERMANY COMPOSITE CYLINDER MARKET, BY CYLINDER TYPE, 2019-2030 ($MILLION)
TABLE 88. GERMANY COMPOSITE CYLINDER MARKET, BY CYLINDER TYPE, 2019-2030 (000 UNITS)
TABLE 89. GERMANY COMPOSITE CYLINDER MARKET, BY MATERIAL TYPE, 2019-2030 ($MILLION)
TABLE 90. GERMANY COMPOSITE CYLINDER MARKET, BY MATERIAL TYPE, 2019-2030 (000 UNITS)
TABLE 91. GERMANY COMPOSITE CYLINDER MARKET, BY TANK TYPE, 2019-2030 ($MILLION)
TABLE 92. GERMANY COMPOSITE CYLINDER MARKET, BY TANK TYPE, 2019-2030 (000 UNITS)
TABLE 93. GERMANY COMPOSITE CYLINDER MARKET, BY END-USE, 2019-2030 ($MILLION)
TABLE 94. GERMANY COMPOSITE CYLINDER MARKET, BY END-USE, 2019-2030 (000 UNITS)
TABLE 95. FRANCE COMPOSITE CYLINDER MARKET, BY CYLINDER TYPE, 2019-2030 ($MILLION)
TABLE 96. FRANCE COMPOSITE CYLINDER MARKET, BY CYLINDER TYPE, 2019-2030 (000 UNITS)
TABLE 97. FRANCE COMPOSITE CYLINDER MARKET, BY MATERIAL TYPE, 2019-2030 ($MILLION)
TABLE 98. FRANCE COMPOSITE CYLINDER MARKET, BY MATERIAL TYPE, 2019-2030 (000 UNITS)
TABLE 99. FRANCE COMPOSITE CYLINDER MARKET, BY TANK TYPE, 2019-2030 ($MILLION)
TABLE 100. FRANCE COMPOSITE CYLINDER MARKET, BY TANK TYPE, 2019-2030 (000 UNITS)
TABLE 101. FRANCE COMPOSITE CYLINDER MARKET, BY END-USE, 2019-2030 ($MILLION)
TABLE 102. FRANCE COMPOSITE CYLINDER MARKET, BY END-USE, 2019-2030 (000 UNITS)
TABLE 103. ITALY COMPOSITE CYLINDER MARKET, BY CYLINDER TYPE, 2019-2030 ($MILLION)
TABLE 104. ITALY COMPOSITE CYLINDER MARKET, BY CYLINDER TYPE, 2019-2030 (000 UNITS)
TABLE 105. ITALY COMPOSITE CYLINDER MARKET, BY MATERIAL TYPE, 2019-2030 ($MILLION)
TABLE 106. ITALY COMPOSITE CYLINDER MARKET, BY MATERIAL TYPE, 2019-2030 (000 UNITS)
TABLE 107. ITALY COMPOSITE CYLINDER MARKET, BY TANK TYPE, 2019-2030 ($MILLION)
TABLE 108. ITALY COMPOSITE CYLINDER MARKET, BY TANK TYPE, 2019-2030 (000 UNITS)
TABLE 109. ITALY COMPOSITE CYLINDER MARKET, BY END-USE, 2019-2030 ($MILLION)
TABLE 110. ITALY COMPOSITE CYLINDER MARKET, BY END-USE, 2019-2030 (000 UNITS)
TABLE 111. SPAIN COMPOSITE CYLINDER MARKET, BY CYLINDER TYPE, 2019-2030 ($MILLION)
TABLE 112. SPAIN COMPOSITE CYLINDER MARKET, BY CYLINDER TYPE, 2019-2030 (000 UNITS)
TABLE 113. SPAIN COMPOSITE CYLINDER MARKET, BY MATERIAL TYPE, 2019-2030 ($MILLION)
TABLE 114. SPAIN COMPOSITE CYLINDER MARKET, BY MATERIAL TYPE, 2019-2030 (000 UNITS)
TABLE 115. SPAIN COMPOSITE CYLINDER MARKET, BY TANK TYPE, 2019-2030 ($MILLION)
TABLE 116. SPAIN COMPOSITE CYLINDER MARKET, BY TANK TYPE, 2019-2030 (000 UNITS)
TABLE 117. SPAIN COMPOSITE CYLINDER MARKET, BY END-USE, 2019-2030 ($MILLION)
TABLE 118. SPAIN COMPOSITE CYLINDER MARKET, BY END-USE, 2019-2030 (000 UNITS)
TABLE 119. UK COMPOSITE CYLINDER MARKET, BY CYLINDER TYPE, 2019-2030 ($MILLION)
TABLE 120. UK COMPOSITE CYLINDER MARKET, BY CYLINDER TYPE, 2019-2030 (000 UNITS)
TABLE 121. UK COMPOSITE CYLINDER MARKET, BY MATERIAL TYPE, 2019-2030 ($MILLION)
TABLE 122. UK COMPOSITE CYLINDER MARKET, BY MATERIAL TYPE, 2019-2030 (000 UNITS)
TABLE 123. UK COMPOSITE CYLINDER MARKET, BY TANK TYPE, 2019-2030 ($MILLION)
TABLE 124. UK COMPOSITE CYLINDER MARKET, BY TANK TYPE, 2019-2030 (000 UNITS)
TABLE 125. UK COMPOSITE CYLINDER MARKET, BY END-USE, 2019-2030 ($MILLION)
TABLE 126. UK COMPOSITE CYLINDER MARKET, BY END-USE, 2019-2030 (000 UNITS)
TABLE 127. REST OF EUROPE COMPOSITE CYLINDER MARKET, BY CYLINDER TYPE, 2019-2030 ($MILLION)
TABLE 128. REST OF EUROPE COMPOSITE CYLINDER MARKET, BY CYLINDER TYPE, 2019-2030 (000 UNITS)
TABLE 129. REST OF EUROPE COMPOSITE CYLINDER MARKET, BY MATERIAL TYPE, 2019-2030 ($MILLION)
TABLE 130. REST OF EUROPE COMPOSITE CYLINDER MARKET, BY MATERIAL TYPE, 2019-2030 (000 UNITS)
TABLE 131. REST OF EUROPE COMPOSITE CYLINDER MARKET, BY TANK TYPE, 2019-2030 ($MILLION)
TABLE 132. REST OF EUROPE COMPOSITE CYLINDER MARKET, BY TANK TYPE, 2019-2030 (000 UNITS)
TABLE 133. REST OF EUROPE COMPOSITE CYLINDER MARKET, BY END-USE, 2019-2030 ($MILLION)
TABLE 134. REST OF EUROPE COMPOSITE CYLINDER MARKET, BY END-USE, 2019-2030 (000 UNITS)
TABLE 135. ASIA-PACIFIC COMPOSITE CYLINDER MARKET, BY CYLINDER TYPE, 2019-2030 ($MILLION)
TABLE 136. ASIA-PACIFIC COMPOSITE CYLINDER MARKET, BY CYLINDER TYPE, 2019-2030 (000 UNITS)
TABLE 137. ASIA-PACIFIC COMPOSITE CYLINDER MARKET, BY MATERIAL TYPE, 2019-2030 ($MILLION)
TABLE 138. ASIA-PACIFIC COMPOSITE CYLINDER MARKET, BY MATERIAL TYPE, 2019-2030 (000 UNITS)
TABLE 139. ASIA-PACIFIC COMPOSITE CYLINDER MARKET, BY TANK TYPE, 2019-2030 ($MILLION)
TABLE 140. ASIA-PACIFIC COMPOSITE CYLINDER MARKET, BY TANK TYPE, 2019-2030 (000 UNITS)
TABLE 141. ASIA-PACIFIC COMPOSITE CYLINDER MARKET, BY END-USE, 2019-2030 ($MILLION)
TABLE 142. ASIA-PACIFIC COMPOSITE CYLINDER MARKET, BY END-USE, 2019-2030 (000 UNITS)
TABLE 143. ASIA-PACIFIC COMPOSITE CYLINDER MARKET, BY COUNTRY, 2019-2030 ($MILLION)
TABLE 144. ASIA-PACIFIC COMPOSITE CYLINDER MARKET, BY COUNTRY, 2019-2030 (000 UNITS)
TABLE 145. CHINA COMPOSITE CYLINDER MARKET, BY CYLINDER TYPE, 2019-2030 ($MILLION)
TABLE 146. CHINA COMPOSITE CYLINDER MARKET, BY CYLINDER TYPE, 2019-2030 (000 UNITS)
TABLE 147. CHINA COMPOSITE CYLINDER MARKET, BY MATERIAL TYPE, 2019-2030 ($MILLION)
TABLE 148. CHINA COMPOSITE CYLINDER MARKET, BY MATERIAL TYPE, 2019-2030 (000 UNITS)
TABLE 149. CHINA COMPOSITE CYLINDER MARKET, BY TANK TYPE, 2019-2030 ($MILLION)
TABLE 150. CHINA COMPOSITE CYLINDER MARKET, BY TANK TYPE, 2019-2030 (000 UNITS)
TABLE 151. CHINA COMPOSITE CYLINDER MARKET, BY END-USE, 2019-2030 ($MILLION)
TABLE 152. CHINA COMPOSITE CYLINDER MARKET, BY END-USE, 2019-2030 (000 UNITS)
TABLE 153. INDIA COMPOSITE CYLINDER MARKET, BY CYLINDER TYPE, 2019-2030 ($MILLION)
TABLE 154. INDIA COMPOSITE CYLINDER MARKET, BY CYLINDER TYPE, 2019-2030 (000 UNITS)
TABLE 155. INDIA COMPOSITE CYLINDER MARKET, BY MATERIAL TYPE, 2019-2030 ($MILLION)
TABLE 156. INDIA COMPOSITE CYLINDER MARKET, BY MATERIAL TYPE, 2019-2030 (000 UNITS)
TABLE 157. INDIA COMPOSITE CYLINDER MARKET, BY TANK TYPE, 2019-2030 ($MILLION)
TABLE 158. INDIA COMPOSITE CYLINDER MARKET, BY TANK TYPE, 2019-2030 (000 UNITS)
TABLE 159. INDIA COMPOSITE CYLINDER MARKET, BY END-USE, 2019-2030 ($MILLION)
TABLE 160. INDIA COMPOSITE CYLINDER MARKET, BY END-USE, 2019-2030 (000 UNITS)
TABLE 161. INDONESIA COMPOSITE CYLINDER MARKET, BY CYLINDER TYPE, 2019-2030 ($MILLION)
TABLE 162. INDONESIA COMPOSITE CYLINDER MARKET, BY CYLINDER TYPE, 2019-2030 (000 UNITS)
TABLE 163. INDONESIA COMPOSITE CYLINDER MARKET, BY MATERIAL TYPE, 2019-2030 ($MILLION)
TABLE 164. INDONESIA COMPOSITE CYLINDER MARKET, BY MATERIAL TYPE, 2019-2030 (000 UNITS)
TABLE 165. INDONESIA COMPOSITE CYLINDER MARKET, BY TANK TYPE, 2019-2030 ($MILLION)
TABLE 166. INDONESIA COMPOSITE CYLINDER MARKET, BY TANK TYPE, 2019-2030 (000 UNITS)
TABLE 167. INDONESIA COMPOSITE CYLINDER MARKET, BY END-USE, 2019-2030 ($MILLION)
TABLE 168. INDONESIA COMPOSITE CYLINDER MARKET, BY END-USE, 2019-2030 (000 UNITS)
TABLE 169. MALAYSIA COMPOSITE CYLINDER MARKET, BY CYLINDER TYPE, 2019-2030 ($MILLION)
TABLE 170. MALAYSIA COMPOSITE CYLINDER MARKET, BY CYLINDER TYPE, 2019-2030 (000 UNITS)
TABLE 171. MALAYSIA COMPOSITE CYLINDER MARKET, BY MATERIAL TYPE, 2019-2030 ($MILLION)
TABLE 172. MALAYSIA COMPOSITE CYLINDER MARKET, BY MATERIAL TYPE, 2019-2030 (000 UNITS)
TABLE 173. MALAYSIA COMPOSITE CYLINDER MARKET, BY TANK TYPE, 2019-2030 ($MILLION)
TABLE 174. MALAYSIA COMPOSITE CYLINDER MARKET, BY TANK TYPE, 2019-2030 (000 UNITS)
TABLE 175. MALAYSIA COMPOSITE CYLINDER MARKET, BY END-USE, 2019-2030 ($MILLION)
TABLE 176. MALAYSIA COMPOSITE CYLINDER MARKET, BY END-USE, 2019-2030 (000 UNITS)
TABLE 177. THAILAND COMPOSITE CYLINDER MARKET, BY CYLINDER TYPE, 2019-2030 ($MILLION)
TABLE 178. THAILAND COMPOSITE CYLINDER MARKET, BY CYLINDER TYPE, 2019-2030 (000 UNITS)
TABLE 179. THAILAND COMPOSITE CYLINDER MARKET, BY MATERIAL TYPE, 2019-2030 ($MILLION)
TABLE 180. THAILAND COMPOSITE CYLINDER MARKET, BY MATERIAL TYPE, 2019-2030 (000 UNITS)
TABLE 181. THAILAND COMPOSITE CYLINDER MARKET, BY TANK TYPE, 2019-2030 ($MILLION)
TABLE 182. THAILAND COMPOSITE CYLINDER MARKET, BY TANK TYPE, 2019-2030 (000 UNITS)
TABLE 183. THAILAND COMPOSITE CYLINDER MARKET, BY END-USE, 2019-2030 ($MILLION)
TABLE 184. THAILAND COMPOSITE CYLINDER MARKET, BY END-USE, 2019-2030 (000 UNITS)
TABLE 185. TAIWAN, REPUBLIC OF CHINA COMPOSITE CYLINDER MARKET, BY CYLINDER TYPE, 2019-2030 ($MILLION)
TABLE 186. TAIWAN, REPUBLIC OF CHINA COMPOSITE CYLINDER MARKET, BY CYLINDER TYPE, 2019-2030 (000 UNITS)
TABLE 187. TAIWAN, REPUBLIC OF CHINA COMPOSITE CYLINDER MARKET, BY MATERIAL TYPE, 2019-2030 ($MILLION)
TABLE 188. TAIWAN, REPUBLIC OF CHINA COMPOSITE CYLINDER MARKET, BY MATERIAL TYPE, 2019-2030 (000 UNITS)
TABLE 189. TAIWAN, REPUBLIC OF CHINA COMPOSITE CYLINDER MARKET, BY TANK TYPE, 2019-2030 ($MILLION)
TABLE 190. TAIWAN, REPUBLIC OF CHINA COMPOSITE CYLINDER MARKET, BY TANK TYPE, 2019-2030 (000 UNITS)
TABLE 191. TAIWAN, REPUBLIC OF CHINA COMPOSITE CYLINDER MARKET, BY END-USE, 2019-2030 ($MILLION)
TABLE 192. TAIWAN, REPUBLIC OF CHINA COMPOSITE CYLINDER MARKET, BY END-USE, 2019-2030 (000 UNITS)
TABLE 193. VIETNAM COMPOSITE CYLINDER MARKET, BY CYLINDER TYPE, 2019-2030 ($MILLION)
TABLE 194. VIETNAM COMPOSITE CYLINDER MARKET, BY CYLINDER TYPE, 2019-2030 (000 UNITS)
TABLE 195. VIETNAM COMPOSITE CYLINDER MARKET, BY MATERIAL TYPE, 2019-2030 ($MILLION)
TABLE 196. VIETNAM COMPOSITE CYLINDER MARKET, BY MATERIAL TYPE, 2019-2030 (000 UNITS)
TABLE 197. VIETNAM COMPOSITE CYLINDER MARKET, BY TANK TYPE, 2019-2030 ($MILLION)
TABLE 198. VIETNAM COMPOSITE CYLINDER MARKET, BY TANK TYPE, 2019-2030 (000 UNITS)
TABLE 199. VIETNAM COMPOSITE CYLINDER MARKET, BY END-USE, 2019-2030 ($MILLION)
TABLE 200. VIETNAM COMPOSITE CYLINDER MARKET, BY END-USE, 2019-2030 (000 UNITS)
TABLE 201. REST OF ASIA-PACIFIC COMPOSITE CYLINDER MARKET, BY CYLINDER TYPE, 2019-2030 ($MILLION)
TABLE 202. REST OF ASIA-PACIFIC COMPOSITE CYLINDER MARKET, BY CYLINDER TYPE, 2019-2030 (000 UNITS)
TABLE 203. REST OF ASIA-PACIFIC COMPOSITE CYLINDER MARKET, BY MATERIAL TYPE, 2019-2030 ($MILLION)
TABLE 204. REST OF ASIA-PACIFIC COMPOSITE CYLINDER MARKET, BY MATERIAL TYPE, 2019-2030 (000 UNITS)
TABLE 205. REST OF ASIA-PACIFIC COMPOSITE CYLINDER MARKET, BY TANK TYPE, 2019-2030 ($MILLION)
TABLE 206. REST OF ASIA-PACIFIC COMPOSITE CYLINDER MARKET, BY TANK TYPE, 2019-2030 (000 UNITS)
TABLE 207. REST OF ASIA-PACIFIC COMPOSITE CYLINDER MARKET, BY END-USE, 2019-2030 ($MILLION)
TABLE 208. REST OF ASIA-PACIFIC COMPOSITE CYLINDER MARKET, BY END-USE, 2019-2030 (000 UNITS)
TABLE 209. LAMEA COMPOSITE CYLINDER MARKET, BY CYLINDER TYPE, 2019-2030 ($MILLION)
TABLE 210. LAMEA COMPOSITE CYLINDER MARKET, BY CYLINDER TYPE, 2019-2030 (000 UNITS)
TABLE 211. LAMEA COMPOSITE CYLINDER MARKET, BY MATERIAL TYPE, 2019-2030 ($MILLION)
TABLE 212. LAMEA COMPOSITE CYLINDER MARKET, BY MATERIAL TYPE, 2019-2030 (000 UNITS)
TABLE 213. LAMEA COMPOSITE CYLINDER MARKET, BY TANK TYPE, 2019-2030 ($MILLION)
TABLE 214. LAMEA COMPOSITE CYLINDER MARKET, BY TANK TYPE, 2019-2030 (000 UNITS)
TABLE 215. LAMEA COMPOSITE CYLINDER MARKET, BY END-USE, 2019-2030 ($MILLION)
TABLE 216. LAMEA COMPOSITE CYLINDER MARKET, BY END-USE, 2019-2030 (000 UNITS)
TABLE 217. LAMEA COMPOSITE CYLINDER MARKET, BY COUNTRY, 2019-2030 ($MILLION)
TABLE 218. LAMEA COMPOSITE CYLINDER MARKET, BY COUNTRY, 2019-2030 (000 UNITS)
TABLE 219. BRAZIL COMPOSITE CYLINDER MARKET, BY CYLINDER TYPE, 2019-2030 ($MILLION)
TABLE 220. BRAZIL COMPOSITE CYLINDER MARKET, BY CYLINDER TYPE, 2019-2030 (000 UNITS)
TABLE 221. BRAZIL COMPOSITE CYLINDER MARKET, BY MATERIAL TYPE, 2019-2030 ($MILLION)
TABLE 222. BRAZIL COMPOSITE CYLINDER MARKET, BY MATERIAL TYPE, 2019-2030 (000 UNITS)
TABLE 223. BRAZIL COMPOSITE CYLINDER MARKET, BY TANK TYPE, 2019-2030 ($MILLION)
TABLE 224. BRAZIL COMPOSITE CYLINDER MARKET, BY TANK TYPE, 2019-2030 (000 UNITS)
TABLE 225. BRAZIL COMPOSITE CYLINDER MARKET, BY END-USE, 2019-2030 ($MILLION)
TABLE 226. BRAZIL COMPOSITE CYLINDER MARKET, BY END-USE, 2019-2030 (000 UNITS)
TABLE 227. UAE COMPOSITE CYLINDER MARKET, BY CYLINDER TYPE, 2019-2030 ($MILLION)
TABLE 228. UAE COMPOSITE CYLINDER MARKET, BY CYLINDER TYPE, 2019-2030 (000 UNITS)
TABLE 229. UAE COMPOSITE CYLINDER MARKET, BY MATERIAL TYPE, 2019-2030 ($MILLION)
TABLE 230. UAE COMPOSITE CYLINDER MARKET, BY MATERIAL TYPE, 2019-2030 (000 UNITS)
TABLE 231. UAE COMPOSITE CYLINDER MARKET, BY TANK TYPE, 2019-2030 ($MILLION)
TABLE 232. UAE COMPOSITE CYLINDER MARKET, BY TANK TYPE, 2019-2030 (000 UNITS)
TABLE 233. UAE COMPOSITE CYLINDER MARKET, BY END-USE, 2019-2030 ($MILLION)
TABLE 234. UAE COMPOSITE CYLINDER MARKET, BY END-USE, 2019-2030 (000 UNITS)
TABLE 235. BAHRAIN COMPOSITE CYLINDER MARKET, BY CYLINDER TYPE, 2019-2030 ($MILLION)
TABLE 236. BAHRAIN COMPOSITE CYLINDER MARKET, BY CYLINDER TYPE, 2019-2030 (000 UNITS)
TABLE 237. BAHRAIN COMPOSITE CYLINDER MARKET, BY MATERIAL TYPE, 2019-2030 ($MILLION)
TABLE 238. BAHRAIN COMPOSITE CYLINDER MARKET, BY MATERIAL TYPE, 2019-2030 (000 UNITS)
TABLE 239. BAHRAIN COMPOSITE CYLINDER MARKET, BY TANK TYPE, 2019-2030 ($MILLION)
TABLE 240. BAHRAIN COMPOSITE CYLINDER MARKET, BY TANK TYPE, 2019-2030 (000 UNITS)
TABLE 241. BAHRAIN COMPOSITE CYLINDER MARKET, BY END-USE, 2019-2030 ($MILLION)
TABLE 242. BAHRAIN COMPOSITE CYLINDER MARKET, BY END-USE, 2019-2030 (000 UNITS)
TABLE 243. EGYPT COMPOSITE CYLINDER MARKET, BY CYLINDER TYPE, 2019-2030 ($MILLION)
TABLE 244. EGYPT COMPOSITE CYLINDER MARKET, BY CYLINDER TYPE, 2019-2030 (000 UNITS)
TABLE 245. EGYPT COMPOSITE CYLINDER MARKET, BY MATERIAL TYPE, 2019-2030 ($MILLION)
TABLE 246. EGYPT COMPOSITE CYLINDER MARKET, BY MATERIAL TYPE, 2019-2030 (000 UNITS)
TABLE 247. EGYPT COMPOSITE CYLINDER MARKET, BY TANK TYPE, 2019-2030 ($MILLION)
TABLE 248. EGYPT COMPOSITE CYLINDER MARKET, BY TANK TYPE, 2019-2030 (000 UNITS)
TABLE 249. EGYPT COMPOSITE CYLINDER MARKET, BY END-USE, 2019-2030 ($MILLION)
TABLE 250. EGYPT COMPOSITE CYLINDER MARKET, BY END-USE, 2019-2030 (000 UNITS)
TABLE 251. SAUDI ARABIA COMPOSITE CYLINDER MARKET, BY CYLINDER TYPE, 2019-2030 ($MILLION)
TABLE 252. SAUDI ARABIA COMPOSITE CYLINDER MARKET, BY CYLINDER TYPE, 2019-2030 (000 UNITS)
TABLE 253. SAUDI ARABIA COMPOSITE CYLINDER MARKET, BY MATERIAL TYPE, 2019-2030 ($MILLION)
TABLE 254. SAUDI ARABIA COMPOSITE CYLINDER MARKET, BY MATERIAL TYPE, 2019-2030 (000 UNITS)
TABLE 255. SAUDI ARABIA COMPOSITE CYLINDER MARKET, BY TANK TYPE, 2019-2030 ($MILLION)
TABLE 256. SAUDI ARABIA COMPOSITE CYLINDER MARKET, BY TANK TYPE, 2019-2030 (000 UNITS)
TABLE 257. SAUDI ARABIA COMPOSITE CYLINDER MARKET, BY END-USE, 2019-2030 ($MILLION)
TABLE 258. SAUDI ARABIA COMPOSITE CYLINDER MARKET, BY END-USE, 2019-2030 (000 UNITS)
TABLE 259. REST OF LAMEA COMPOSITE CYLINDER MARKET, BY CYLINDER TYPE, 2019-2030 ($MILLION)
TABLE 260. REST OF LAMEA COMPOSITE CYLINDER MARKET, BY CYLINDER TYPE, 2019-2030 (000 UNITS)
TABLE 261. REST OF LAMEA COMPOSITE CYLINDER MARKET, BY MATERIAL TYPE, 2019-2030 ($MILLION)
TABLE 262. REST OF LAMEA COMPOSITE CYLINDER MARKET, BY MATERIAL TYPE, 2019-2030 (000 UNITS)
TABLE 263. REST OF LAMEA COMPOSITE CYLINDER MARKET, BY TANK TYPE, 2019-2030 ($MILLION)
TABLE 264. REST OF LAMEA COMPOSITE CYLINDER MARKET, BY TANK TYPE, 2019-2030 (000 UNITS)
TABLE 265. REST OF LAMEA COMPOSITE CYLINDER MARKET, BY END-USE, 2019-2030 ($MILLION)
TABLE 266. REST OF LAMEA COMPOSITE CYLINDER MARKET, BY END-USE, 2019-2030 (000 UNITS)
TABLE 267. HEXAGON RAGASCO AS: KEY EXECUTIVES
TABLE 268. HEXAGON RAGASCO AS: COMPANY SNAPSHOT
TABLE 269. HEXAGON RAGASCO AS: PRODUCT SEGMENTS
TABLE 270. HEXAGON RAGASCO AS: PRODUCT PORTFOLIO
TABLE 271. NPROXX: KEY EXECUTIVES
TABLE 272. NPROXX: COMPANY SNAPSHOT
TABLE 273. NPROXX: PRODUCT SEGMENTS
TABLE 274. NPROXX: PRODUCT PORTFOLIO
TABLE 275. NPROXX: KEY STRATERGIES
TABLE 276. AMTROL-ALFA: KEY EXECUTIVES
TABLE 277. AMTROL-ALFA: COMPANY SNAPSHOT
TABLE 278. AMTROL-ALFA: PRODUCT SEGMENTS
TABLE 279. AMTROL-ALFA: PRODUCT PORTFOLIO
TABLE 280. AMTROL-ALFA: KEY STRATERGIES
TABLE 281. DRGERWERK AG & CO. KGAA: KEY EXECUTIVES
TABLE 282. DRGERWERK AG & CO. KGAA: COMPANY SNAPSHOT
TABLE 283. DRGERWERK AG & CO. KGAA: PRODUCT SEGMENTS
TABLE 284. DRGERWERK AG & CO. KGAA: PRODUCT PORTFOLIO
TABLE 285. EVAS: KEY EXECUTIVES
TABLE 286. EVAS: COMPANY SNAPSHOT
TABLE 287. EVAS: PRODUCT SEGMENTS
TABLE 288. EVAS: PRODUCT PORTFOLIO
TABLE 289. FABER INDUSTRIE SPA: KEY EXECUTIVES
TABLE 290. FABER INDUSTRIE SPA: COMPANY SNAPSHOT
TABLE 291. FABER INDUSTRIE SPA: PRODUCT SEGMENTS
TABLE 292. FABER INDUSTRIE SPA: PRODUCT PORTFOLIO
TABLE 293. FABER INDUSTRIE SPA: KEY STRATERGIES
TABLE 294. LUXFER HOLDINGS PLC: KEY EXECUTIVES
TABLE 295. LUXFER HOLDINGS PLC: COMPANY SNAPSHOT
TABLE 296. LUXFER HOLDINGS PLC: PRODUCT SEGMENTS
TABLE 297. LUXFER HOLDINGS PLC: PRODUCT PORTFOLIO
TABLE 298. QUANTUM FUEL SYSTEMS LLC: KEY EXECUTIVES
TABLE 299. QUANTUM FUEL SYSTEMS LLC: COMPANY SNAPSHOT
TABLE 300. QUANTUM FUEL SYSTEMS LLC: PRODUCT SEGMENTS
TABLE 301. QUANTUM FUEL SYSTEMS LLC: PRODUCT PORTFOLIO
TABLE 302. QUANTUM FUEL SYSTEMS LLC: KEY STRATERGIES
TABLE 303. SINOMA INTERNATIONAL ENGINEERING CO., LTD.: KEY EXECUTIVES
TABLE 304. SINOMA INTERNATIONAL ENGINEERING CO., LTD.: COMPANY SNAPSHOT
TABLE 305. SINOMA INTERNATIONAL ENGINEERING CO., LTD.: PRODUCT SEGMENTS
TABLE 306. SINOMA INTERNATIONAL ENGINEERING CO., LTD.: PRODUCT PORTFOLIO
TABLE 307. AMS COMPOSITE CYLINDERS: KEY EXECUTIVES
TABLE 308. AMS COMPOSITE CYLINDERS: COMPANY SNAPSHOT
TABLE 309. AMS COMPOSITE CYLINDERS: PRODUCT SEGMENTS
TABLE 310. AMS COMPOSITE CYLINDERS: PRODUCT PORTFOLIO
LIST OF FIGURES
FIGURE 01. COMPOSITE CYLINDER MARKET, 2019-2030
FIGURE 02. SEGMENTATION OF COMPOSITE CYLINDER MARKET,2019-2030
FIGURE 03. TOP IMPACTING FACTORS IN COMPOSITE CYLINDER MARKET (2019 TO 2030)
FIGURE 04. TOP INVESTMENT POCKETS IN COMPOSITE CYLINDER MARKET (2025-2030)
FIGURE 05. MODERATE BARGAINING POWER OF SUPPLIERS
FIGURE 06. MODERATE THREAT OF NEW ENTRANTS
FIGURE 07. MODERATE THREAT OF SUBSTITUTES
FIGURE 08. MODERATE INTENSITY OF RIVALRY
FIGURE 09. MODERATE BARGAINING POWER OF BUYERS
FIGURE 10. GLOBAL COMPOSITE CYLINDER MARKET:DRIVERS, RESTRAINTS AND OPPORTUNITIES
FIGURE 11. COMPOSITE CYLINDER MARKET, BY CYLINDER TYPE, 2019 AND 2030(%)
FIGURE 12. COMPARATIVE SHARE ANALYSIS OF COMPOSITE CYLINDER MARKET FOR LPG, BY COUNTRY 2019 AND 2030(%)
FIGURE 13. COMPARATIVE SHARE ANALYSIS OF COMPOSITE CYLINDER MARKET FOR CNG, BY COUNTRY 2019 AND 2030(%)
FIGURE 14. COMPARATIVE SHARE ANALYSIS OF COMPOSITE CYLINDER MARKET FOR HYDROGEN, BY COUNTRY 2019 AND 2030(%)
FIGURE 15. COMPARATIVE SHARE ANALYSIS OF COMPOSITE CYLINDER MARKET FOR OXYGEN, BY COUNTRY 2019 AND 2030(%)
FIGURE 16. COMPOSITE CYLINDER MARKET, BY MATERIAL TYPE, 2019 AND 2030(%)
FIGURE 17. COMPARATIVE SHARE ANALYSIS OF COMPOSITE CYLINDER MARKET FOR ARAMID FIBER COMPOSITES, BY COUNTRY 2019 AND 2030(%)
FIGURE 18. COMPARATIVE SHARE ANALYSIS OF COMPOSITE CYLINDER MARKET FOR HDPE PIPE/LINER, BY COUNTRY 2019 AND 2030(%)
FIGURE 19. COMPARATIVE SHARE ANALYSIS OF COMPOSITE CYLINDER MARKET FOR GLASS FIBER COMPOSITES, BY COUNTRY 2019 AND 2030(%)
FIGURE 20. COMPARATIVE SHARE ANALYSIS OF COMPOSITE CYLINDER MARKET FOR CARBON FIBER COMPOSITES, BY COUNTRY 2019 AND 2030(%)
FIGURE 21. COMPOSITE CYLINDER MARKET, BY TANK TYPE, 2019 AND 2030(%)
FIGURE 22. COMPARATIVE SHARE ANALYSIS OF COMPOSITE CYLINDER MARKET FOR TYPE II, BY COUNTRY 2019 AND 2030(%)
FIGURE 23. COMPARATIVE SHARE ANALYSIS OF COMPOSITE CYLINDER MARKET FOR TYPE III, BY COUNTRY 2019 AND 2030(%)
FIGURE 24. COMPARATIVE SHARE ANALYSIS OF COMPOSITE CYLINDER MARKET FOR TYPE IV, BY COUNTRY 2019 AND 2030(%)
FIGURE 25. COMPOSITE CYLINDER MARKET, BY END-USE, 2019 AND 2030(%)
FIGURE 26. COMPARATIVE SHARE ANALYSIS OF COMPOSITE CYLINDER MARKET FOR GAS CARRIER AND STORAGE, BY COUNTRY 2019 AND 2030(%)
FIGURE 27. COMPARATIVE SHARE ANALYSIS OF COMPOSITE CYLINDER MARKET FOR TRANSPORTATION, BY COUNTRY 2019 AND 2030(%)
FIGURE 28. COMPARATIVE SHARE ANALYSIS OF COMPOSITE CYLINDER MARKET FOR LIFE SUPPORT, BY COUNTRY 2019 AND 2030(%)
FIGURE 29. COMPARATIVE SHARE ANALYSIS OF COMPOSITE CYLINDER MARKET FOR RECREATION, BY COUNTRY 2019 AND 2030(%)
FIGURE 30. COMPARATIVE SHARE ANALYSIS OF COMPOSITE CYLINDER MARKET FOR OTHERS, BY COUNTRY 2019 AND 2030(%)
FIGURE 31. COMPOSITE CYLINDER MARKET BY REGION, 2019 AND 2030(%)
FIGURE 32. U.S. COMPOSITE CYLINDER MARKET, 2019-2030 ($MILLION)
FIGURE 33. CANADA COMPOSITE CYLINDER MARKET, 2019-2030 ($MILLION)
FIGURE 34. MEXICO COMPOSITE CYLINDER MARKET, 2019-2030 ($MILLION)
FIGURE 35. GERMANY COMPOSITE CYLINDER MARKET, 2019-2030 ($MILLION)
FIGURE 36. FRANCE COMPOSITE CYLINDER MARKET, 2019-2030 ($MILLION)
FIGURE 37. ITALY COMPOSITE CYLINDER MARKET, 2019-2030 ($MILLION)
FIGURE 38. SPAIN COMPOSITE CYLINDER MARKET, 2019-2030 ($MILLION)
FIGURE 39. UK COMPOSITE CYLINDER MARKET, 2019-2030 ($MILLION)
FIGURE 40. REST OF EUROPE COMPOSITE CYLINDER MARKET, 2019-2030 ($MILLION)
FIGURE 41. CHINA COMPOSITE CYLINDER MARKET, 2019-2030 ($MILLION)
FIGURE 42. INDIA COMPOSITE CYLINDER MARKET, 2019-2030 ($MILLION)
FIGURE 43. INDONESIA COMPOSITE CYLINDER MARKET, 2019-2030 ($MILLION)
FIGURE 44. MALAYSIA COMPOSITE CYLINDER MARKET, 2019-2030 ($MILLION)
FIGURE 45. THAILAND COMPOSITE CYLINDER MARKET, 2019-2030 ($MILLION)
FIGURE 46. TAIWAN, REPUBLIC OF CHINA COMPOSITE CYLINDER MARKET, 2019-2030 ($MILLION)
FIGURE 47. VIETNAM COMPOSITE CYLINDER MARKET, 2019-2030 ($MILLION)
FIGURE 48. REST OF ASIA-PACIFIC COMPOSITE CYLINDER MARKET, 2019-2030 ($MILLION)
FIGURE 49. BRAZIL COMPOSITE CYLINDER MARKET, 2019-2030 ($MILLION)
FIGURE 50. UAE COMPOSITE CYLINDER MARKET, 2019-2030 ($MILLION)
FIGURE 51. BAHRAIN COMPOSITE CYLINDER MARKET, 2019-2030 ($MILLION)
FIGURE 52. EGYPT COMPOSITE CYLINDER MARKET, 2019-2030 ($MILLION)
FIGURE 53. SAUDI ARABIA COMPOSITE CYLINDER MARKET, 2019-2030 ($MILLION)
FIGURE 54. REST OF LAMEA COMPOSITE CYLINDER MARKET, 2019-2030 ($MILLION)
FIGURE 55. TOP WINNING STRATEGIES, BY YEAR (2022-2025)
FIGURE 56. TOP WINNING STRATEGIES, BY DEVELOPMENT (2022-2025)
FIGURE 57. TOP WINNING STRATEGIES, BY COMPANY (2022-2025)
FIGURE 58. PRODUCT MAPPING OF TOP 10 PLAYERS
FIGURE 59. COMPETITIVE DASHBOARD
FIGURE 60. COMPETITIVE HEATMAP: COMPOSITE CYLINDER MARKET
FIGURE 61. TOP PLAYER POSITIONING, 2019
FIGURE 62. DRGERWERK AG & CO. KGAA: NET REVENUE, 2022-2024 ($MILLION)
FIGURE 63. DRGERWERK AG & CO. KGAA: REVENUE SHARE BY SEGMENT, 2024 (%)
FIGURE 64. DRGERWERK AG & CO. KGAA: REVENUE SHARE BY REGION, 2024 (%)