Edge Security Market : Global Opportunity Analysis and Industry Forecast, 2025-2034
エッジセキュリティ市場 - コンポーネント(ハードウェア、ソフトウェア、サービス)、企業規模(大企業、中小企業)、エンドユーザー産業(BFSI、製造業、政府・防衛、ヘルスケア、IT・通信、その他)別:機会分析と業界予測、2025年-2034年
Edge Security Market By Component (Hardware, Software, Service), By Enterprise Size (Large Enterprise, SMEs), By End User Industry (BFSI, Manufacturing, Government and Defense, Healthcare, IT and Telecom, Others): Global Opportunity Analysis and Industry Forecast, 2025-2034
| 出版 | Allied Market Research |
| 出版年月 | 2025年06月 |
| ページ数 | 265 |
| 価格 | 記載以外のライセンスについてはお問合せください |
| シングルユーザ | USD 4,335 |
| 種別 | 英文調査報告書 |
| 商品番号 | SMR-12225 |

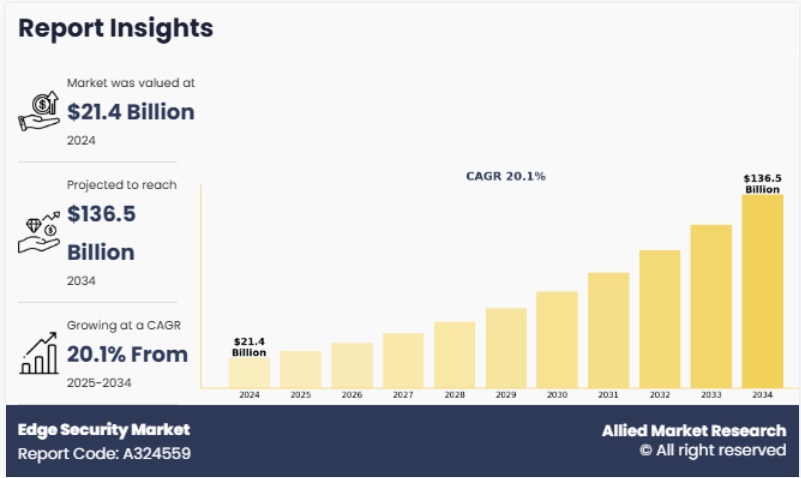
世界のエッジセキュリティ市場は2024年に213億6,000万ドルと評価され、2025年から2034年にかけて20.1%のCAGRで成長し、2034年までに1,364億5,300万ドルに達すると予測されています。
エッジセキュリティとは、ネットワークのエッジ、つまりデータの生成と消費が行われる場所に近い場所にあるデータ、デバイス、アプリケーションを保護するために設計された、一連のサイバーセキュリティソリューションとプラクティスを指します。エッジコンピューティングの急速な成長とモノのインターネット(IoT)デバイスの急増に伴い、エッジセキュリティは分散型ネットワークを保護する上で不可欠な要素として浮上しています。従来の集中型セキュリティモデルとは異なり、エッジセキュリティは分散型インフラストラクチャの保護に重点を置いており、多くの場合リアルタイムで複数のエンドポイントにまたがる脅威の増加に対抗します。このアプローチにより、迅速な脅威検出、低レイテンシ、そしてリモート環境とモバイル環境における保護の強化が実現します。
IoTデバイスの普及拡大、低遅延処理のニーズの高まり、リモートワークの急増といった要因が、エッジセキュリティ市場の成長を大きく牽引しています。さらに、分散型ITインフラへの移行とエッジにおけるリアルタイムデータ処理への依存度の高まりにより、従来のセキュリティモデルでは対応しきれなくなっています。そのため、クラウド、オンプレミス、エッジ環境をシームレスに保護する高度なエッジセキュリティソリューションへの需要が高まっています。さらに、エッジデバイスやシステムを標的としたサイバー攻撃の高度化が加速していることから、企業はエッジに特化したサイバーセキュリティ戦略を優先せざるを得なくなっています。
Report Description
The global edge security market was valued at $21,360.0 million in 2024, and is projected to reach $136,453.0 million by 2034, growing at a CAGR of 20.1% from 2025 to 2034.
Edge security refers to a set of cybersecurity solutions and practices designed to secure data, devices, and applications at the edge of a network—close to where data is generated and consumed. With the exponential growth of edge computing and the proliferation of Internet of Things (IoT) devices, edge security has emerged as a critical component in protecting decentralized networks. Unlike traditional centralized security models, edge security focuses on safeguarding distributed infrastructure, often in real-time, to counter rising threats across multiple endpoints. This approach offers rapid threat detection, lower latency, and improved protection for remote & mobile environments.
Factors such as rise in adoption of IoT devices, increase in need for low-latency processing, and surge in remote work significantly drive the growth of the edge security market. Moreover, shift toward decentralized IT infrastructure and increase in reliance on real-time data processing at the edge have made traditional security models inadequate. This fuels demand for advanced edge security solutions that offer seamless protection across cloud, on-premises, and edge environments. In addition, surge in sophistication of cyberattacks targeting edge devices and systems pushes enterprises to prioritize edge-focused cybersecurity strategies.
However, challenges such as lack of standardized protocols, integration complexities, and high implementation costs hinder market growth. In addition, data fragmentation and limited computing resources at the edge restrict the deployment of complex security solutions. Security gaps due to inconsistent enforcement of policies and inadequate visibility across decentralized networks are further expected to restrain market expansion.
On the other hand, increase in integration of AI and machine learning in edge security platforms is expected to offer significant growth opportunities. These technologies enhance anomaly detection, automate threat response, and improve overall decision-making capabilities. Furthermore, the adoption of zero-trust security models, along with edge-native security frameworks, is expected to accelerate as organizations demand more adaptive and scalable solutions. The expansion of 5G networks and growth of edge data centers present promising opportunities, particularly in industries such as manufacturing, healthcare, and smart cities. In addition, strategic collaborations among cybersecurity providers, telecom operators, and cloud service vendors are projected to unlock new avenues for innovation and market expansion in the coming years. For instance, in 2024, Palo Alto Networks, Inc. formed a strategic collaboration with NVIDIA, Celona, Druid, Ataya, NetScout and NTT Data to offer private 5G security solutions, integrating its enterprise-grade security into emerging 5G edge deployments.
Segment Review
The edge security market is segmented into component, enterprise size, end-user industry, and region. On the basis of component, the market is segregated into hardware, software, and service. By enterprise size, the market is bifurcated into large enterprise and small & medium enterprises (SMEs). As per end-user industry, the market is classified into BFSI, manufacturing, government & defense, healthcare, IT & telecom, and others. Region-wise, it is analyzed across North America, Europe, Asia-Pacific, and LAMEA.
Key Findings
- By component, the software segment held the largest share in the edge security market in 2024.
- By enterprise size, the large enterprise segment held the largest share in the edge security market in 2024.
- By end-user industry, the IT and telecom segment held the largest share in the edge security market in 2024.
Region-wise, North America held the largest market share in 2024. However, Asia-Pacific is expected to witness the highest CAGR during the forecast period.
Competition Analysis
The key players profiled in the edge security market include Palo Alto Networks, Inc., Check Point Software Technologies Ltd., Fortinet, Inc., Juniper Networks, Inc., Zscaler, Inc., Broadcom Inc., Cloudflare, Inc., Forcepoint LLC, F5, Inc., AKAMAI TECHNOLOGIES, INC., Barracuda Networks, Inc.,Versa Networks, Inc., Cato Networks Ltd., Netskope, Inc., Sophos Limited, SonicWall, Inc, Musarubra US LLC, Infoblox Inc., iboss, Inc., and Cisco Systems, Inc.
Key Benefits for Stakeholders
This report provides a quantitative analysis of the market segments, current trends, estimations, and dynamics of the edge security market analysis from 2024 to 2034 to identify the prevailing edge security market opportunities.
The market research is offered along with information related to key drivers, restraints, and opportunities.
Porter’s five forces analysis highlights the potency of buyers and suppliers to enable stakeholders make profit-oriented business decisions and strengthen their supplier-buyer network.
In-depth analysis of the edge security market segmentation assists to determine the prevailing market opportunities.
Major countries in each region are mapped according to their revenue contribution to the global market.
Market player positioning facilitates benchmarking and provides a clear understanding of the present position of the market players.
The report includes the analysis of the regional as well as global edge security market trends, key players, market segments, application areas, and market growth strategies.
Additional benefits you will get with this purchase are:
- Quarterly Update and* (only available with a corporate license, on listed price)
- 5 additional Company Profile of client Choice pre- or Post-purchase, as a free update.
- Free Upcoming Version on the Purchase of Five and Enterprise User License.
- 16 analyst hours of support* (post-purchase, if you find additional data requirements upon review of the report, you may receive support amounting to 16 analyst hours to solve questions, and post-sale queries)
- 15% Free Customization* (in case the scope or segment of the report does not match your requirements, 15% is equivalent to 3 working days of free work, applicable once)
- Free data Pack on the Five and Enterprise User License. (Excel version of the report)
- Free Updated report if the report is 6-12 months old or older.
- 24-hour priority response*
- Free Industry updates and white papers.
Possible Customization with this report (with additional cost and timeline, please talk to the sales executive to know more)
- Investment Opportunities
- Technology Trend Analysis
- Regulatory Guidelines
- Strategic Recommendations
- Additional company profiles with specific to client’s interest
- Additional country or region analysis- market size and forecast
- Criss-cross segment analysis- market size and forecast
- Expanded list for Company Profiles
- Historic market data
- SWOT Analysis
Edge Security Market Report Highlights
| Aspects | Details |
|
Market Size By 2034
|
USD 136.5 billion |
|
Growth Rate
|
CAGR of 20.1% |
|
Forecast period
|
2024 – 2034 |
|
Report Pages
|
265 |
|
By Component
|
|
|
By End User Industry
|
|
|
By Enterprise Size
|
|
|
By Region
|
|
|
Key Market Players
|
Broadcom Inc., Barracuda Networks, Inc., Zscaler, Inc., Cisco Systems, Inc., AKAMAI TECHNOLOGIES, INC., Juniper Networks, Inc., Netskope, Inc., Cloudflare, Inc., Cato Networks Ltd., iboss, Inc., Fortinet, Inc., SonicWall, Inc., F5, Inc., Musarubra US LLC, Sophos Limited, Versa Networks, Inc., Palo Alto Networks, Inc., Infoblox Inc., Check Point Software Technologies Ltd., Forcepoint LLC |
Table of Content
CHAPTER 1: INTRODUCTION
1.1. Report description
1.2. Key market segments
1.3. Key benefits to the stakeholders
1.4. Research methodology
1.4.1. Primary research
1.4.2. Secondary research
1.4.3. Analyst tools and models
CHAPTER 2: EXECUTIVE SUMMARY
2.1. CXO perspective
CHAPTER 3: MARKET OVERVIEW
3.1. Market definition and scope
3.2. Key findings
3.2.1. Top impacting factors
3.2.2. Top investment pockets
3.3. Porter’s five forces analysis
3.3.1. Moderate bargaining power of suppliers
3.3.2. Moderate to high threat of new entrants
3.3.3. Low threat of substitutes
3.3.4. Moderate to high intensity of rivalry
3.3.5. Moderate to high bargaining power of buyers
3.4. Market dynamics
3.4.1. Drivers
3.4.1.1. Increasing adoption of secure access service edge (SASE)
3.4.1.2. Adoption of 5G networks
3.4.1.3. Rise of Remote and Hybrid Environments
3.4.2. Restraints
3.4.2.1. High implementation and maintenance costs
3.4.2.2. Complexity in managing distributed environments
3.4.3. Opportunities
3.4.3.1. AI and ML Integration for threat detection across industries
CHAPTER 4: EDGE SECURITY MARKET, BY COMPONENT
4.1. Overview
4.1.1. Market size and forecast
4.2. Hardware
4.2.1. Key market trends, growth factors and opportunities
4.2.2. Market size and forecast, by region
4.2.3. Market share analysis by country
4.3. Software
4.3.1. Key market trends, growth factors and opportunities
4.3.2. Market size and forecast, by region
4.3.3. Market share analysis by country
4.4. Service
4.4.1. Key market trends, growth factors and opportunities
4.4.2. Market size and forecast, by region
4.4.3. Market share analysis by country
CHAPTER 5: EDGE SECURITY MARKET, BY ENTERPRISE SIZE
5.1. Overview
5.1.1. Market size and forecast
5.2. Large Enterprise
5.2.1. Key market trends, growth factors and opportunities
5.2.2. Market size and forecast, by region
5.2.3. Market share analysis by country
5.3. SMEs
5.3.1. Key market trends, growth factors and opportunities
5.3.2. Market size and forecast, by region
5.3.3. Market share analysis by country
CHAPTER 6: EDGE SECURITY MARKET, BY END USER INDUSTRY
6.1. Overview
6.1.1. Market size and forecast
6.2. BFSI
6.2.1. Key market trends, growth factors and opportunities
6.2.2. Market size and forecast, by region
6.2.3. Market share analysis by country
6.3. Manufacturing
6.3.1. Key market trends, growth factors and opportunities
6.3.2. Market size and forecast, by region
6.3.3. Market share analysis by country
6.4. Government and Defense
6.4.1. Key market trends, growth factors and opportunities
6.4.2. Market size and forecast, by region
6.4.3. Market share analysis by country
6.5. Healthcare
6.5.1. Key market trends, growth factors and opportunities
6.5.2. Market size and forecast, by region
6.5.3. Market share analysis by country
6.6. IT and Telecom
6.6.1. Key market trends, growth factors and opportunities
6.6.2. Market size and forecast, by region
6.6.3. Market share analysis by country
6.7. Others
6.7.1. Key market trends, growth factors and opportunities
6.7.2. Market size and forecast, by region
6.7.3. Market share analysis by country
CHAPTER 7: EDGE SECURITY MARKET, BY REGION
7.1. Overview
7.1.1. Market size and forecast By Region
7.2. North America
7.2.1. Key market trends, growth factors and opportunities
7.2.2. Market size and forecast, by Component
7.2.3. Market size and forecast, by Enterprise Size
7.2.4. Market size and forecast, by End User Industry
7.2.5. Market size and forecast, by country
7.2.5.1. U.S.
7.2.5.1.1. Market size and forecast, by Component
7.2.5.1.2. Market size and forecast, by Enterprise Size
7.2.5.1.3. Market size and forecast, by End User Industry
7.2.5.2. Canada
7.2.5.2.1. Market size and forecast, by Component
7.2.5.2.2. Market size and forecast, by Enterprise Size
7.2.5.2.3. Market size and forecast, by End User Industry
7.3. Europe
7.3.1. Key market trends, growth factors and opportunities
7.3.2. Market size and forecast, by Component
7.3.3. Market size and forecast, by Enterprise Size
7.3.4. Market size and forecast, by End User Industry
7.3.5. Market size and forecast, by country
7.3.5.1. UK
7.3.5.1.1. Market size and forecast, by Component
7.3.5.1.2. Market size and forecast, by Enterprise Size
7.3.5.1.3. Market size and forecast, by End User Industry
7.3.5.2. Germany
7.3.5.2.1. Market size and forecast, by Component
7.3.5.2.2. Market size and forecast, by Enterprise Size
7.3.5.2.3. Market size and forecast, by End User Industry
7.3.5.3. France
7.3.5.3.1. Market size and forecast, by Component
7.3.5.3.2. Market size and forecast, by Enterprise Size
7.3.5.3.3. Market size and forecast, by End User Industry
7.3.5.4. Italy
7.3.5.4.1. Market size and forecast, by Component
7.3.5.4.2. Market size and forecast, by Enterprise Size
7.3.5.4.3. Market size and forecast, by End User Industry
7.3.5.5. Spain
7.3.5.5.1. Market size and forecast, by Component
7.3.5.5.2. Market size and forecast, by Enterprise Size
7.3.5.5.3. Market size and forecast, by End User Industry
7.3.5.6. Rest of Europe
7.3.5.6.1. Market size and forecast, by Component
7.3.5.6.2. Market size and forecast, by Enterprise Size
7.3.5.6.3. Market size and forecast, by End User Industry
7.4. Asia-Pacific
7.4.1. Key market trends, growth factors and opportunities
7.4.2. Market size and forecast, by Component
7.4.3. Market size and forecast, by Enterprise Size
7.4.4. Market size and forecast, by End User Industry
7.4.5. Market size and forecast, by country
7.4.5.1. China
7.4.5.1.1. Market size and forecast, by Component
7.4.5.1.2. Market size and forecast, by Enterprise Size
7.4.5.1.3. Market size and forecast, by End User Industry
7.4.5.2. Japan
7.4.5.2.1. Market size and forecast, by Component
7.4.5.2.2. Market size and forecast, by Enterprise Size
7.4.5.2.3. Market size and forecast, by End User Industry
7.4.5.3. India
7.4.5.3.1. Market size and forecast, by Component
7.4.5.3.2. Market size and forecast, by Enterprise Size
7.4.5.3.3. Market size and forecast, by End User Industry
7.4.5.4. Australia
7.4.5.4.1. Market size and forecast, by Component
7.4.5.4.2. Market size and forecast, by Enterprise Size
7.4.5.4.3. Market size and forecast, by End User Industry
7.4.5.5. South Korea
7.4.5.5.1. Market size and forecast, by Component
7.4.5.5.2. Market size and forecast, by Enterprise Size
7.4.5.5.3. Market size and forecast, by End User Industry
7.4.5.6. Rest of Asia-Pacific
7.4.5.6.1. Market size and forecast, by Component
7.4.5.6.2. Market size and forecast, by Enterprise Size
7.4.5.6.3. Market size and forecast, by End User Industry
7.5. LAMEA
7.5.1. Key market trends, growth factors and opportunities
7.5.2. Market size and forecast, by Component
7.5.3. Market size and forecast, by Enterprise Size
7.5.4. Market size and forecast, by End User Industry
7.5.5. Market size and forecast, by country
7.5.5.1. Latin America
7.5.5.1.1. Market size and forecast, by Component
7.5.5.1.2. Market size and forecast, by Enterprise Size
7.5.5.1.3. Market size and forecast, by End User Industry
7.5.5.2. Middle East
7.5.5.2.1. Market size and forecast, by Component
7.5.5.2.2. Market size and forecast, by Enterprise Size
7.5.5.2.3. Market size and forecast, by End User Industry
7.5.5.3. Africa
7.5.5.3.1. Market size and forecast, by Component
7.5.5.3.2. Market size and forecast, by Enterprise Size
7.5.5.3.3. Market size and forecast, by End User Industry
CHAPTER 8: COMPETITIVE LANDSCAPE
8.1. Introduction
8.2. Top winning strategies
8.3. Product mapping of top 10 player
8.4. Competitive dashboard
8.5. Competitive heatmap
8.6. Top player positioning, 2024
CHAPTER 9: COMPANY PROFILES
9.1. Palo Alto Networks, Inc.
9.1.1. Company overview
9.1.2. Key executives
9.1.3. Company snapshot
9.1.4. Operating business segments
9.1.5. Product portfolio
9.1.6. Business performance
9.1.7. Key strategic moves and developments
9.2. Check Point Software Technologies Ltd.
9.2.1. Company overview
9.2.2. Key executives
9.2.3. Company snapshot
9.2.4. Operating business segments
9.2.5. Product portfolio
9.2.6. Business performance
9.2.7. Key strategic moves and developments
9.3. Fortinet, Inc.
9.3.1. Company overview
9.3.2. Key executives
9.3.3. Company snapshot
9.3.4. Operating business segments
9.3.5. Product portfolio
9.3.6. Business performance
9.3.7. Key strategic moves and developments
9.4. Juniper Networks, Inc.
9.4.1. Company overview
9.4.2. Key executives
9.4.3. Company snapshot
9.4.4. Operating business segments
9.4.5. Product portfolio
9.4.6. Business performance
9.4.7. Key strategic moves and developments
9.5. Zscaler, Inc.
9.5.1. Company overview
9.5.2. Key executives
9.5.3. Company snapshot
9.5.4. Operating business segments
9.5.5. Product portfolio
9.5.6. Business performance
9.5.7. Key strategic moves and developments
9.6. Broadcom Inc.
9.6.1. Company overview
9.6.2. Key executives
9.6.3. Company snapshot
9.6.4. Operating business segments
9.6.5. Product portfolio
9.6.6. Business performance
9.6.7. Key strategic moves and developments
9.7. Cloudflare, Inc.
9.7.1. Company overview
9.7.2. Key executives
9.7.3. Company snapshot
9.7.4. Operating business segments
9.7.5. Product portfolio
9.7.6. Business performance
9.7.7. Key strategic moves and developments
9.8. Forcepoint LLC
9.8.1. Company overview
9.8.2. Key executives
9.8.3. Company snapshot
9.8.4. Operating business segments
9.8.5. Product portfolio
9.8.6. Key strategic moves and developments
9.9. F5, Inc.
9.9.1. Company overview
9.9.2. Key executives
9.9.3. Company snapshot
9.9.4. Operating business segments
9.9.5. Product portfolio
9.9.6. Business performance
9.9.7. Key strategic moves and developments
9.10. AKAMAI TECHNOLOGIES, INC.
9.10.1. Company overview
9.10.2. Key executives
9.10.3. Company snapshot
9.10.4. Operating business segments
9.10.5. Product portfolio
9.10.6. Business performance
9.10.7. Key strategic moves and developments
9.11. Barracuda Networks, Inc.
9.11.1. Company overview
9.11.2. Key executives
9.11.3. Company snapshot
9.11.4. Operating business segments
9.11.5. Product portfolio
9.11.6. Key strategic moves and developments
9.12. Versa Networks, Inc.
9.12.1. Company overview
9.12.2. Key executives
9.12.3. Company snapshot
9.12.4. Operating business segments
9.12.5. Product portfolio
9.12.6. Key strategic moves and developments
9.13. Cato Networks Ltd.
9.13.1. Company overview
9.13.2. Key executives
9.13.3. Company snapshot
9.13.4. Operating business segments
9.13.5. Product portfolio
9.13.6. Key strategic moves and developments
9.14. Netskope, Inc.
9.14.1. Company overview
9.14.2. Key executives
9.14.3. Company snapshot
9.14.4. Operating business segments
9.14.5. Product portfolio
9.14.6. Key strategic moves and developments
9.15. Sophos Limited
9.15.1. Company overview
9.15.2. Key executives
9.15.3. Company snapshot
9.15.4. Operating business segments
9.15.5. Product portfolio
9.15.6. Key strategic moves and developments
9.16. SonicWall, Inc.
9.16.1. Company overview
9.16.2. Key executives
9.16.3. Company snapshot
9.16.4. Operating business segments
9.16.5. Product portfolio
9.16.6. Key strategic moves and developments
9.17. Musarubra US LLC
9.17.1. Company overview
9.17.2. Key executives
9.17.3. Company snapshot
9.17.4. Operating business segments
9.17.5. Product portfolio
9.17.6. Key strategic moves and developments
9.18. Infoblox Inc.
9.18.1. Company overview
9.18.2. Key executives
9.18.3. Company snapshot
9.18.4. Operating business segments
9.18.5. Product portfolio
9.18.6. Key strategic moves and developments
9.19. iboss, Inc.
9.19.1. Company overview
9.19.2. Key executives
9.19.3. Company snapshot
9.19.4. Operating business segments
9.19.5. Product portfolio
9.19.6. Key strategic moves and developments
9.20. Cisco Systems, Inc.
9.20.1. Company overview
9.20.2. Key executives
9.20.3. Company snapshot
9.20.4. Operating business segments
9.20.5. Product portfolio
9.20.6. Business performance
9.20.7. Key strategic moves and developments
LIST OF TABLES
TABLE 01. GLOBAL EDGE SECURITY MARKET, BY COMPONENT, 2024-2034 ($MILLION)
TABLE 02. EDGE SECURITY MARKET FOR HARDWARE, BY REGION, 2024-2034 ($MILLION)
TABLE 03. EDGE SECURITY MARKET FOR SOFTWARE, BY REGION, 2024-2034 ($MILLION)
TABLE 04. EDGE SECURITY MARKET FOR SERVICE, BY REGION, 2024-2034 ($MILLION)
TABLE 05. GLOBAL EDGE SECURITY MARKET, BY ENTERPRISE SIZE, 2024-2034 ($MILLION)
TABLE 06. EDGE SECURITY MARKET FOR LARGE ENTERPRISE, BY REGION, 2024-2034 ($MILLION)
TABLE 07. EDGE SECURITY MARKET FOR SMES, BY REGION, 2024-2034 ($MILLION)
TABLE 08. GLOBAL EDGE SECURITY MARKET, BY END USER INDUSTRY, 2024-2034 ($MILLION)
TABLE 09. EDGE SECURITY MARKET FOR BFSI, BY REGION, 2024-2034 ($MILLION)
TABLE 10. EDGE SECURITY MARKET FOR MANUFACTURING, BY REGION, 2024-2034 ($MILLION)
TABLE 11. EDGE SECURITY MARKET FOR GOVERNMENT AND DEFENSE, BY REGION, 2024-2034 ($MILLION)
TABLE 12. EDGE SECURITY MARKET FOR HEALTHCARE, BY REGION, 2024-2034 ($MILLION)
TABLE 13. EDGE SECURITY MARKET FOR IT AND TELECOM, BY REGION, 2024-2034 ($MILLION)
TABLE 14. EDGE SECURITY MARKET FOR OTHERS, BY REGION, 2024-2034 ($MILLION)
TABLE 15. EDGE SECURITY MARKET, BY REGION, 2024-2034 ($MILLION)
TABLE 16. NORTH AMERICA EDGE SECURITY MARKET, BY COMPONENT, 2024-2034 ($MILLION)
TABLE 17. NORTH AMERICA EDGE SECURITY MARKET, BY ENTERPRISE SIZE, 2024-2034 ($MILLION)
TABLE 18. NORTH AMERICA EDGE SECURITY MARKET, BY END USER INDUSTRY, 2024-2034 ($MILLION)
TABLE 19. NORTH AMERICA EDGE SECURITY MARKET, BY COUNTRY, 2024-2034 ($MILLION)
TABLE 20. U.S. EDGE SECURITY MARKET, BY COMPONENT, 2024-2034 ($MILLION)
TABLE 21. U.S. EDGE SECURITY MARKET, BY ENTERPRISE SIZE, 2024-2034 ($MILLION)
TABLE 22. U.S. EDGE SECURITY MARKET, BY END USER INDUSTRY, 2024-2034 ($MILLION)
TABLE 23. CANADA EDGE SECURITY MARKET, BY COMPONENT, 2024-2034 ($MILLION)
TABLE 24. CANADA EDGE SECURITY MARKET, BY ENTERPRISE SIZE, 2024-2034 ($MILLION)
TABLE 25. CANADA EDGE SECURITY MARKET, BY END USER INDUSTRY, 2024-2034 ($MILLION)
TABLE 26. EUROPE EDGE SECURITY MARKET, BY COMPONENT, 2024-2034 ($MILLION)
TABLE 27. EUROPE EDGE SECURITY MARKET, BY ENTERPRISE SIZE, 2024-2034 ($MILLION)
TABLE 28. EUROPE EDGE SECURITY MARKET, BY END USER INDUSTRY, 2024-2034 ($MILLION)
TABLE 29. EUROPE EDGE SECURITY MARKET, BY COUNTRY, 2024-2034 ($MILLION)
TABLE 30. UK EDGE SECURITY MARKET, BY COMPONENT, 2024-2034 ($MILLION)
TABLE 31. UK EDGE SECURITY MARKET, BY ENTERPRISE SIZE, 2024-2034 ($MILLION)
TABLE 32. UK EDGE SECURITY MARKET, BY END USER INDUSTRY, 2024-2034 ($MILLION)
TABLE 33. GERMANY EDGE SECURITY MARKET, BY COMPONENT, 2024-2034 ($MILLION)
TABLE 34. GERMANY EDGE SECURITY MARKET, BY ENTERPRISE SIZE, 2024-2034 ($MILLION)
TABLE 35. GERMANY EDGE SECURITY MARKET, BY END USER INDUSTRY, 2024-2034 ($MILLION)
TABLE 36. FRANCE EDGE SECURITY MARKET, BY COMPONENT, 2024-2034 ($MILLION)
TABLE 37. FRANCE EDGE SECURITY MARKET, BY ENTERPRISE SIZE, 2024-2034 ($MILLION)
TABLE 38. FRANCE EDGE SECURITY MARKET, BY END USER INDUSTRY, 2024-2034 ($MILLION)
TABLE 39. ITALY EDGE SECURITY MARKET, BY COMPONENT, 2024-2034 ($MILLION)
TABLE 40. ITALY EDGE SECURITY MARKET, BY ENTERPRISE SIZE, 2024-2034 ($MILLION)
TABLE 41. ITALY EDGE SECURITY MARKET, BY END USER INDUSTRY, 2024-2034 ($MILLION)
TABLE 42. SPAIN EDGE SECURITY MARKET, BY COMPONENT, 2024-2034 ($MILLION)
TABLE 43. SPAIN EDGE SECURITY MARKET, BY ENTERPRISE SIZE, 2024-2034 ($MILLION)
TABLE 44. SPAIN EDGE SECURITY MARKET, BY END USER INDUSTRY, 2024-2034 ($MILLION)
TABLE 45. REST OF EUROPE EDGE SECURITY MARKET, BY COMPONENT, 2024-2034 ($MILLION)
TABLE 46. REST OF EUROPE EDGE SECURITY MARKET, BY ENTERPRISE SIZE, 2024-2034 ($MILLION)
TABLE 47. REST OF EUROPE EDGE SECURITY MARKET, BY END USER INDUSTRY, 2024-2034 ($MILLION)
TABLE 48. ASIA-PACIFIC EDGE SECURITY MARKET, BY COMPONENT, 2024-2034 ($MILLION)
TABLE 49. ASIA-PACIFIC EDGE SECURITY MARKET, BY ENTERPRISE SIZE, 2024-2034 ($MILLION)
TABLE 50. ASIA-PACIFIC EDGE SECURITY MARKET, BY END USER INDUSTRY, 2024-2034 ($MILLION)
TABLE 51. ASIA-PACIFIC EDGE SECURITY MARKET, BY COUNTRY, 2024-2034 ($MILLION)
TABLE 52. CHINA EDGE SECURITY MARKET, BY COMPONENT, 2024-2034 ($MILLION)
TABLE 53. CHINA EDGE SECURITY MARKET, BY ENTERPRISE SIZE, 2024-2034 ($MILLION)
TABLE 54. CHINA EDGE SECURITY MARKET, BY END USER INDUSTRY, 2024-2034 ($MILLION)
TABLE 55. JAPAN EDGE SECURITY MARKET, BY COMPONENT, 2024-2034 ($MILLION)
TABLE 56. JAPAN EDGE SECURITY MARKET, BY ENTERPRISE SIZE, 2024-2034 ($MILLION)
TABLE 57. JAPAN EDGE SECURITY MARKET, BY END USER INDUSTRY, 2024-2034 ($MILLION)
TABLE 58. INDIA EDGE SECURITY MARKET, BY COMPONENT, 2024-2034 ($MILLION)
TABLE 59. INDIA EDGE SECURITY MARKET, BY ENTERPRISE SIZE, 2024-2034 ($MILLION)
TABLE 60. INDIA EDGE SECURITY MARKET, BY END USER INDUSTRY, 2024-2034 ($MILLION)
TABLE 61. AUSTRALIA EDGE SECURITY MARKET, BY COMPONENT, 2024-2034 ($MILLION)
TABLE 62. AUSTRALIA EDGE SECURITY MARKET, BY ENTERPRISE SIZE, 2024-2034 ($MILLION)
TABLE 63. AUSTRALIA EDGE SECURITY MARKET, BY END USER INDUSTRY, 2024-2034 ($MILLION)
TABLE 64. SOUTH KOREA EDGE SECURITY MARKET, BY COMPONENT, 2024-2034 ($MILLION)
TABLE 65. SOUTH KOREA EDGE SECURITY MARKET, BY ENTERPRISE SIZE, 2024-2034 ($MILLION)
TABLE 66. SOUTH KOREA EDGE SECURITY MARKET, BY END USER INDUSTRY, 2024-2034 ($MILLION)
TABLE 67. REST OF ASIA-PACIFIC EDGE SECURITY MARKET, BY COMPONENT, 2024-2034 ($MILLION)
TABLE 68. REST OF ASIA-PACIFIC EDGE SECURITY MARKET, BY ENTERPRISE SIZE, 2024-2034 ($MILLION)
TABLE 69. REST OF ASIA-PACIFIC EDGE SECURITY MARKET, BY END USER INDUSTRY, 2024-2034 ($MILLION)
TABLE 70. LAMEA EDGE SECURITY MARKET, BY COMPONENT, 2024-2034 ($MILLION)
TABLE 71. LAMEA EDGE SECURITY MARKET, BY ENTERPRISE SIZE, 2024-2034 ($MILLION)
TABLE 72. LAMEA EDGE SECURITY MARKET, BY END USER INDUSTRY, 2024-2034 ($MILLION)
TABLE 73. LAMEA EDGE SECURITY MARKET, BY COUNTRY, 2024-2034 ($MILLION)
TABLE 74. LATIN AMERICA EDGE SECURITY MARKET, BY COMPONENT, 2024-2034 ($MILLION)
TABLE 75. LATIN AMERICA EDGE SECURITY MARKET, BY ENTERPRISE SIZE, 2024-2034 ($MILLION)
TABLE 76. LATIN AMERICA EDGE SECURITY MARKET, BY END USER INDUSTRY, 2024-2034 ($MILLION)
TABLE 77. MIDDLE EAST EDGE SECURITY MARKET, BY COMPONENT, 2024-2034 ($MILLION)
TABLE 78. MIDDLE EAST EDGE SECURITY MARKET, BY ENTERPRISE SIZE, 2024-2034 ($MILLION)
TABLE 79. MIDDLE EAST EDGE SECURITY MARKET, BY END USER INDUSTRY, 2024-2034 ($MILLION)
TABLE 80. AFRICA EDGE SECURITY MARKET, BY COMPONENT, 2024-2034 ($MILLION)
TABLE 81. AFRICA EDGE SECURITY MARKET, BY ENTERPRISE SIZE, 2024-2034 ($MILLION)
TABLE 82. AFRICA EDGE SECURITY MARKET, BY END USER INDUSTRY, 2024-2034 ($MILLION)
TABLE 83. PALO ALTO NETWORKS, INC.: KEY EXECUTIVES
TABLE 84. PALO ALTO NETWORKS, INC.: COMPANY SNAPSHOT
TABLE 85. PALO ALTO NETWORKS, INC.: PRODUCT SEGMENTS
TABLE 86. PALO ALTO NETWORKS, INC.: SERVICE SEGMENTS
TABLE 87. PALO ALTO NETWORKS, INC.: PRODUCT PORTFOLIO
TABLE 88. PALO ALTO NETWORKS, INC.: KEY STRATERGIES
TABLE 89. CHECK POINT SOFTWARE TECHNOLOGIES LTD.: KEY EXECUTIVES
TABLE 90. CHECK POINT SOFTWARE TECHNOLOGIES LTD.: COMPANY SNAPSHOT
TABLE 91. CHECK POINT SOFTWARE TECHNOLOGIES LTD.: PRODUCT SEGMENTS
TABLE 92. CHECK POINT SOFTWARE TECHNOLOGIES LTD.: SERVICE SEGMENTS
TABLE 93. CHECK POINT SOFTWARE TECHNOLOGIES LTD.: PRODUCT PORTFOLIO
TABLE 94. CHECK POINT SOFTWARE TECHNOLOGIES LTD.: KEY STRATERGIES
TABLE 95. FORTINET, INC.: KEY EXECUTIVES
TABLE 96. FORTINET, INC.: COMPANY SNAPSHOT
TABLE 97. FORTINET, INC.: PRODUCT SEGMENTS
TABLE 98. FORTINET, INC.: SERVICE SEGMENTS
TABLE 99. FORTINET, INC.: PRODUCT PORTFOLIO
TABLE 100. FORTINET, INC.: KEY STRATERGIES
TABLE 101. JUNIPER NETWORKS, INC.: KEY EXECUTIVES
TABLE 102. JUNIPER NETWORKS, INC.: COMPANY SNAPSHOT
TABLE 103. JUNIPER NETWORKS, INC.: PRODUCT SEGMENTS
TABLE 104. JUNIPER NETWORKS, INC.: SERVICE SEGMENTS
TABLE 105. JUNIPER NETWORKS, INC.: PRODUCT PORTFOLIO
TABLE 106. JUNIPER NETWORKS, INC.: KEY STRATERGIES
TABLE 107. ZSCALER, INC.: KEY EXECUTIVES
TABLE 108. ZSCALER, INC.: COMPANY SNAPSHOT
TABLE 109. ZSCALER, INC.: PRODUCT SEGMENTS
TABLE 110. ZSCALER, INC.: SERVICE SEGMENTS
TABLE 111. ZSCALER, INC.: PRODUCT PORTFOLIO
TABLE 112. ZSCALER, INC.: KEY STRATERGIES
TABLE 113. BROADCOM INC.: KEY EXECUTIVES
TABLE 114. BROADCOM INC.: COMPANY SNAPSHOT
TABLE 115. BROADCOM INC.: PRODUCT SEGMENTS
TABLE 116. BROADCOM INC.: SERVICE SEGMENTS
TABLE 117. BROADCOM INC.: PRODUCT PORTFOLIO
TABLE 118. BROADCOM INC.: KEY STRATERGIES
TABLE 119. CLOUDFLARE, INC.: KEY EXECUTIVES
TABLE 120. CLOUDFLARE, INC.: COMPANY SNAPSHOT
TABLE 121. CLOUDFLARE, INC.: PRODUCT SEGMENTS
TABLE 122. CLOUDFLARE, INC.: SERVICE SEGMENTS
TABLE 123. CLOUDFLARE, INC.: PRODUCT PORTFOLIO
TABLE 124. CLOUDFLARE, INC.: KEY STRATERGIES
TABLE 125. FORCEPOINT LLC: KEY EXECUTIVES
TABLE 126. FORCEPOINT LLC: COMPANY SNAPSHOT
TABLE 127. FORCEPOINT LLC: PRODUCT SEGMENTS
TABLE 128. FORCEPOINT LLC: SERVICE SEGMENTS
TABLE 129. FORCEPOINT LLC: PRODUCT PORTFOLIO
TABLE 130. FORCEPOINT LLC: KEY STRATERGIES
TABLE 131. F5, INC.: KEY EXECUTIVES
TABLE 132. F5, INC.: COMPANY SNAPSHOT
TABLE 133. F5, INC.: PRODUCT SEGMENTS
TABLE 134. F5, INC.: SERVICE SEGMENTS
TABLE 135. F5, INC.: PRODUCT PORTFOLIO
TABLE 136. F5, INC.: KEY STRATERGIES
TABLE 137. AKAMAI TECHNOLOGIES, INC.: KEY EXECUTIVES
TABLE 138. AKAMAI TECHNOLOGIES, INC.: COMPANY SNAPSHOT
TABLE 139. AKAMAI TECHNOLOGIES, INC.: PRODUCT SEGMENTS
TABLE 140. AKAMAI TECHNOLOGIES, INC.: PRODUCT PORTFOLIO
TABLE 141. AKAMAI TECHNOLOGIES, INC.: KEY STRATERGIES
TABLE 142. BARRACUDA NETWORKS, INC.: KEY EXECUTIVES
TABLE 143. BARRACUDA NETWORKS, INC.: COMPANY SNAPSHOT
TABLE 144. BARRACUDA NETWORKS, INC.: PRODUCT SEGMENTS
TABLE 145. BARRACUDA NETWORKS, INC.: SERVICE SEGMENTS
TABLE 146. BARRACUDA NETWORKS, INC.: PRODUCT PORTFOLIO
TABLE 147. BARRACUDA NETWORKS, INC.: KEY STRATERGIES
TABLE 148. VERSA NETWORKS, INC.: KEY EXECUTIVES
TABLE 149. VERSA NETWORKS, INC.: COMPANY SNAPSHOT
TABLE 150. VERSA NETWORKS, INC.: PRODUCT SEGMENTS
TABLE 151. VERSA NETWORKS, INC.: SERVICE SEGMENTS
TABLE 152. VERSA NETWORKS, INC.: PRODUCT PORTFOLIO
TABLE 153. VERSA NETWORKS, INC.: KEY STRATERGIES
TABLE 154. CATO NETWORKS LTD.: KEY EXECUTIVES
TABLE 155. CATO NETWORKS LTD.: COMPANY SNAPSHOT
TABLE 156. CATO NETWORKS LTD.: PRODUCT SEGMENTS
TABLE 157. CATO NETWORKS LTD.: PRODUCT PORTFOLIO
TABLE 158. CATO NETWORKS LTD.: KEY STRATERGIES
TABLE 159. NETSKOPE, INC.: KEY EXECUTIVES
TABLE 160. NETSKOPE, INC.: COMPANY SNAPSHOT
TABLE 161. NETSKOPE, INC.: PRODUCT SEGMENTS
TABLE 162. NETSKOPE, INC.: SERVICE SEGMENTS
TABLE 163. NETSKOPE, INC.: PRODUCT PORTFOLIO
TABLE 164. NETSKOPE, INC.: KEY STRATERGIES
TABLE 165. SOPHOS LIMITED: KEY EXECUTIVES
TABLE 166. SOPHOS LIMITED: COMPANY SNAPSHOT
TABLE 167. SOPHOS LIMITED: PRODUCT SEGMENTS
TABLE 168. SOPHOS LIMITED: PRODUCT PORTFOLIO
TABLE 169. SOPHOS LIMITED: KEY STRATERGIES
TABLE 170. SONICWALL, INC.: KEY EXECUTIVES
TABLE 171. SONICWALL, INC.: COMPANY SNAPSHOT
TABLE 172. SONICWALL, INC.: PRODUCT SEGMENTS
TABLE 173. SONICWALL, INC.: PRODUCT PORTFOLIO
TABLE 174. SONICWALL, INC.: KEY STRATERGIES
TABLE 175. MUSARUBRA US LLC: KEY EXECUTIVES
TABLE 176. MUSARUBRA US LLC: COMPANY SNAPSHOT
TABLE 177. MUSARUBRA US LLC: PRODUCT SEGMENTS
TABLE 178. MUSARUBRA US LLC: PRODUCT PORTFOLIO
TABLE 179. MUSARUBRA US LLC: KEY STRATERGIES
TABLE 180. INFOBLOX INC.: KEY EXECUTIVES
TABLE 181. INFOBLOX INC.: COMPANY SNAPSHOT
TABLE 182. INFOBLOX INC.: PRODUCT SEGMENTS
TABLE 183. INFOBLOX INC.: PRODUCT PORTFOLIO
TABLE 184. INFOBLOX INC.: KEY STRATERGIES
TABLE 185. IBOSS, INC.: KEY EXECUTIVES
TABLE 186. IBOSS, INC.: COMPANY SNAPSHOT
TABLE 187. IBOSS, INC.: PRODUCT SEGMENTS
TABLE 188. IBOSS, INC.: PRODUCT PORTFOLIO
TABLE 189. IBOSS, INC.: KEY STRATERGIES
TABLE 190. CISCO SYSTEMS, INC.: KEY EXECUTIVES
TABLE 191. CISCO SYSTEMS, INC.: COMPANY SNAPSHOT
TABLE 192. CISCO SYSTEMS, INC.: PRODUCT SEGMENTS
TABLE 193. CISCO SYSTEMS, INC.: SERVICE SEGMENTS
TABLE 194. CISCO SYSTEMS, INC.: PRODUCT PORTFOLIO
TABLE 195. CISCO SYSTEMS, INC.: KEY STRATERGIES
LIST OF FIGURES
FIGURE 01. EDGE SECURITY MARKET, 2024-2034
FIGURE 02. SEGMENTATION OF EDGE SECURITY MARKET,2024-2034
FIGURE 03. TOP IMPACTING FACTORS IN EDGE SECURITY MARKET (2024 TO 2034)
FIGURE 04. TOP INVESTMENT POCKETS IN EDGE SECURITY MARKET (2025-2034)
FIGURE 05. MODERATE BARGAINING POWER OF SUPPLIERS
FIGURE 06. MODERATE TO HIGH THREAT OF NEW ENTRANTS
FIGURE 07. LOW THREAT OF SUBSTITUTES
FIGURE 08. MODERATE TO HIGH INTENSITY OF RIVALRY
FIGURE 09. MODERATE TO HIGH BARGAINING POWER OF BUYERS
FIGURE 10. GLOBAL EDGE SECURITY MARKET:DRIVERS, RESTRAINTS AND OPPORTUNITIES
FIGURE 11. EDGE SECURITY MARKET, BY COMPONENT, 2024 AND 2034(%)
FIGURE 12. COMPARATIVE SHARE ANALYSIS OF EDGE SECURITY MARKET FOR HARDWARE, BY COUNTRY 2024 AND 2034(%)
FIGURE 13. COMPARATIVE SHARE ANALYSIS OF EDGE SECURITY MARKET FOR SOFTWARE, BY COUNTRY 2024 AND 2034(%)
FIGURE 14. COMPARATIVE SHARE ANALYSIS OF EDGE SECURITY MARKET FOR SERVICE, BY COUNTRY 2024 AND 2034(%)
FIGURE 15. EDGE SECURITY MARKET, BY ENTERPRISE SIZE, 2024 AND 2034(%)
FIGURE 16. COMPARATIVE SHARE ANALYSIS OF EDGE SECURITY MARKET FOR LARGE ENTERPRISE, BY COUNTRY 2024 AND 2034(%)
FIGURE 17. COMPARATIVE SHARE ANALYSIS OF EDGE SECURITY MARKET FOR SMES, BY COUNTRY 2024 AND 2034(%)
FIGURE 18. EDGE SECURITY MARKET, BY END USER INDUSTRY, 2024 AND 2034(%)
FIGURE 19. COMPARATIVE SHARE ANALYSIS OF EDGE SECURITY MARKET FOR BFSI, BY COUNTRY 2024 AND 2034(%)
FIGURE 20. COMPARATIVE SHARE ANALYSIS OF EDGE SECURITY MARKET FOR MANUFACTURING, BY COUNTRY 2024 AND 2034(%)
FIGURE 21. COMPARATIVE SHARE ANALYSIS OF EDGE SECURITY MARKET FOR GOVERNMENT AND DEFENSE, BY COUNTRY 2024 AND 2034(%)
FIGURE 22. COMPARATIVE SHARE ANALYSIS OF EDGE SECURITY MARKET FOR HEALTHCARE, BY COUNTRY 2024 AND 2034(%)
FIGURE 23. COMPARATIVE SHARE ANALYSIS OF EDGE SECURITY MARKET FOR IT AND TELECOM, BY COUNTRY 2024 AND 2034(%)
FIGURE 24. COMPARATIVE SHARE ANALYSIS OF EDGE SECURITY MARKET FOR OTHERS, BY COUNTRY 2024 AND 2034(%)
FIGURE 25. EDGE SECURITY MARKET BY REGION, 2024 AND 2034(%)
FIGURE 26. U.S. EDGE SECURITY MARKET, 2024-2034 ($MILLION)
FIGURE 27. CANADA EDGE SECURITY MARKET, 2024-2034 ($MILLION)
FIGURE 28. UK EDGE SECURITY MARKET, 2024-2034 ($MILLION)
FIGURE 29. GERMANY EDGE SECURITY MARKET, 2024-2034 ($MILLION)
FIGURE 30. FRANCE EDGE SECURITY MARKET, 2024-2034 ($MILLION)
FIGURE 31. ITALY EDGE SECURITY MARKET, 2024-2034 ($MILLION)
FIGURE 32. SPAIN EDGE SECURITY MARKET, 2024-2034 ($MILLION)
FIGURE 33. REST OF EUROPE EDGE SECURITY MARKET, 2024-2034 ($MILLION)
FIGURE 34. CHINA EDGE SECURITY MARKET, 2024-2034 ($MILLION)
FIGURE 35. JAPAN EDGE SECURITY MARKET, 2024-2034 ($MILLION)
FIGURE 36. INDIA EDGE SECURITY MARKET, 2024-2034 ($MILLION)
FIGURE 37. AUSTRALIA EDGE SECURITY MARKET, 2024-2034 ($MILLION)
FIGURE 38. SOUTH KOREA EDGE SECURITY MARKET, 2024-2034 ($MILLION)
FIGURE 39. REST OF ASIA-PACIFIC EDGE SECURITY MARKET, 2024-2034 ($MILLION)
FIGURE 40. LATIN AMERICA EDGE SECURITY MARKET, 2024-2034 ($MILLION)
FIGURE 41. MIDDLE EAST EDGE SECURITY MARKET, 2024-2034 ($MILLION)
FIGURE 42. AFRICA EDGE SECURITY MARKET, 2024-2034 ($MILLION)
FIGURE 43. TOP WINNING STRATEGIES, BY YEAR (2023-2025)
FIGURE 44. TOP WINNING STRATEGIES, BY DEVELOPMENT (2023-2025)
FIGURE 45. TOP WINNING STRATEGIES, BY COMPANY (2023-2025)
FIGURE 46. PRODUCT MAPPING OF TOP 10 PLAYERS
FIGURE 47. COMPETITIVE DASHBOARD
FIGURE 48. COMPETITIVE HEATMAP: EDGE SECURITY MARKET
FIGURE 49. TOP PLAYER POSITIONING, 2024
FIGURE 50. PALO ALTO NETWORKS, INC.: NET REVENUE, 2022-2024 ($MILLION)
FIGURE 51. PALO ALTO NETWORKS, INC.: RESEARCH & DEVELOPMENT EXPENDITURE, 2022-2024 ($MILLION)
FIGURE 52. PALO ALTO NETWORKS, INC.: REVENUE SHARE BY REGION, 2024 (%)
FIGURE 53. CHECK POINT SOFTWARE TECHNOLOGIES LTD.: NET REVENUE, 2022-2024 ($MILLION)
FIGURE 54. CHECK POINT SOFTWARE TECHNOLOGIES LTD.: RESEARCH & DEVELOPMENT EXPENDITURE, 2022-2024 ($MILLION)
FIGURE 55. CHECK POINT SOFTWARE TECHNOLOGIES LTD.: REVENUE SHARE BY REGION, 2024 (%)
FIGURE 56. FORTINET, INC.: NET REVENUE, 2022-2024 ($MILLION)
FIGURE 57. FORTINET, INC.: RESEARCH & DEVELOPMENT EXPENDITURE, 2022-2024 ($MILLION)
FIGURE 58. FORTINET, INC.: REVENUE SHARE BY REGION, 2024 (%)
FIGURE 59. FORTINET, INC.: REVENUE SHARE BY SEGMENT, 2024 (%)
FIGURE 60. JUNIPER NETWORKS, INC.: NET REVENUE, 2022-2024 ($MILLION)
FIGURE 61. JUNIPER NETWORKS, INC.: RESEARCH & DEVELOPMENT EXPENDITURE, 2022-2024 ($MILLION)
FIGURE 62. JUNIPER NETWORKS, INC.: REVENUE SHARE BY REGION, 2024 (%)
FIGURE 63. ZSCALER, INC.: NET REVENUE, 2022-2024 ($MILLION)
FIGURE 64. ZSCALER, INC.: RESEARCH & DEVELOPMENT EXPENDITURE, 2022-2024 ($MILLION)
FIGURE 65. BROADCOM INC.: NET REVENUE, 2022-2024 ($MILLION)
FIGURE 66. BROADCOM INC.: RESEARCH & DEVELOPMENT EXPENDITURE, 2022-2024 ($MILLION)
FIGURE 67. BROADCOM INC.: REVENUE SHARE BY REGION, 2024 (%)
FIGURE 68. BROADCOM INC.: REVENUE SHARE BY SEGMENT, 2024 (%)
FIGURE 69. CLOUDFLARE, INC.: NET REVENUE, 2022-2024 ($MILLION)
FIGURE 70. CLOUDFLARE, INC.: RESEARCH & DEVELOPMENT EXPENDITURE, 2022-2024 ($MILLION)
FIGURE 71. F5, INC.: NET REVENUE, 2022-2024 ($MILLION)
FIGURE 72. F5, INC.: RESEARCH & DEVELOPMENT EXPENDITURE, 2022-2024 ($MILLION)
FIGURE 73. F5, INC.: REVENUE SHARE BY SEGMENT, 2024 (%)
FIGURE 74. F5, INC.: REVENUE SHARE BY REGION, 2024 (%)
FIGURE 75. AKAMAI TECHNOLOGIES, INC.: NET REVENUE, 2022-2024 ($MILLION)
FIGURE 76. AKAMAI TECHNOLOGIES, INC.: RESEARCH & DEVELOPMENT EXPENDITURE, 2022-2024 ($MILLION)
FIGURE 77. CISCO SYSTEMS, INC.: NET REVENUE, 2021-2023 ($MILLION)
FIGURE 78. CISCO SYSTEMS, INC.: RESEARCH & DEVELOPMENT EXPENDITURE, 2021-2023 ($MILLION)
FIGURE 79. CISCO SYSTEMS, INC.: REVENUE SHARE BY SEGMENT, 2023 (%)
FIGURE 80. CISCO SYSTEMS, INC.: REVENUE SHARE BY SEGMENT, 2023 (%)