Dark Fiber Network Market Size, Share & Trends Analysis Report
ダークファイバーネットワーク市場 - 光ファイバー(シングルモード、マルチモード)、ネットワーク別(メトロ、長距離)、材質別(ガラス、プラスチック)、用途別(通信、石油・ガス、BFSI、医療)、地域、セグメント別予測による市場規模、成長と動向分析レポート 2026-2033年
Dark Fiber Network Market Size, Share & Trends Analysis Report By Fiber (Single Mode, Multi-mode), By Network (Metro, Long-haul), By Material (Glass, Plastic), By Application (Telecom, Oil & Gas, BFSI, Medical), By Region, And Segment Forecasts, 2026 - 2033
| 出版 | Grand View Research |
| 出版年月 | 2025年12月 |
| ページ数 | 130 |
| 価格 | 記載以外のライセンスについてはお問合せください |
| シングルユーザ | USD 4,950 |
| 種別 | 英文調査報告書 |
| 商品番号 | SMR-12052 |

世界のダークファイバーネットワーク市場規模は、2025年に69億米ドルに達し、2033年には218億8000万米ドルに達すると予測されており、2026年から2033年にかけて年平均成長率(CAGR)15.9%で成長します。この技術は、通信とネットワーク管理の強化に注力するさまざまな組織にとって、持続可能なソリューションとして登場しています。
インターネットサービスの普及率はこの期間を通じて継続的に増加しており、インターネット帯域幅に対する需要の高まりにつながっています。この需要は予測期間中も引き続き旺盛に推移すると予想されます。これは、世界的な市場成長を牽引する最も重要な要因です。市場は、インターネット接続への依存度が高い企業によって強く支えられています。これらのネットワークは、業務において大量のデータフローを扱う組織にとって非常に有益です。これらのメリットには、ネットワーク遅延の低減、拡張性、信頼性、セキュリティ強化などが含まれます。
光ファイバー通信において、プロバイダーや通信事業者によってまだサービス提供されていない光ファイバーケーブルは、ダークファイバーまたはアンライトファイバー(ファイバーと呼ばれることもあります)と呼ばれます。これらのケーブルは光機器に接続されておらず、将来のある時点で使用するために敷設されます。これは、顧客またはサービスプロバイダーが所有する新規光ファイバー建設プロジェクトとも呼ばれます。現在の市場状況では、ネットワークサービスプロバイダーはこれらの未使用光ファイバーケーブルをリースしています。
このレポートは、世界、地域、国レベルでの収益成長を予測し、2021年から2033年までの各サブセグメントにおける最新の業界動向の分析を提供します。この調査のために、Grand View Researchは、ファイバー、ネットワーク、材料、アプリケーション、および地域に基づいて、世界のダークファイバーネットワーク市場をセグメント化しました。
Dark Fiber Network Market Summary
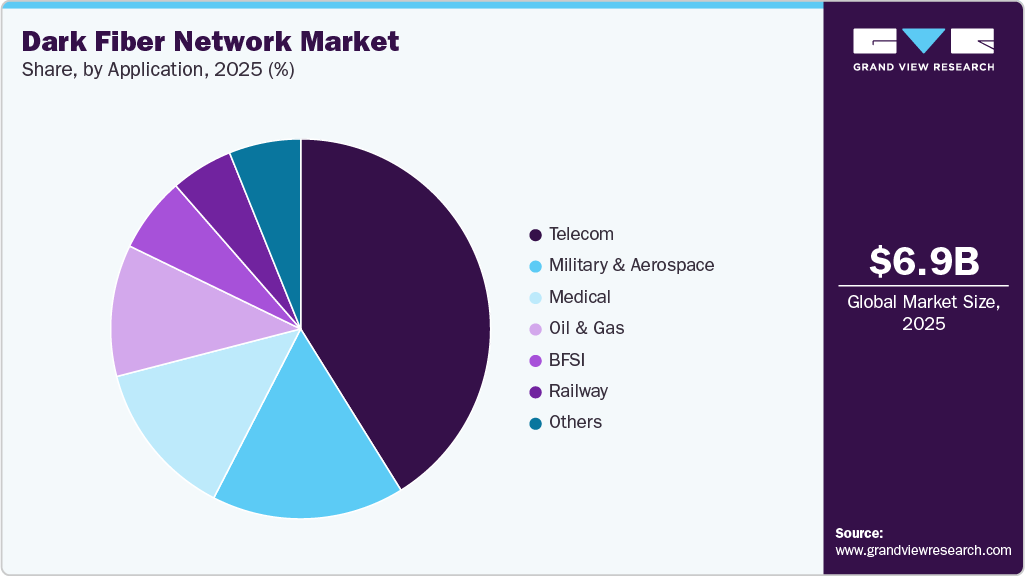
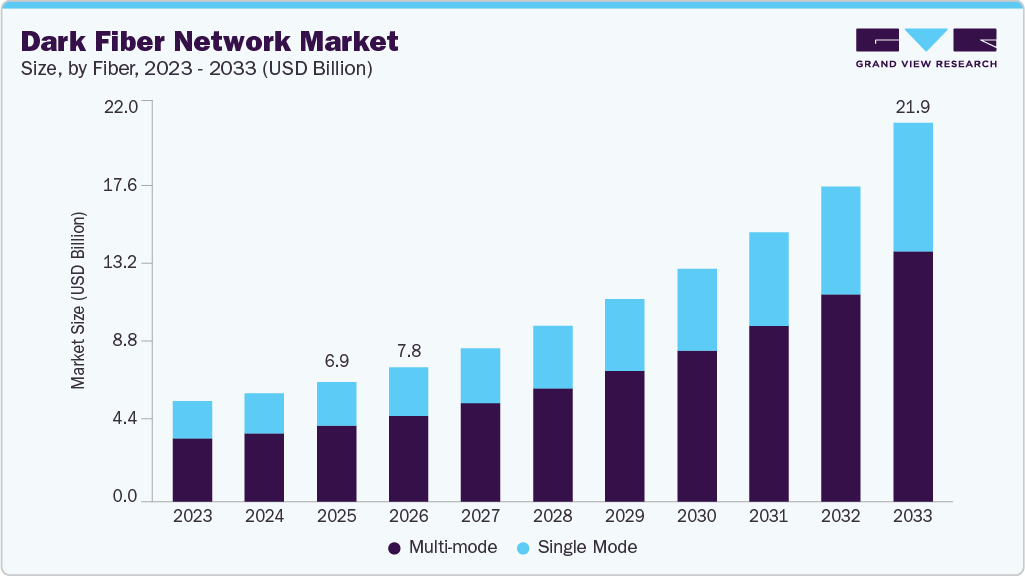
The global dark fiber network market size accounted for USD 6.90 billion in 2025 and is projected to reach USD 21.88 billion by 2033, growing at a CAGR of 15.9% from 2026 to 2033. Technology has emerged as a sustainable solution for various organizations that are focusing on enhanced communication and network management.
dark-fiber-network-market-size
Continuously increasing penetration of internet services over the period has paved the way for the high demand for internet bandwidth. This demand is expected to remain rampant over the forecast period. This is the most significant factor responsible for market growth across the globe. The market is strongly supported by companies with a high reliance on internet connectivity. These networks are highly beneficial for organizations with a high volume of data flow in their operation. These benefits include reduced network latency, scalability, reliability, and enhanced security.
In fiber optic communications, fiber optic cables that are not yet put in service by a provider or carrier are termed dark fiber or unlit fiber (sometimes known as fiber). These cables are not connected to any optical device and are installed to be used at some point in the future. It is also called a new fiber construction project to be owned by a customer or service provider. In the current market scenario, network service providers are leasing these unused fiber optic cables.
During the late 90s, the telecommunications industry was booming, and huge capital were poured into building these fiber-optic networks. That period saw the aggressive laying down of fiber networks along with highways and rail lines (i.e., long-haul network). Similarly, a thousand miles of local or regional network (metro network) were laid across large cities and population centers. At the turn of the century, the telecom sector witnessed a meltdown, and these billion-dollar unused fiber network (dark fiber) infrastructures were sold at a meager price by telecom providers to avoid bankruptcy.
Due to the increasing demand for mobile data and the launch of 5G services, telecom service providers are now buying up the available dark fiber and also focusing on building their own. Other factors, such as the ever-increasing bandwidth demand of handheld device user audience and mandatory conversion to HD video quality for cable operators, are expected to fuel the market growth over the forecast period.
The pricing for dark fiber in the U.S. is based on the routes and locations, and is sometimes plainly arbitrary. Also, it relies on several other parameters, such as market competition, market demand, and construction costs in a particular location. Generally, the U.S. dark fiber network pricing has been bifurcated into two major parts, including metro-area and long-haul area fiber.
The dark fiber prices in the metro area are considerably higher than in the long-haul area on a per-mile basis. More urban areas’ routes have considerably higher pricing in the metro area than the suburban and exurban areas’ routes. This is due to the rising demand for a fiber network in urban areas. Occasionally, owing to the glut of fiber, the prices of dark fiber networks push down in the urban areas. Moreover, it has been observed that the dark fiber prices in the long-haul areas are more consistent than the metro-area routes.
Dark Fiber Network Market Report Scope
| Report Attribute | Details |
| Market size value in 2026 | USD 7.77 billion |
| Revenue forecast in 2033 | USD 21.88 billion |
| Growth rate | CAGR of 15.9% from 2026 to 2033 |
| Base Year | 2025 |
| Actual Data | 2021 – 2025 |
| Forecast period | 2026 – 2033 |
| Quantitative units | Revenue in USD million/billion and CAGR from 2026 to 2033 |
| Report coverage | Revenue forecast, company market share, competitive landscape, growth factors, and trends |
| Segments covered | Fiber, network, material, application, region |
| Regional scope | North America; Europe; Asia Pacific; South America; Middle East & Africa |
| Country scope | U.S.; Canada; Mexico; UK; Germany; France; China; India; Japan; South Korea; Australia; Brazil; KSA; UAE; South Africa |
| Key companies profiled | AT&T Inc.; Colt Technology Services Group Limited; Comcast; Consolidated Communications; GTT Communications, Inc.; Lumen Technologies, Inc.; Verizon Communications, Inc.; Windstream Intellectual Property Services, LLC; Zayo Group, LLC, Microscan |
| Customization scope | Free report customization (equivalent up to 8 analysts working days) with purchase. Addition or alteration to country, regional & segment scope. |
Global Dark Fiber Network Market Report Segmentation
This report forecasts revenue growth at the global, regional, and country levels and provides an analysis of the latest industry trends in each of the sub-segments from 2021 to 2033. For this study, Grand View Research has segmented the global dark fiber network market based on fiber, network, material, application, and region:
• Fiber Outlook (Revenue, USD Million, 2021 – 2033)
• Single Mode
• Multi-mode
• Step-index Multimode Fiber
• Graded-index Multimode Fiber
• Network Outlook (Revenue, USD Million, 2021 – 2033)
• Metro
• Long-haul
• Material Outlook (Revenue, USD Million, 2021 – 2033)
• Glass
• Plastic
• Application Outlook (Revenue, USD Million, 2021 – 2033)
• Telecom
• Oil & Gas
• Military & Aerospace
• BFSI
• Medical
• Railway
• Others
• Regional Outlook (Revenue, USD Million, 2021 – 2033)
• North America
o U.S.
o Canada
o Mexico
• Europe
o UK
o Germany
o France
• Asia Pacific
o China
o India
o Japan
o South Korea
o Australia
• South America
o Brazil
• Middle East & Africa (MEA)
o KSA
o UAE
o South Africa
Table of Contents
Chapter 1. Methodology and Scope
1.1. Market Segmentation and Scope
1.2. Research Methodology
1.2.1. Information Procurement
1.3. Information or Data Analysis
1.4. Methodology
1.5. Research Scope and Assumptions
1.6. Market Formulation & Validation
1.7. List of Data Sources
Chapter 2. Executive Summary
2.1. Market Outlook
2.2. Segment Outlook
2.3. Competitive Insights
Chapter 3. Dark Fiber Network Market Variables, Trends, & Scope
3.1. Market Lineage Outlook
3.2. Market Dynamics
3.2.1. Market Driver Analysis
3.2.2. Market Restraint Analysis
3.2.3. Industry Challenge
3.3. Dark Fiber Network Market Analysis Tools
3.3.1. Industry Analysis – Porter’s
3.3.1.1. Bargaining power of the suppliers
3.3.1.2. Bargaining power of the buyers
3.3.1.3. Threats of substitution
3.3.1.4. Threats from new entrants
3.3.1.5. Competitive rivalry
3.3.2. PESTEL Analysis
3.3.2.1. Political landscape
3.3.2.2. Economic and social landscape
3.3.2.3. Technological landscape
3.4. Pain Point Analysis
Chapter 4. Dark Fiber Network Market Pricing Analysis
4.1. Dark Fiber Lease Price Analysis
4.1.1. U.S.
4.1.2. Brazil
4.1.3. Australia
4.1.4. Spain
4.1.5. Germany
4.2. Assumption and Derivation of Pricing Range Estimations
Chapter 5. Dark Fiber Network Market: Fiber Estimates & Trend Analysis
5.1. Segment Dashboard
5.2. Dark Fiber Network Market: Fiber Movement Analysis, USD Million, 2025 & 2033
5.3. Single Mode
5.3.1. Single Mode Market Revenue Estimates and Forecasts, 2021 – 2033 (USD Million)
5.4. Multi-mode
5.4.1. Multi-mode Market Revenue Estimates and Forecasts, 2021 – 2033 (USD Million)
5.4.2. Step-index Multimode Fiber
5.4.2.1. Dark fiber network by step-index multimode fiber, 2021 – 2033
5.4.3. Graded-index Multimode Fiber
5.4.3.1. Dark fiber network by graded-index multimode fiber, 2021 – 2033
Chapter 6. Dark Fiber Network Market: Network Estimates & Trend Analysis
6.1. Segment Dashboard
6.2. Dark Fiber Network Market: Network Movement Analysis, USD Million, 2025 & 2033
6.3. Metro
6.3.1. Metro Market Revenue Estimates and Forecasts, 2021 – 2033 (USD Million)
6.4. Long-haul
6.4.1. Long-haul Market Revenue Estimates and Forecasts, 2021 – 2033 (USD Million)
Chapter 7. Dark Fiber Network Market: Material Estimates & Trend Analysis
7.1. Segment Dashboard
7.2. Dark Fiber Network Market: Material Movement Analysis, USD Million, 2025 & 2033
7.3. Glass
7.3.1. Glass Market Revenue Estimates and Forecasts, 2021 – 2033 (USD Million)
7.4. Plastic
7.4.1. Plastic Market Revenue Estimates and Forecasts, 2021 – 2033 (USD Million)
Chapter 8. Dark Fiber Network Market: Application Estimates & Trend Analysis
8.1. Segment Dashboard
8.2. Dark Fiber Network Market: Application Movement Analysis, USD Million, 2025 & 2033
8.3. Telecom
8.3.1. Telecom Market Revenue Estimates and Forecasts, 2021 – 2033 (USD Million)
8.4. Oil & Gas
8.4.1. Oil & Gas Revenue Estimates and Forecasts, 2021 – 2033 (USD Million)
8.5. Military & Aerospace
8.5.1. Military & Aerospace Revenue Estimates and Forecasts, 2021 – 2033 (USD Million)
8.6. BFSI
8.6.1. BFSI Revenue Estimates and Forecasts, 2021 – 2033 (USD Million)
8.7. Medical
8.7.1. Medical Revenue Estimates and Forecasts, 2021 – 2033 (USD Million)
8.8. Railway
8.8.1. Railway Revenue Estimates and Forecasts, 2021 – 2033 (USD Million)
8.9. Others
8.9.1. Others Revenue Estimates and Forecasts, 2021 – 2033 (USD Million)
Chapter 9. Dark Fiber Network Market: Regional Estimates & Trend Analysis
9.1. Dark Fiber Network Market Share, By Region, 2025 & 2033, USD Million
9.2. North America
9.2.1. North America Dark Fiber Network Market Estimates and Forecasts, 2021 – 2033 (USD Million)
9.2.2. U.S.
9.2.2.1. U.S. Dark Fiber Network Market Estimates and Forecasts, 2021 – 2033 (USD Million)
9.2.3. Canada
9.2.3.1. Canada Dark Fiber Network Market Estimates and Forecasts, 2021 – 2033 (USD Million)
9.2.4. Mexico
9.2.4.1. Mexico Dark Fiber Network Market Estimates and Forecasts, 2021 – 2033 (USD Million)
9.3. Europe
9.3.1. Europe Dark Fiber Network Market Estimates and Forecasts, 2021 – 2033 (USD Million)
9.3.2. UK
9.3.2.1. UK Dark Fiber Network Market Estimates and Forecasts, 2021 – 2033 (USD Million)
9.3.3. Germany
9.3.3.1. Germany Dark Fiber Network Market Estimates and Forecasts, 2021 – 2033 (USD MILLION)
9.3.4. France
9.3.4.1. France Dark Fiber Network Market Estimates and Forecasts, 2021 – 2033 (USD Million)
9.4. Asia Pacific
9.4.1. Asia Pacific Dark Fiber Network Market Estimates and Forecasts, 2021 – 2033 (USD Million)
9.4.2. China
9.4.2.1. China Dark Fiber Network Market Estimates and Forecasts, 2021 – 2033 (USD Million)
9.4.3. Japan
9.4.3.1. Japan Dark Fiber Network Market Estimates and Forecasts, 2021 – 2033 (USD Million)
9.4.4. India
9.4.4.1. India Dark Fiber Network Market Estimates and Forecasts, 2021 – 2033 (USD Million)
9.4.5. South Korea
9.4.5.1. South Korea Dark Fiber Network Market Estimates and Forecasts, 2021 – 2033 (USD Million)
9.4.6. Australia
9.4.6.1. Australia Dark Fiber Network Market Estimates and Forecasts, 2021 – 2033 (USD Million)
9.5. Latin America
9.5.1. Latin America Dark Fiber Network Market Estimates and Forecasts, 2021 – 2033 (USD Million)
9.5.2. Brazil
9.5.2.1. Brazil Dark Fiber Network Market Estimates and Forecasts, 2021 – 2033 (USD Million)
9.6. Middle East and Africa
9.6.1. Middle East and Africa Dark Fiber Network Market Estimates and Forecasts, 2021 – 2033 (USD Million)
9.6.2. UAE
9.6.2.1. UAE Dark Fiber Network Market Estimates and Forecasts, 2021 – 2033 (USD Million)
9.6.3. KSA
9.6.3.1. KSA Dark Fiber Network Market Estimates and Forecasts, 2021 – 2033 (USD Million)
9.6.4. South Africa
9.6.4.1. South Africa Dark Fiber Network Market Estimates and Forecasts, 2021 – 2033 (USD Million)
Chapter 10. Competitive Landscape
10.1. Company Categorization
10.2. Company Market Positioning
10.3. Company Heat Map Analysis
10.4. Company Profiles/Listing
10.4.1. AT&T Intellectual
10.4.1.1. Participant’s Overview
10.4.1.2. Financial Performance
10.4.1.3. Product Benchmarking
10.4.1.4. Strategic Initiatives
10.4.2. Colt Technology Services Group Limited
10.4.2.1. Participant’s Overview
10.4.2.2. Financial Performance
10.4.2.3. Product Benchmarking
10.4.2.4. Strategic Initiatives
10.4.3. Comcast Corporation
10.4.3.1. Participant’s Overview
10.4.3.2. Financial Performance
10.4.3.3. Product Benchmarking
10.4.3.4. Strategic Initiatives
10.4.4. Consolidated Communications
10.4.4.1. Participant’s Overview
10.4.4.2. Financial Performance
10.4.4.3. Product Benchmarking
10.4.4.4. Strategic Initiatives
10.4.5. GTT Communications, Inc.
10.4.5.1. Participant’s Overview
10.4.5.2. Financial Performance
10.4.5.3. Product Benchmarking
10.4.5.4. Strategic Initiatives
10.4.6. Lumen Technologies, Inc.
10.4.6.1. Participant’s Overview
10.4.6.2. Financial Performance
10.4.6.3. Product Benchmarking
10.4.6.4. Strategic Initiatives
10.4.7. Verizon Communications, Inc.
10.4.7.1. Participant’s Overview
10.4.7.2. Financial Performance
10.4.7.3. Product Benchmarking
10.4.7.4. Strategic Initiatives
10.4.8. Windstream Intellectual Property Services, LLC
10.4.8.1. Participant’s Overview
10.4.8.2. Financial Performance
10.4.8.3. Product Benchmarking
10.4.8.4. Strategic Initiatives
10.4.9. Zayo Group, LLC
10.4.9.1. Participant’s Overview
10.4.9.2. Financial Performance
10.4.9.3. Product Benchmarking
10.4.9.4. Strategic Initiatives
10.4.10. Microscan
10.4.10.1. Participant’s Overview
10.4.10.2. Financial Performance
10.4.10.3. Product Benchmarking
10.4.10.4. Strategic Initiatives
List of Tables
Table 1 Global Dark Fiber Network Market size estimates & forecasts 2021 – 2033 (USD Million)
Table 2 Global Dark Fiber Network Market, by region 2021 – 2033 (USD Million)
Table 3 Global Dark Fiber Network Market, by fiber 2021 – 2033 (USD Million)
Table 4 Global Dark Fiber Network Market, by network 2021 – 2033 (USD Million)
Table 5 Global Dark Fiber Network Market, by material 2021 – 2033 (USD Million)
Table 6 Global Dark Fiber Network Market, by application 2021 – 2033 (USD Million)
Table 7 Single Mode Dark Fiber Network Market, by region 2021 – 2033 (USD Million)
Table 8 Multi-mode Dark Fiber Network Market, by region 2021 – 2033 (USD Million)
Table 9 Step-index Multimode Fiber Dark Fiber Network Market, by region 2021 – 2033 (USD Million)
Table 10 Graded-index Multimode Fiber Dark Fiber Network Market, by region 2021 – 2033 (USD Million)
Table 11 Metro Dark Fiber Network Market, by region 2021 – 2033 (USD Million)
Table 12 Long-haul Dark Fiber Network Market, by region 2021 – 2033 (USD Million)
Table 13 Telecom Dark Fiber Network Market, by region 2021 – 2033 (USD Million)
Table 14 Oil & Gas Dark Fiber Network Market, by region 2021 – 2033 (USD Million)
Table 15 Military & Aerospace Dark Fiber Network Market, by region 2021 – 2033 (USD Million)
Table 16 BFSI Dark Fiber Network Market, by region 2021 – 2033 (USD Million)
Table 17 Medical Dark Fiber Network Market, by region 2021 – 2033 (USD Million)
Table 18 Railway Dark Fiber Network Market, by region 2021 – 2033 (USD Million)
Table 19 Others Dark Fiber Network Market, by region 2021 – 2033 (USD Million)
Table 20 North America Dark Fiber Network Market, by fiber 2021 – 2033 (USD Million)
Table 21 North America Dark Fiber Network Market, by network 2021 – 2033 (USD Million)
Table 22 North America Dark Fiber Network Market, by material 2021 – 2033 (USD Million)
Table 23 North America Dark Fiber Network Market, by application 2021 – 2033 (USD Million)
Table 24 U.S. Dark Fiber Network Market, by fiber 2021 – 2033 (USD Million)
Table 25 U.S. Dark Fiber Network Market, by network 2021 – 2033 (USD Million)
Table 26 U.S. Dark Fiber Network Market, by material 2021 – 2033 (USD Million)
Table 27 U.S. Dark Fiber Network Market, by application 2021 – 2033 (USD Million)
Table 28 Canada Dark Fiber Network Market, by fiber 2021 – 2033 (USD Million)
Table 29 Canada Dark Fiber Network Market, by network 2021 – 2033 (USD Million)
Table 30 Canada Dark Fiber Network Market, by material 2021 – 2033 (USD Million)
Table 31 Canada Dark Fiber Network Market, by application 2021 – 2033 (USD Million)
Table 32 Mexico Dark Fiber Network Market, by fiber 2021 – 2033 (USD Million)
Table 33 Mexico Dark Fiber Network Market, by network 2021 – 2033 (USD Million)
Table 34 Mexico Dark Fiber Network Market, by material 2021 – 2033 (USD Million)
Table 35 Mexico Dark Fiber Network Market, by application 2021 – 2033 (USD Million)
Table 36 Europe Dark Fiber Network Market, by fiber 2021 – 2033 (USD Million)
Table 37 Europe Dark Fiber Network Market, by network 2021 – 2033 (USD Million)
Table 38 Europe Dark Fiber Network Market, by material 2021 – 2033 (USD Million)
Table 39 Europe Dark Fiber Network Market, by application 2021 – 2033 (USD Million)
Table 40 Europe Dark Fiber Network Market, by end use 2021 – 2033 (USD Million)
Table 41 UK Dark Fiber Network Market, by fiber 2021 – 2033 (USD Million)
Table 42 UK Dark Fiber Network Market, by network 2021 – 2033 (USD Million)
Table 43 UK Dark Fiber Network Market, by material 2021 – 2033 (USD Million)
Table 44 UK Dark Fiber Network Market, by application 2021 – 2033 (USD Million)
Table 45 Germany Dark Fiber Network Market, by fiber 2021 – 2033 (USD Million)
Table 46 Germany Dark Fiber Network Market, by network 2021 – 2033 (USD Million)
Table 47 Germany Dark Fiber Network Market, by material 2021 – 2033 (USD Million)
Table 48 Germany Dark Fiber Network Market, by application 2021 – 2033 (USD Million)
Table 49 France Dark Fiber Network Market, by fiber 2021 – 2033 (USD Million)
Table 50 France Dark Fiber Network Market, by network 2021 – 2033 (USD Million)
Table 51 France Dark Fiber Network Market, by material 2021 – 2033 (USD Million)
Table 52 France Dark Fiber Network Market, by application 2021 – 2033 (USD Million)
Table 53 Asia Pacific Dark Fiber Network Market, by fiber 2021 – 2033 (USD Million)
Table 54 Asia Pacific Dark Fiber Network Market, by network 2021 – 2033 (USD Million)
Table 55 Asia Pacific Dark Fiber Network Market, by material 2021 – 2033 (USD Million)
Table 56 Asia Pacific Dark Fiber Network Market, by application 2021 – 2033 (USD Million)
Table 57 China Dark Fiber Network Market, by fiber 2021 – 2033 (USD Million)
Table 58 China Dark Fiber Network Market, by network 2021 – 2033 (USD Million)
Table 59 China Dark Fiber Network Market, by material 2021 – 2033 (USD Million)
Table 60 China Dark Fiber Network Market, by application 2021 – 2033 (USD Million)
Table 61 India Dark Fiber Network Market, by fiber 2021 – 2033 (USD Million)
Table 62 India Dark Fiber Network Market, by network 2021 – 2033 (USD Million)
Table 63 India Dark Fiber Network Market, by material 2021 – 2033 (USD Million)
Table 64 India Dark Fiber Network Market, by application 2021 – 2033 (USD Million)
Table 65 Japan Dark Fiber Network Market, by fiber 2021 – 2033 (USD Million)
Table 66 Japan Dark Fiber Network Market, by network 2021 – 2033 (USD Million)
Table 67 Japan Dark Fiber Network Market, by material 2021 – 2033 (USD Million)
Table 68 Japan Dark Fiber Network Market, by application 2021 – 2033 (USD Million)
Table 69 South Korea Dark Fiber Network Market, by fiber 2021 – 2033 (USD Million)
Table 70 South Korea Dark Fiber Network Market, by network 2021 – 2033 (USD Million)
Table 71 South Korea Dark Fiber Network Market, by material 2021 – 2033 (USD Million)
Table 72 South Korea Dark Fiber Network Market, by application 2021 – 2033 (USD Million)
Table 73 Australia Dark Fiber Network Market, by fiber 2021 – 2033 (USD Million)
Table 74 Australia Dark Fiber Network Market, by network 2021 – 2033 (USD Million)
Table 75 Australia Dark Fiber Network Market, by material 2021 – 2033 (USD Million)
Table 76 Australia Dark Fiber Network Market, by application 2021 – 2033 (USD Million)
Table 77 Latin America Dark Fiber Network Market, by fiber 2021 – 2033 (USD Million)
Table 78 Latin America Dark Fiber Network Market, by network 2021 – 2033 (USD Million)
Table 79 Latin America Dark Fiber Network Market, by material 2021 – 2033 (USD Million)
Table 80 Latin America Dark Fiber Network Market, by application 2021 – 2033 (USD Million)
Table 81 Brazil Dark Fiber Network Market, by fiber 2021 – 2033 (USD Million)
Table 82 Brazil Dark Fiber Network Market, by network 2021 – 2033 (USD Million)
Table 83 Brail Dark Fiber Network Market, by material 2021 – 2033 (USD Million)
Table 84 Brazil Dark Fiber Network Market, by application 2021 – 2033 (USD Million)
Table 85 MEA Dark Fiber Network Market, by fiber 2021 – 2033 (USD Million)
Table 86 MEA Dark Fiber Network Market, by network 2021 – 2033 (USD Million)
Table 87 MEA Dark Fiber Network Market, by material 2021 – 2033 (USD Million)
Table 88 MEA Dark Fiber Network Market, by application 2021 – 2033 (USD Million)
Table 89 UAE Dark Fiber Network Market, by fiber 2021 – 2033 (USD Million)
Table 90 UAE Dark Fiber Network Market, by network 2021 – 2033 (USD Million)
Table 91 UAE Dark Fiber Network Market, by material 2021 – 2033 (USD Million)
Table 92 UAE Dark Fiber Network Market, by application 2021 – 2033 (USD Million)
Table 93 KSA Dark Fiber Network Market, by fiber 2021 – 2033 (USD Million)
Table 94 KSA Dark Fiber Network Market, by network 2021 – 2033 (USD Million)
Table 95 KSA Dark Fiber Network Market, by material 2021 – 2033 (USD Million)
Table 96 KSA Dark Fiber Network Market, by application 2021 – 2033 (USD Million)
Table 97 South Africa Dark Fiber Network Market, by fiber 2021 – 2033 (USD Million)
Table 98 South Africa Dark Fiber Network Market, by network 2021 – 2033 (USD Million)
Table 99 South Africa Dark Fiber Network Market, by material 2021 – 2033 (USD Million)
Table 100 South Africa Dark Fiber Network Market, by application 2021 – 2033 (USD Million)
List of Figures
Fig. 1 Dark Fiber Network Market segmentation
Fig. 2 Market research process
Fig. 3 Information procurement
Fig. 4 Primary research pattern
Fig. 5 Market research approaches
Fig. 6 Value chain-based sizing & forecasting
Fig. 7 Parent market analysis
Fig. 8 Market formulation & validation
Fig. 9 Dark Fiber Network Market snapshot
Fig. 10 Dark Fiber Network Market segment snapshot
Fig. 11 Dark Fiber Network Market competitive landscape snapshot
Fig. 12 Market research process
Fig. 13 Market driver relevance analysis (Current & future impact)
Fig. 14 Market restraint relevance analysis (Current & future impact)
Fig. 15 Dark Fiber Network Market: Fiber outlook key takeaways (USD Million)
Fig. 16 Dark Fiber Network Market: Fiber movement analysis (USD Million), 2025 & 2033
Fig. 17 Single Mode market revenue estimates and forecasts, 2021 – 2033 (USD Million)
Fig. 18 Multi-mode market revenue estimates and forecasts, 2021 – 2033 (USD Million)
Fig. 19 Step-index multimode fiber market revenue estimates and forecasts, 2021 – 2033 (USD Million)
Fig. 20 Graded-index multimode fiber market revenue estimates and forecasts, 2021 – 2033 (USD Million)
Fig. 21 Dark Fiber Network Market: Network outlook key takeaways (USD Million)
Fig. 22 Dark Fiber Network Market: Network movement analysis (USD Million), 2025 & 2033
Fig. 23 Metro market revenue estimates and forecasts, 2021 – 2033 (USD Million)
Fig. 24 Long-haul market revenue estimates and forecasts, 2021 – 2033 (USD Million)
Fig. 25 Dark Fiber Network Market: Material outlook key takeaways (USD Million)
Fig. 26 Dark Fiber Network Market: Material movement analysis (USD Million), 2025 & 2033
Fig. 27 Glass market revenue estimates and forecasts, 2021 – 2033 (USD Million)
Fig. 28 Plastic market revenue estimates and forecasts, 2021 – 2033 (USD Million)
Fig. 29 Dark Fiber Network Market: Application outlook key takeaways (USD Million)
Fig. 30 Dark Fiber Network Market: Application movement analysis (USD Million), 2025 & 2033
Fig. 31 Telecom market revenue estimates and forecasts, 2021 – 2033 (USD Million)
Fig. 32 Oil & Gas revenue estimates and forecasts, 2021 – 2033 (USD Million)
Fig. 33 Military & Aerospace revenue estimates and forecasts, 2021 – 2033 (USD Million)
Fig. 34 BFSI revenue estimates and forecasts, 2021 – 2033 (USD Million)
Fig. 35 Medical revenue estimates and forecasts, 2021 – 2033 (USD Million)
Fig. 36 Railway revenue estimates and forecasts, 2021 – 2033 (USD Million)
Fig. 37 Others revenue estimates and forecasts, 2021 – 2033 (USD Million)
Fig. 38 Dark Fiber Network Market: Regional outlook, 2025 & 2033, USD Million
Fig. 39 North America Dark Fiber Network Market estimates and forecasts, 2021 – 2033 (USD Million)
Fig. 40 U.S. Dark Fiber Network Market estimates and forecasts, 2021 – 2033 (USD Million)
Fig. 41 Canada Dark Fiber Network Market estimates and forecasts, 2021 – 2033 (USD Million)
Fig. 42 Mexico Dark Fiber Network Market estimates and forecasts, 2021 – 2033 (USD Million)
Fig. 43 Europe Dark Fiber Network Market estimates and forecasts, 2021 – 2033 (USD Million)
Fig. 44 UK Dark Fiber Network Market estimates and forecasts, 2021 – 2033 (USD Million)
Fig. 45 Germany Dark Fiber Network Market estimates and forecasts, 2021 – 2033 (USD Million)
Fig. 46 France Dark Fiber Network Market estimates and forecasts, 2021 – 2033 (USD Million)
Fig. 47 Asia Pacific Dark Fiber Network Market estimates and forecasts, 2021 – 2033 (USD Million)
Fig. 48 China Dark Fiber Network Market estimates and forecasts, 2021 – 2033 (USD Million)
Fig. 49 Japan Dark Fiber Network Market estimates and forecasts, 2021 – 2033 (USD Million)
Fig. 50 India Dark Fiber Network Market estimates and forecasts, 2021 – 2033 (USD Million)
Fig. 51 Australia Dark Fiber Network Market estimates and forecasts, 2021 – 2033 (USD Million)
Fig. 52 South Korea Dark Fiber Network Market estimates and forecasts, 2021 – 2033 (USD Million)
Fig. 53 Latin America Dark Fiber Network Market estimates and forecasts, 2021 – 2033 (USD Million)
Fig. 54 Brazil Dark Fiber Network Market estimates and forecasts, 2021 – 2033 (USD Million)
Fig. 55 MEA Dark Fiber Network Market estimates and forecasts, 2021 – 2033 (USD Million)
Fig. 56 KSA Dark Fiber Network Market estimates and forecasts, 2021 – 2033 (USD Million)
Fig. 57 UAE Dark Fiber Network Market estimates and forecasts, 2021 – 2033 (USD Million)
Fig. 58 South Africa Dark Fiber Network Market estimates and forecasts, 2021 – 2033 (USD Million)
Fig. 59 Strategy framework
Fig. 60 Company Categorization