Commercial Display Market : Global Opportunity Analysis and Industry Forecast, 2024-2034
商業用ディスプレイ市場 - 製品別(デジタルサイネージ、ディスプレイテレビ、その他)、技術別(LED、LCD、OLED、その他)、用途別(小売、運輸、ホテル、ヘルスケア、エンターテイメント、その他):機会分析と業界予測、2024年-2034年
Commercial Display Market By Product (Digital Signage, Display TV, Others), By Technology (LED, LCD, OLED, Others), By Application (Retail, Transportation, Hospitality, Healthcare, Entertainment, Others): Global Opportunity Analysis and Industry Forecast, 2024-2034
| 出版 | Allied Market Research |
| 出版年月 | 2025年06月 |
| ページ数 | 225 |
| 価格 | 記載以外のライセンスについてはお問合せください |
| シングルユーザ | USD 4,155 |
| 種別 | 英文調査報告書 |
| 商品番号 | SMR-12034 |

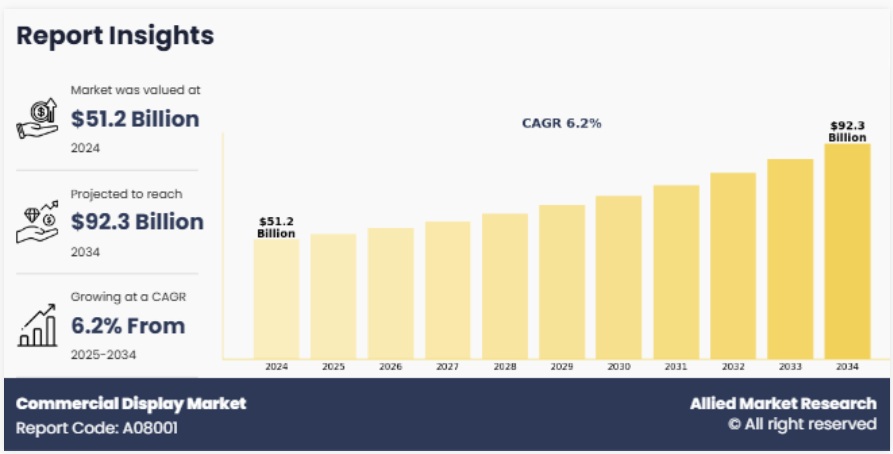
商業用ディスプレイ市場は2024年に512億3,220万ドルと評価され、2025年から2034年にかけて6.2%のCAGRで成長し、2034年までに923億3,960万ドルに達すると予測されています。
商業用ディスプレイは、小売、交通、ホテル、企業などのビジネス環境での継続的な運用を想定して設計された高性能デジタルスクリーンです。一般消費者向けディスプレイと比較して、業務用ディスプレイは優れた耐久性、明るさ、接続性を備えています。
これらのディスプレイは、長期間(多くの場合、16時間365日または24時間365日)稼働してもパフォーマンスを低下させないように設計されており、堅牢な筐体、高度な冷却システム、そして明るい場所でも鮮明な視認性を実現する高輝度レベルを備えています。幅広い入力タイプをサポートし、リモート管理が可能で、デジタルサイネージソフトウェアとシームレスに統合できます。広告、情報配信、インタラクティブな顧客エンゲージメントに最適な商用ディスプレイは、あらゆる業界の現代のコミュニケーションとブランディング戦略に不可欠な信頼性と柔軟性を提供します。 商用ディスプレイ市場は、様々な業界で動的なコンテンツ配信と強化された顧客エンゲージメントに対する需要の高まりに牽引され、著しい成長を遂げています。主な成長要因の一つは、小売、ホスピタリティ、運輸、ヘルスケア、教育などの分野におけるデジタルサイネージの導入増加です。企業は、コミュニケーションの改善、製品の宣伝、リアルタイム情報の提供のために商用ディスプレイを活用しており、顧客体験全体を向上させています。
Report Description
The commercial display market was valued at $51,232.2 million in 2024 and is estimated to reach $92,339.6 million by 2034, exhibiting a CAGR of 6.2% from 2025 to 2034.
A commercial display is a high-performance digital screen engineered for continuous operation in business environments such as retail, transportation, hospitality, and corporate settings. Compared to consumer-grade displays, commercial displays offer superior durability, brightness, and connectivity.
Designed to run for extended periods—often 16/7 or 24/7—without degrading performance, these displays feature robust enclosures, advanced cooling systems, and high brightness levels for clear visibility in brightly lit areas. They support a wide range of input types, enable remote management, and integrate seamlessly with digital signage software. Ideal for advertising, information delivery, and interactive customer engagement, commercial displays provide the reliability and flexibility essential for modern communication and branding strategies across industries.
The commercial display market is experiencing significant growth, driven by the increasing demand for dynamic content delivery and enhanced customer engagement across various industries. One of the primary growth factors is the rising adoption of digital signage in sectors such as retail, hospitality, transportation, healthcare, and education. Businesses are using commercial displays to improve communication, advertise products, and provide real-time information, which enhances the overall customer experience.
Technological advancements have further propelled market growth. Features such as 4K/8K resolution, OLED and QLED displays, touchscreen capabilities, and seamless integration with cloud-based digital signage software are attracting businesses looking for more interactive and visually compelling solutions. Moreover, the rapid expansion of smart cities and smart infrastructure projects across the globe is boosting the demand for commercial displays in public transportation systems, airports, and government buildings.
Another key growth driver is the increased investment in advertising and branding by companies looking to capture consumer attention in a competitive market. Additionally, the proliferation of internet connectivity and the rise of content management systems enable remote access and real-time updates, making commercial displays more scalable and efficient.
On the other hand, the growing trend of smart cities and the integration of AI and IoT technologies in commercial displays offer lucrative growth opportunities. AI-powered displays can dynamically adjust messaging, such as promoting umbrellas during rain or showcasing local events, thereby increasing viewer engagement and relevance.
The increased use of interactive and touchscreen displays for personalized customer experiences is also expected to open new avenues for market growth.
The commercial display market is segmented into product, technology, application, and region. By product, the market is categorized into digital signage, display TV, and others. By technology, the commercial display market is segmented into LED, LCD, OLED, and others. By application, the commercial display industry is studied across retail, transportation, hospitality, healthcare, entertainment, and others. Region-wise, the commercial display market is analyzed across North America (the U.S., Canada, and Mexico), Europe (UK, Germany, France, Italy, and the rest of Europe), Asia-Pacific (China, Japan, India, South Korea, Rest of Asia-Pacific), and LAMEA (Latin America, the Middle East, and Africa).
Key players in the commercial display market include SAMSUNG, CDW, Cisco Systems, Inc., Dell Inc., Koninklijke Philips N.V., LG DISPLAY CO., LTD., NEC Corporation, Panasonic Holdings Corporation, Daktronics, Sharp Electronics Corporation, and Sony Corporation. Leading companies are focusing on new product launches, system integration capabilities, and strategic partnerships to strengthen their market position and meet evolving customer demands.
Additional benefits you will get with this purchase are:
● Quarterly Update and* (only available with a corporate license, on listed price)
● 5 additional Company Profile of client Choice pre- or Post-purchase, as a free update.
● Free Upcoming Version on the Purchase of Five and Enterprise User License.
● 16 analyst hours of support* (post-purchase, if you find additional data requirements upon review of the report, you may receive support amounting to 16 analyst hours to solve questions, and post-sale queries)
● 15% Free Customization* (in case the scope or segment of the report does not match your requirements, 15% is equivalent to 3 working days of free work, applicable once)
● Free data Pack on the Five and Enterprise User License. (Excel version of the report)
● Free Updated report if the report is 6-12 months old or older.
● 24-hour priority response*
● Free Industry updates and white papers.
Possible Customization with this report (with additional cost and timeline, please talk to the sales executive to know more)
● Regulatory Guidelines
● Additional company profiles with specific to client’s interest
● Historic market data
Commercial Display Market Report Highlights
| Aspects | Details |
|
Market Size By 2034
|
USD 92.3 billion |
|
Growth Rate
|
CAGR of 6.2% |
|
Forecast period
|
2024 – 2034 |
|
Report Pages
|
225 |
|
By Application
|
|
|
By Product
|
|
|
By Technology
|
|
|
By Region
|
|
|
Key Market Players
|
Koninklijke Philips N.V., Sharp Electronics Corporation, Dell Inc., Cisco Systems Inc., NEC Corporation, LG DISPLAY CO., LTD., Samsung Electronics, Panasonic Holdings Corporation, Sony Corporation, Daktronics, Inc. |
Table of Content
CHAPTER 1: INTRODUCTION
1.1. Report description
1.2. Key market segments
1.3. Key benefits to the stakeholders
1.4. Research methodology
1.4.1. Primary research
1.4.2. Secondary research
1.4.3. Analyst tools and models
CHAPTER 2: EXECUTIVE SUMMARY
2.1. CXO perspective
CHAPTER 3: MARKET OVERVIEW
3.1. Market definition and scope
3.2. Key findings
3.2.1. Top impacting factors
3.2.2. Top investment pockets
3.3. Porter’s five forces analysis
3.3.1. Moderate bargaining power of suppliers
3.3.2. Moderate to high threat of new entrants
3.3.3. Moderate threat of substitutes
3.3.4. Moderate intensity of rivalry
3.3.5. Moderate bargaining power of buyers
3.4. Market dynamics
3.4.1. Drivers
3.4.1.1. Growing Demand for Digital Signage Across Retail and Hospitality
3.4.1.2. Adoption of Advanced Display Technologies (4K, OLED, LED)
3.4.1.3. Rising Demand from Education and Corporate Sectors
3.4.2. Restraints
3.4.2.1. High Initial Investment and Maintenance Costs
3.4.3. Opportunities
3.4.3.1. Expansion of DOOH (Digital-Out-Of-Home) Advertising Networks
CHAPTER 4: COMMERCIAL DISPLAY MARKET, BY PRODUCT
4.1. Overview
4.1.1. Market size and forecast
4.2. Digital Signage
4.2.1. Key market trends, growth factors and opportunities
4.2.2. Market size and forecast, by region
4.2.3. Market share analysis by country
4.3. Display TV
4.3.1. Key market trends, growth factors and opportunities
4.3.2. Market size and forecast, by region
4.3.3. Market share analysis by country
4.4. Others
4.4.1. Key market trends, growth factors and opportunities
4.4.2. Market size and forecast, by region
4.4.3. Market share analysis by country
CHAPTER 5: COMMERCIAL DISPLAY MARKET, BY TECHNOLOGY
5.1. Overview
5.1.1. Market size and forecast
5.2. LED
5.2.1. Key market trends, growth factors and opportunities
5.2.2. Market size and forecast, by region
5.2.3. Market share analysis by country
5.3. LCD
5.3.1. Key market trends, growth factors and opportunities
5.3.2. Market size and forecast, by region
5.3.3. Market share analysis by country
5.4. OLED
5.4.1. Key market trends, growth factors and opportunities
5.4.2. Market size and forecast, by region
5.4.3. Market share analysis by country
5.5. Others
5.5.1. Key market trends, growth factors and opportunities
5.5.2. Market size and forecast, by region
5.5.3. Market share analysis by country
CHAPTER 6: COMMERCIAL DISPLAY MARKET, BY APPLICATION
6.1. Overview
6.1.1. Market size and forecast
6.2. Retail
6.2.1. Key market trends, growth factors and opportunities
6.2.2. Market size and forecast, by region
6.2.3. Market share analysis by country
6.3. Transportation
6.3.1. Key market trends, growth factors and opportunities
6.3.2. Market size and forecast, by region
6.3.3. Market share analysis by country
6.4. Hospitality
6.4.1. Key market trends, growth factors and opportunities
6.4.2. Market size and forecast, by region
6.4.3. Market share analysis by country
6.5. Healthcare
6.5.1. Key market trends, growth factors and opportunities
6.5.2. Market size and forecast, by region
6.5.3. Market share analysis by country
6.6. Entertainment
6.6.1. Key market trends, growth factors and opportunities
6.6.2. Market size and forecast, by region
6.6.3. Market share analysis by country
6.7. Others
6.7.1. Key market trends, growth factors and opportunities
6.7.2. Market size and forecast, by region
6.7.3. Market share analysis by country
CHAPTER 7: COMMERCIAL DISPLAY MARKET, BY REGION
7.1. Overview
7.1.1. Market size and forecast By Region
7.2. North America
7.2.1. Key market trends, growth factors and opportunities
7.2.2. Market size and forecast, by Product
7.2.3. Market size and forecast, by Technology
7.2.4. Market size and forecast, by Application
7.2.5. Market size and forecast, by country
7.2.5.1. U.S.
7.2.5.1.1. Market size and forecast, by Product
7.2.5.1.2. Market size and forecast, by Technology
7.2.5.1.3. Market size and forecast, by Application
7.2.5.2. Canada
7.2.5.2.1. Market size and forecast, by Product
7.2.5.2.2. Market size and forecast, by Technology
7.2.5.2.3. Market size and forecast, by Application
7.2.5.3. Mexico
7.2.5.3.1. Market size and forecast, by Product
7.2.5.3.2. Market size and forecast, by Technology
7.2.5.3.3. Market size and forecast, by Application
7.3. Europe
7.3.1. Key market trends, growth factors and opportunities
7.3.2. Market size and forecast, by Product
7.3.3. Market size and forecast, by Technology
7.3.4. Market size and forecast, by Application
7.3.5. Market size and forecast, by country
7.3.5.1. UK
7.3.5.1.1. Market size and forecast, by Product
7.3.5.1.2. Market size and forecast, by Technology
7.3.5.1.3. Market size and forecast, by Application
7.3.5.2. Germany
7.3.5.2.1. Market size and forecast, by Product
7.3.5.2.2. Market size and forecast, by Technology
7.3.5.2.3. Market size and forecast, by Application
7.3.5.3. France
7.3.5.3.1. Market size and forecast, by Product
7.3.5.3.2. Market size and forecast, by Technology
7.3.5.3.3. Market size and forecast, by Application
7.3.5.4. Italy
7.3.5.4.1. Market size and forecast, by Product
7.3.5.4.2. Market size and forecast, by Technology
7.3.5.4.3. Market size and forecast, by Application
7.3.5.5. Rest of Europe
7.3.5.5.1. Market size and forecast, by Product
7.3.5.5.2. Market size and forecast, by Technology
7.3.5.5.3. Market size and forecast, by Application
7.4. Asia-Pacific
7.4.1. Key market trends, growth factors and opportunities
7.4.2. Market size and forecast, by Product
7.4.3. Market size and forecast, by Technology
7.4.4. Market size and forecast, by Application
7.4.5. Market size and forecast, by country
7.4.5.1. China
7.4.5.1.1. Market size and forecast, by Product
7.4.5.1.2. Market size and forecast, by Technology
7.4.5.1.3. Market size and forecast, by Application
7.4.5.2. Japan
7.4.5.2.1. Market size and forecast, by Product
7.4.5.2.2. Market size and forecast, by Technology
7.4.5.2.3. Market size and forecast, by Application
7.4.5.3. India
7.4.5.3.1. Market size and forecast, by Product
7.4.5.3.2. Market size and forecast, by Technology
7.4.5.3.3. Market size and forecast, by Application
7.4.5.4. South Korea
7.4.5.4.1. Market size and forecast, by Product
7.4.5.4.2. Market size and forecast, by Technology
7.4.5.4.3. Market size and forecast, by Application
7.4.5.5. Rest of Asia-Pacific
7.4.5.5.1. Market size and forecast, by Product
7.4.5.5.2. Market size and forecast, by Technology
7.4.5.5.3. Market size and forecast, by Application
7.5. LAMEA
7.5.1. Key market trends, growth factors and opportunities
7.5.2. Market size and forecast, by Product
7.5.3. Market size and forecast, by Technology
7.5.4. Market size and forecast, by Application
7.5.5. Market size and forecast, by country
7.5.5.1. Latin America
7.5.5.1.1. Market size and forecast, by Product
7.5.5.1.2. Market size and forecast, by Technology
7.5.5.1.3. Market size and forecast, by Application
7.5.5.2. Middle East
7.5.5.2.1. Market size and forecast, by Product
7.5.5.2.2. Market size and forecast, by Technology
7.5.5.2.3. Market size and forecast, by Application
7.5.5.3. Africa
7.5.5.3.1. Market size and forecast, by Product
7.5.5.3.2. Market size and forecast, by Technology
7.5.5.3.3. Market size and forecast, by Application
CHAPTER 8: COMPETITIVE LANDSCAPE
8.1. Introduction
8.2. Top winning strategies
8.3. Product mapping of top 10 player
8.4. Competitive dashboard
8.5. Competitive heatmap
8.6. Top player positioning, 2024
CHAPTER 9: COMPANY PROFILES
9.1. Samsung Electronics
9.1.1. Company overview
9.1.2. Key executives
9.1.3. Company snapshot
9.1.4. Operating business segments
9.1.5. Product portfolio
9.1.6. Business performance
9.2. Cisco Systems Inc.
9.2.1. Company overview
9.2.2. Key executives
9.2.3. Company snapshot
9.2.4. Operating business segments
9.2.5. Product portfolio
9.2.6. Business performance
9.2.7. Key strategic moves and developments
9.3. Dell Inc.
9.3.1. Company overview
9.3.2. Key executives
9.3.3. Company snapshot
9.3.4. Operating business segments
9.3.5. Product portfolio
9.3.6. Business performance
9.4. Koninklijke Philips N.V.
9.4.1. Company overview
9.4.2. Key executives
9.4.3. Company snapshot
9.4.4. Operating business segments
9.4.5. Product portfolio
9.4.6. Business performance
9.5. LG DISPLAY CO., LTD.
9.5.1. Company overview
9.5.2. Key executives
9.5.3. Company snapshot
9.5.4. Operating business segments
9.5.5. Product portfolio
9.5.6. Business performance
9.5.7. Key strategic moves and developments
9.6. NEC Corporation
9.6.1. Company overview
9.6.2. Key executives
9.6.3. Company snapshot
9.6.4. Operating business segments
9.6.5. Product portfolio
9.6.6. Business performance
9.7. Panasonic Holdings Corporation
9.7.1. Company overview
9.7.2. Key executives
9.7.3. Company snapshot
9.7.4. Operating business segments
9.7.5. Product portfolio
9.7.6. Business performance
9.7.7. Key strategic moves and developments
9.8. Daktronics, Inc.
9.8.1. Company overview
9.8.2. Key executives
9.8.3. Company snapshot
9.8.4. Operating business segments
9.8.5. Product portfolio
9.8.6. Business performance
9.9. Sony Corporation
9.9.1. Company overview
9.9.2. Key executives
9.9.3. Company snapshot
9.9.4. Operating business segments
9.9.5. Product portfolio
9.9.6. Business performance
9.9.7. Key strategic moves and developments
9.10. Sharp Electronics Corporation
9.10.1. Company overview
9.10.2. Key executives
9.10.3. Company snapshot
9.10.4. Operating business segments
9.10.5. Product portfolio
9.10.6. Business performance
9.10.7. Key strategic moves and developments
LIST OF TABLES
TABLE 01. GLOBAL COMMERCIAL DISPLAY MARKET, BY PRODUCT, 2024-2034 (MILLION UNITS)
TABLE 02. GLOBAL COMMERCIAL DISPLAY MARKET, BY PRODUCT, 2024-2034 ($MILLION)
TABLE 03. COMMERCIAL DISPLAY MARKET FOR DIGITAL SIGNAGE, BY REGION, 2024-2034 ($MILLION)
TABLE 04. COMMERCIAL DISPLAY MARKET FOR DISPLAY TV, BY REGION, 2024-2034 ($MILLION)
TABLE 05. COMMERCIAL DISPLAY MARKET FOR OTHERS, BY REGION, 2024-2034 ($MILLION)
TABLE 06. GLOBAL COMMERCIAL DISPLAY MARKET, BY TECHNOLOGY, 2024-2034 ($MILLION)
TABLE 07. COMMERCIAL DISPLAY MARKET FOR LED, BY REGION, 2024-2034 ($MILLION)
TABLE 08. COMMERCIAL DISPLAY MARKET FOR LCD, BY REGION, 2024-2034 ($MILLION)
TABLE 09. COMMERCIAL DISPLAY MARKET FOR OLED, BY REGION, 2024-2034 ($MILLION)
TABLE 10. COMMERCIAL DISPLAY MARKET FOR OTHERS, BY REGION, 2024-2034 ($MILLION)
TABLE 11. GLOBAL COMMERCIAL DISPLAY MARKET, BY APPLICATION, 2024-2034 ($MILLION)
TABLE 12. COMMERCIAL DISPLAY MARKET FOR RETAIL, BY REGION, 2024-2034 ($MILLION)
TABLE 13. COMMERCIAL DISPLAY MARKET FOR TRANSPORTATION, BY REGION, 2024-2034 ($MILLION)
TABLE 14. COMMERCIAL DISPLAY MARKET FOR HOSPITALITY, BY REGION, 2024-2034 ($MILLION)
TABLE 15. COMMERCIAL DISPLAY MARKET FOR HEALTHCARE, BY REGION, 2024-2034 ($MILLION)
TABLE 16. COMMERCIAL DISPLAY MARKET FOR ENTERTAINMENT, BY REGION, 2024-2034 ($MILLION)
TABLE 17. COMMERCIAL DISPLAY MARKET FOR OTHERS, BY REGION, 2024-2034 ($MILLION)
TABLE 18. COMMERCIAL DISPLAY MARKET, BY REGION, 2024-2034 ($MILLION)
TABLE 19. NORTH AMERICA COMMERCIAL DISPLAY MARKET, BY PRODUCT, 2024-2034 ($MILLION)
TABLE 20. NORTH AMERICA COMMERCIAL DISPLAY MARKET, BY TECHNOLOGY, 2024-2034 ($MILLION)
TABLE 21. NORTH AMERICA COMMERCIAL DISPLAY MARKET, BY APPLICATION, 2024-2034 ($MILLION)
TABLE 22. NORTH AMERICA COMMERCIAL DISPLAY MARKET, BY COUNTRY, 2024-2034 ($MILLION)
TABLE 23. U.S. COMMERCIAL DISPLAY MARKET, BY PRODUCT, 2024-2034 ($MILLION)
TABLE 24. U.S. COMMERCIAL DISPLAY MARKET, BY TECHNOLOGY, 2024-2034 ($MILLION)
TABLE 25. U.S. COMMERCIAL DISPLAY MARKET, BY APPLICATION, 2024-2034 ($MILLION)
TABLE 26. CANADA COMMERCIAL DISPLAY MARKET, BY PRODUCT, 2024-2034 ($MILLION)
TABLE 27. CANADA COMMERCIAL DISPLAY MARKET, BY TECHNOLOGY, 2024-2034 ($MILLION)
TABLE 28. CANADA COMMERCIAL DISPLAY MARKET, BY APPLICATION, 2024-2034 ($MILLION)
TABLE 29. MEXICO COMMERCIAL DISPLAY MARKET, BY PRODUCT, 2024-2034 ($MILLION)
TABLE 30. MEXICO COMMERCIAL DISPLAY MARKET, BY TECHNOLOGY, 2024-2034 ($MILLION)
TABLE 31. MEXICO COMMERCIAL DISPLAY MARKET, BY APPLICATION, 2024-2034 ($MILLION)
TABLE 32. EUROPE COMMERCIAL DISPLAY MARKET, BY PRODUCT, 2024-2034 ($MILLION)
TABLE 33. EUROPE COMMERCIAL DISPLAY MARKET, BY TECHNOLOGY, 2024-2034 ($MILLION)
TABLE 34. EUROPE COMMERCIAL DISPLAY MARKET, BY APPLICATION, 2024-2034 ($MILLION)
TABLE 35. EUROPE COMMERCIAL DISPLAY MARKET, BY COUNTRY, 2024-2034 ($MILLION)
TABLE 36. UK COMMERCIAL DISPLAY MARKET, BY PRODUCT, 2024-2034 ($MILLION)
TABLE 37. UK COMMERCIAL DISPLAY MARKET, BY TECHNOLOGY, 2024-2034 ($MILLION)
TABLE 38. UK COMMERCIAL DISPLAY MARKET, BY APPLICATION, 2024-2034 ($MILLION)
TABLE 39. GERMANY COMMERCIAL DISPLAY MARKET, BY PRODUCT, 2024-2034 ($MILLION)
TABLE 40. GERMANY COMMERCIAL DISPLAY MARKET, BY TECHNOLOGY, 2024-2034 ($MILLION)
TABLE 41. GERMANY COMMERCIAL DISPLAY MARKET, BY APPLICATION, 2024-2034 ($MILLION)
TABLE 42. FRANCE COMMERCIAL DISPLAY MARKET, BY PRODUCT, 2024-2034 ($MILLION)
TABLE 43. FRANCE COMMERCIAL DISPLAY MARKET, BY TECHNOLOGY, 2024-2034 ($MILLION)
TABLE 44. FRANCE COMMERCIAL DISPLAY MARKET, BY APPLICATION, 2024-2034 ($MILLION)
TABLE 45. ITALY COMMERCIAL DISPLAY MARKET, BY PRODUCT, 2024-2034 ($MILLION)
TABLE 46. ITALY COMMERCIAL DISPLAY MARKET, BY TECHNOLOGY, 2024-2034 ($MILLION)
TABLE 47. ITALY COMMERCIAL DISPLAY MARKET, BY APPLICATION, 2024-2034 ($MILLION)
TABLE 48. REST OF EUROPE COMMERCIAL DISPLAY MARKET, BY PRODUCT, 2024-2034 ($MILLION)
TABLE 49. REST OF EUROPE COMMERCIAL DISPLAY MARKET, BY TECHNOLOGY, 2024-2034 ($MILLION)
TABLE 50. REST OF EUROPE COMMERCIAL DISPLAY MARKET, BY APPLICATION, 2024-2034 ($MILLION)
TABLE 51. ASIA-PACIFIC COMMERCIAL DISPLAY MARKET, BY PRODUCT, 2024-2034 ($MILLION)
TABLE 52. ASIA-PACIFIC COMMERCIAL DISPLAY MARKET, BY TECHNOLOGY, 2024-2034 ($MILLION)
TABLE 53. ASIA-PACIFIC COMMERCIAL DISPLAY MARKET, BY APPLICATION, 2024-2034 ($MILLION)
TABLE 54. ASIA-PACIFIC COMMERCIAL DISPLAY MARKET, BY COUNTRY, 2024-2034 ($MILLION)
TABLE 55. CHINA COMMERCIAL DISPLAY MARKET, BY PRODUCT, 2024-2034 ($MILLION)
TABLE 56. CHINA COMMERCIAL DISPLAY MARKET, BY TECHNOLOGY, 2024-2034 ($MILLION)
TABLE 57. CHINA COMMERCIAL DISPLAY MARKET, BY APPLICATION, 2024-2034 ($MILLION)
TABLE 58. JAPAN COMMERCIAL DISPLAY MARKET, BY PRODUCT, 2024-2034 ($MILLION)
TABLE 59. JAPAN COMMERCIAL DISPLAY MARKET, BY TECHNOLOGY, 2024-2034 ($MILLION)
TABLE 60. JAPAN COMMERCIAL DISPLAY MARKET, BY APPLICATION, 2024-2034 ($MILLION)
TABLE 61. INDIA COMMERCIAL DISPLAY MARKET, BY PRODUCT, 2024-2034 ($MILLION)
TABLE 62. INDIA COMMERCIAL DISPLAY MARKET, BY TECHNOLOGY, 2024-2034 ($MILLION)
TABLE 63. INDIA COMMERCIAL DISPLAY MARKET, BY APPLICATION, 2024-2034 ($MILLION)
TABLE 64. SOUTH KOREA COMMERCIAL DISPLAY MARKET, BY PRODUCT, 2024-2034 ($MILLION)
TABLE 65. SOUTH KOREA COMMERCIAL DISPLAY MARKET, BY TECHNOLOGY, 2024-2034 ($MILLION)
TABLE 66. SOUTH KOREA COMMERCIAL DISPLAY MARKET, BY APPLICATION, 2024-2034 ($MILLION)
TABLE 67. REST OF ASIA-PACIFIC COMMERCIAL DISPLAY MARKET, BY PRODUCT, 2024-2034 ($MILLION)
TABLE 68. REST OF ASIA-PACIFIC COMMERCIAL DISPLAY MARKET, BY TECHNOLOGY, 2024-2034 ($MILLION)
TABLE 69. REST OF ASIA-PACIFIC COMMERCIAL DISPLAY MARKET, BY APPLICATION, 2024-2034 ($MILLION)
TABLE 70. LAMEA COMMERCIAL DISPLAY MARKET, BY PRODUCT, 2024-2034 ($MILLION)
TABLE 71. LAMEA COMMERCIAL DISPLAY MARKET, BY TECHNOLOGY, 2024-2034 ($MILLION)
TABLE 72. LAMEA COMMERCIAL DISPLAY MARKET, BY APPLICATION, 2024-2034 ($MILLION)
TABLE 73. LAMEA COMMERCIAL DISPLAY MARKET, BY COUNTRY, 2024-2034 ($MILLION)
TABLE 74. LATIN AMERICA COMMERCIAL DISPLAY MARKET, BY PRODUCT, 2024-2034 ($MILLION)
TABLE 75. LATIN AMERICA COMMERCIAL DISPLAY MARKET, BY TECHNOLOGY, 2024-2034 ($MILLION)
TABLE 76. LATIN AMERICA COMMERCIAL DISPLAY MARKET, BY APPLICATION, 2024-2034 ($MILLION)
TABLE 77. MIDDLE EAST COMMERCIAL DISPLAY MARKET, BY PRODUCT, 2024-2034 ($MILLION)
TABLE 78. MIDDLE EAST COMMERCIAL DISPLAY MARKET, BY TECHNOLOGY, 2024-2034 ($MILLION)
TABLE 79. MIDDLE EAST COMMERCIAL DISPLAY MARKET, BY APPLICATION, 2024-2034 ($MILLION)
TABLE 80. AFRICA COMMERCIAL DISPLAY MARKET, BY PRODUCT, 2024-2034 ($MILLION)
TABLE 81. AFRICA COMMERCIAL DISPLAY MARKET, BY TECHNOLOGY, 2024-2034 ($MILLION)
TABLE 82. AFRICA COMMERCIAL DISPLAY MARKET, BY APPLICATION, 2024-2034 ($MILLION)
TABLE 83. SAMSUNG ELECTRONICS: KEY EXECUTIVES
TABLE 84. SAMSUNG ELECTRONICS: COMPANY SNAPSHOT
TABLE 85. SAMSUNG ELECTRONICS: PRODUCT SEGMENTS
TABLE 86. SAMSUNG ELECTRONICS: PRODUCT PORTFOLIO
TABLE 87. CISCO SYSTEMS INC.: KEY EXECUTIVES
TABLE 88. CISCO SYSTEMS INC.: COMPANY SNAPSHOT
TABLE 89. CISCO SYSTEMS INC.: PRODUCT SEGMENTS
TABLE 90. CISCO SYSTEMS INC.: PRODUCT PORTFOLIO
TABLE 91. CISCO SYSTEMS INC.: KEY STRATERGIES
TABLE 92. DELL INC.: KEY EXECUTIVES
TABLE 93. DELL INC.: COMPANY SNAPSHOT
TABLE 94. DELL INC.: SERVICE SEGMENTS
TABLE 95. DELL INC.: PRODUCT PORTFOLIO
TABLE 96. KONINKLIJKE PHILIPS N.V.: KEY EXECUTIVES
TABLE 97. KONINKLIJKE PHILIPS N.V.: COMPANY SNAPSHOT
TABLE 98. KONINKLIJKE PHILIPS N.V.: PRODUCT SEGMENTS
TABLE 99. KONINKLIJKE PHILIPS N.V.: PRODUCT PORTFOLIO
TABLE 100. LG DISPLAY CO., LTD.: KEY EXECUTIVES
TABLE 101. LG DISPLAY CO., LTD.: COMPANY SNAPSHOT
TABLE 102. LG DISPLAY CO., LTD.: PRODUCT SEGMENTS
TABLE 103. LG DISPLAY CO., LTD.: PRODUCT PORTFOLIO
TABLE 104. LG DISPLAY CO., LTD.: KEY STRATERGIES
TABLE 105. NEC CORPORATION: KEY EXECUTIVES
TABLE 106. NEC CORPORATION: COMPANY SNAPSHOT
TABLE 107. NEC CORPORATION: SERVICE SEGMENTS
TABLE 108. NEC CORPORATION: PRODUCT PORTFOLIO
TABLE 109. PANASONIC HOLDINGS CORPORATION: KEY EXECUTIVES
TABLE 110. PANASONIC HOLDINGS CORPORATION: COMPANY SNAPSHOT
TABLE 111. PANASONIC HOLDINGS CORPORATION: PRODUCT SEGMENTS
TABLE 112. PANASONIC HOLDINGS CORPORATION: PRODUCT PORTFOLIO
TABLE 113. PANASONIC HOLDINGS CORPORATION: KEY STRATERGIES
TABLE 114. DAKTRONICS, INC.: KEY EXECUTIVES
TABLE 115. DAKTRONICS, INC.: COMPANY SNAPSHOT
TABLE 116. DAKTRONICS, INC.: PRODUCT SEGMENTS
TABLE 117. DAKTRONICS, INC.: PRODUCT PORTFOLIO
TABLE 118. SONY CORPORATION: KEY EXECUTIVES
TABLE 119. SONY CORPORATION: COMPANY SNAPSHOT
TABLE 120. SONY CORPORATION: SERVICE SEGMENTS
TABLE 121. SONY CORPORATION: PRODUCT PORTFOLIO
TABLE 122. SONY CORPORATION: KEY STRATERGIES
TABLE 123. SHARP ELECTRONICS CORPORATION: KEY EXECUTIVES
TABLE 124. SHARP ELECTRONICS CORPORATION: COMPANY SNAPSHOT
TABLE 125. SHARP ELECTRONICS CORPORATION: PRODUCT SEGMENTS
TABLE 126. SHARP ELECTRONICS CORPORATION: PRODUCT PORTFOLIO
TABLE 127. SHARP ELECTRONICS CORPORATION: KEY STRATERGIES
LIST OF FIGURES
FIGURE 01. COMMERCIAL DISPLAY MARKET, 2024-2034
FIGURE 02. SEGMENTATION OF COMMERCIAL DISPLAY MARKET,2024-2034
FIGURE 03. TOP IMPACTING FACTORS IN COMMERCIAL DISPLAY MARKET (2024 TO 2034)
FIGURE 04. TOP INVESTMENT POCKETS IN COMMERCIAL DISPLAY MARKET (2025-2034)
FIGURE 05. MODERATE BARGAINING POWER OF SUPPLIERS
FIGURE 06. MODERATE TO HIGH THREAT OF NEW ENTRANTS
FIGURE 07. MODERATE THREAT OF SUBSTITUTES
FIGURE 08. MODERATE INTENSITY OF RIVALRY
FIGURE 09. MODERATE BARGAINING POWER OF BUYERS
FIGURE 10. GLOBAL COMMERCIAL DISPLAY MARKET:DRIVERS, RESTRAINTS AND OPPORTUNITIES
FIGURE 11. COMMERCIAL DISPLAY MARKET, BY PRODUCT, 2024 AND 2034(%)
FIGURE 12. COMPARATIVE SHARE ANALYSIS OF COMMERCIAL DISPLAY MARKET FOR DIGITAL SIGNAGE, BY COUNTRY 2024 AND 2034(%)
FIGURE 13. COMPARATIVE SHARE ANALYSIS OF COMMERCIAL DISPLAY MARKET FOR DISPLAY TV, BY COUNTRY 2024 AND 2034(%)
FIGURE 14. COMPARATIVE SHARE ANALYSIS OF COMMERCIAL DISPLAY MARKET FOR OTHERS, BY COUNTRY 2024 AND 2034(%)
FIGURE 15. COMMERCIAL DISPLAY MARKET, BY TECHNOLOGY, 2024 AND 2034(%)
FIGURE 16. COMPARATIVE SHARE ANALYSIS OF COMMERCIAL DISPLAY MARKET FOR LED, BY COUNTRY 2024 AND 2034(%)
FIGURE 17. COMPARATIVE SHARE ANALYSIS OF COMMERCIAL DISPLAY MARKET FOR LCD, BY COUNTRY 2024 AND 2034(%)
FIGURE 18. COMPARATIVE SHARE ANALYSIS OF COMMERCIAL DISPLAY MARKET FOR OLED, BY COUNTRY 2024 AND 2034(%)
FIGURE 19. COMPARATIVE SHARE ANALYSIS OF COMMERCIAL DISPLAY MARKET FOR OTHERS, BY COUNTRY 2024 AND 2034(%)
FIGURE 20. COMMERCIAL DISPLAY MARKET, BY APPLICATION, 2024 AND 2034(%)
FIGURE 21. COMPARATIVE SHARE ANALYSIS OF COMMERCIAL DISPLAY MARKET FOR RETAIL, BY COUNTRY 2024 AND 2034(%)
FIGURE 22. COMPARATIVE SHARE ANALYSIS OF COMMERCIAL DISPLAY MARKET FOR TRANSPORTATION, BY COUNTRY 2024 AND 2034(%)
FIGURE 23. COMPARATIVE SHARE ANALYSIS OF COMMERCIAL DISPLAY MARKET FOR HOSPITALITY, BY COUNTRY 2024 AND 2034(%)
FIGURE 24. COMPARATIVE SHARE ANALYSIS OF COMMERCIAL DISPLAY MARKET FOR HEALTHCARE, BY COUNTRY 2024 AND 2034(%)
FIGURE 25. COMPARATIVE SHARE ANALYSIS OF COMMERCIAL DISPLAY MARKET FOR ENTERTAINMENT, BY COUNTRY 2024 AND 2034(%)
FIGURE 26. COMPARATIVE SHARE ANALYSIS OF COMMERCIAL DISPLAY MARKET FOR OTHERS, BY COUNTRY 2024 AND 2034(%)
FIGURE 27. COMMERCIAL DISPLAY MARKET BY REGION, 2024 AND 2034(%)
FIGURE 28. U.S. COMMERCIAL DISPLAY MARKET, 2024-2034 ($MILLION)
FIGURE 29. CANADA COMMERCIAL DISPLAY MARKET, 2024-2034 ($MILLION)
FIGURE 30. MEXICO COMMERCIAL DISPLAY MARKET, 2024-2034 ($MILLION)
FIGURE 31. UK COMMERCIAL DISPLAY MARKET, 2024-2034 ($MILLION)
FIGURE 32. GERMANY COMMERCIAL DISPLAY MARKET, 2024-2034 ($MILLION)
FIGURE 33. FRANCE COMMERCIAL DISPLAY MARKET, 2024-2034 ($MILLION)
FIGURE 34. ITALY COMMERCIAL DISPLAY MARKET, 2024-2034 ($MILLION)
FIGURE 35. REST OF EUROPE COMMERCIAL DISPLAY MARKET, 2024-2034 ($MILLION)
FIGURE 36. CHINA COMMERCIAL DISPLAY MARKET, 2024-2034 ($MILLION)
FIGURE 37. JAPAN COMMERCIAL DISPLAY MARKET, 2024-2034 ($MILLION)
FIGURE 38. INDIA COMMERCIAL DISPLAY MARKET, 2024-2034 ($MILLION)
FIGURE 39. SOUTH KOREA COMMERCIAL DISPLAY MARKET, 2024-2034 ($MILLION)
FIGURE 40. REST OF ASIA-PACIFIC COMMERCIAL DISPLAY MARKET, 2024-2034 ($MILLION)
FIGURE 41. LATIN AMERICA COMMERCIAL DISPLAY MARKET, 2024-2034 ($MILLION)
FIGURE 42. MIDDLE EAST COMMERCIAL DISPLAY MARKET, 2024-2034 ($MILLION)
FIGURE 43. AFRICA COMMERCIAL DISPLAY MARKET, 2024-2034 ($MILLION)
FIGURE 44. TOP WINNING STRATEGIES, BY YEAR (2023-2025)
FIGURE 45. TOP WINNING STRATEGIES, BY DEVELOPMENT (2023-2025)
FIGURE 46. TOP WINNING STRATEGIES, BY COMPANY (2023-2025)
FIGURE 47. PRODUCT MAPPING OF TOP 10 PLAYERS
FIGURE 48. COMPETITIVE DASHBOARD
FIGURE 49. COMPETITIVE HEATMAP: COMMERCIAL DISPLAY MARKET
FIGURE 50. TOP PLAYER POSITIONING, 2024
FIGURE 51. SAMSUNG ELECTRONICS: SALES REVENUE, 2022-2024 ($MILLION)
FIGURE 52. SAMSUNG ELECTRONICS: REVENUE SHARE BY REGION, 2024 (%)
FIGURE 53. SAMSUNG ELECTRONICS: REVENUE SHARE BY SEGMENT, 2022 (%)
FIGURE 54. CISCO SYSTEMS INC.: NET REVENUE, 2022-2024 ($MILLION)
FIGURE 55. CISCO SYSTEMS INC.: RESEARCH & DEVELOPMENT EXPENDITURE, 2022-2024 ($MILLION)
FIGURE 56. CISCO SYSTEMS INC.: REVENUE SHARE BY REGION, 2024 (%)
FIGURE 57. DELL INC.: NET REVENUE, 2022-2024 ($MILLION)
FIGURE 58. DELL INC.: RESEARCH & DEVELOPMENT EXPENDITURE, 2022-2024 ($MILLION)
FIGURE 59. DELL INC.: REVENUE SHARE BY SEGMENT, 2022 (%)
FIGURE 60. DELL INC.: REVENUE SHARE BY REGION, 2022 (%)
FIGURE 61. KONINKLIJKE PHILIPS N.V.: NET SALES, 2022-2024 ($MILLION)
FIGURE 62. KONINKLIJKE PHILIPS N.V.: REVENUE SHARE BY SEGMENT, 2024 (%)
FIGURE 63. KONINKLIJKE PHILIPS N.V.: REVENUE SHARE BY REGION, 2024 (%)
FIGURE 64. LG DISPLAY CO., LTD.: NET REVENUE, 2022-2024 ($MILLION)
FIGURE 65. LG DISPLAY CO., LTD.: RESEARCH & DEVELOPMENT EXPENDITURE, 2022-2024 ($MILLION)
FIGURE 66. LG DISPLAY CO., LTD.: REVENUE SHARE BY SEGMENT, 2024 (%)
FIGURE 67. LG DISPLAY CO., LTD.: REVENUE SHARE BY REGION, 2024 (%)
FIGURE 68. NEC CORPORATION: NET REVENUE, 2022-2024 ($MILLION)
FIGURE 69. NEC CORPORATION: RESEARCH & DEVELOPMENT EXPENDITURE, 2022-2024 ($MILLION)
FIGURE 70. NEC CORPORATION: REVENUE SHARE BY SEGMENT, 2023 (%)
FIGURE 71. PANASONIC HOLDINGS CORPORATION: NET REVENUE, 2022-2024 ($MILLION)
FIGURE 72. PANASONIC HOLDINGS CORPORATION: RESEARCH & DEVELOPMENT EXPENDITURE, 2022-2024 ($MILLION)
FIGURE 73. PANASONIC HOLDINGS CORPORATION: REVENUE SHARE BY SEGMENT, 2024 (%)
FIGURE 74. DAKTRONICS, INC.: NET SALES, 2022-2024 ($MILLION)
FIGURE 75. DAKTRONICS, INC.: REVENUE SHARE BY REGION, 2022 (%)
FIGURE 76. DAKTRONICS, INC.: REVENUE SHARE BY SEGMENT, 2022 (%)
FIGURE 77. SONY CORPORATION: NET SALES, 2022-2024 ($MILLION)
FIGURE 78. SONY CORPORATION: REVENUE SHARE BY REGION, 2024 (%)
FIGURE 79. SHARP ELECTRONICS CORPORATION: NET SALES, 2022-2024 ($MILLION)
FIGURE 80. SHARP ELECTRONICS CORPORATION: RESEARCH & DEVELOPMENT EXPENDITURE, 2022-2024 ($MILLION)
FIGURE 81. SHARP ELECTRONICS CORPORATION: REVENUE SHARE BY SEGMENT, 2024 (%)