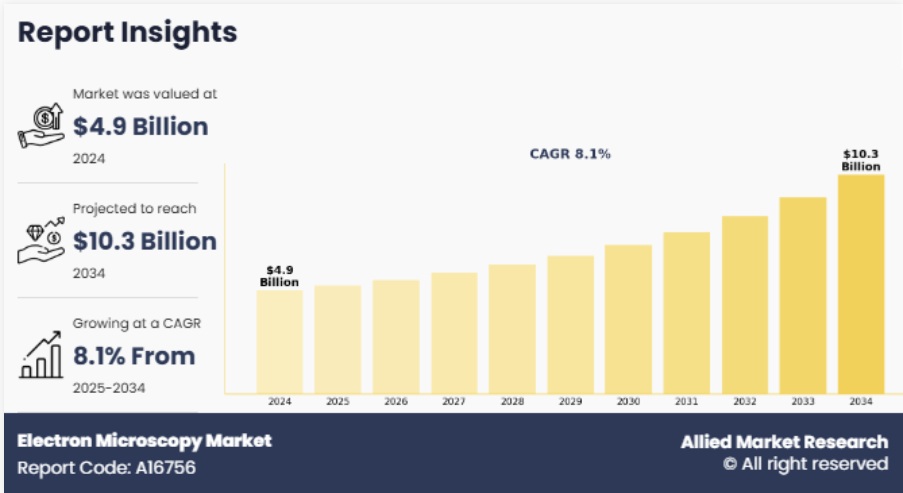
Electron Microscopy Market : Global Opportunity Analysis and Industry Forecast, 2025-2034
電子顕微鏡市場 - タイプ別(走査型電子顕微鏡(SEM)、透過型電子顕微鏡(TEM)、用途別(ライフサイエンス、材料科学、その他)、エンドユーザー別(ヘルスケア、研究機関、その他):機会分析と業界予測、2025年-2034年
Electron Microscopy Market By Type (Scanning Electron Microscope (SEM), Transmission Electron Microscope (TEM)), By Application (Life Sciences, Material Sciences, Other), By End User (Healthcare, Research Institute, Others): Global Opportunity Analysis and Industry Forecast, 2025-2034
| 出版 | Allied Market Research |
| 出版年月 | 2025年10月 |
| ページ数 | 300 |
| 価格 | 記載以外のライセンスについてはお問合せください |
| シングルユーザ | USD 4,155 |
| 種別 | 英文調査報告書 |
| 商品番号 | SMR-12029 |

電子顕微鏡とは、光の代わりに加速電子ビームを用いてナノスケールの試料の高解像度画像を取得する高度なイメージング技術を指します。この技術は、従来の光学顕微鏡と比較して、倍率、被写界深度、画像の鮮明さにおいて大きな利点を備えています。科学者や研究者は、光を用いた手法では観察不可能な生物学的、化学的、物質的試料の微細構造の詳細を可視化することができます。生命科学、材料科学、半導体、ナノテクノロジーなどの分野における高解像度イメージングの需要の高まりは、世界中で電子顕微鏡の採用を促進する大きな要因となっています。
市場は、世界中で大きな成長機会を生み出すいくつかの重要な要因によって牽引されています。ナノテクノロジー研究への投資の増加、半導体およびエレクトロニクス産業における材料特性評価の需要の高まり、そしてライフサイエンスおよび製薬分野におけるアプリケーションの拡大は、市場拡大の大きな要因です。さらに、製造プロセスにおける品質管理と故障解析の重要性の高まりも、電子顕微鏡の導入を加速させています。しかしながら、機器の高コスト、複雑なサンプル準備、熟練したオペレーターの必要性といった要因が、広範な導入への課題となっています。こうした制約にもかかわらず、自動化、人工知能、そして極低温電子顕微鏡(クライオEM)の継続的な進歩は、この分野に革命をもたらし、技術をよりアクセスしやすく、効率的にし、リアルタイムで超高解像度の結果を生み出す能力を高め、世界規模で市場成長の多くの機会を生み出すことが期待されています。
Report Description
Electron Microscopy refers to the advanced imaging technology that uses a beam of accelerated electrons instead of light to obtain high-resolution images of specimens at the nanoscale. This technology offers significant advantages in terms of magnification, depth of field, and image clarity compared to conventional optical microscopy. It enables scientists and researchers to visualize fine structural details of biological, chemical, and material samples, which are otherwise impossible to observe through light-based techniques. The growing demand for high-resolution imaging in sectors such as life sciences, materials science, semiconductors, and nanotechnology is a major factor driving the adoption of electron microscopy globally.
Electron Microscopy is an innovative and rapidly evolving field within the analytical instrumentation industry that integrates advanced imaging, spectroscopy, and computational analysis into a single, user-friendly platform. These microscopes primarily Scanning Electron Microscopes (SEM), Transmission Electron Microscopes (TEM), and Scanning Transmission Electron Microscopes (STEM) allow users to analyze surface structures, chemical compositions, and crystallographic information at atomic or near-atomic resolution. Modern electron microscopy systems often feature automated sample handling, digital image processing, and AI-assisted analytics to improve accuracy and efficiency. Moreover, integration with cloud-based data management and advanced visualization software enhances the overall research experience by enabling real-time collaboration and remote operation.
The market is driven by several key factors that create significant growth opportunities worldwide. Increasing investments in nanotechnology research, rising demand for material characterization in semiconductor and electronics industries, and expanding applications in life sciences and pharmaceuticals are major contributors to market expansion. Additionally, the growing emphasis on quality control and failure analysis in manufacturing processes has accelerated the adoption of electron microscopes. However, factors such as the high cost of equipment, complex sample preparation, and the need for skilled operators pose challenges to widespread adoption. Despite these restraints, ongoing advancements in automation, artificial intelligence, and cryogenic electron microscopy (cryo-EM) are expected to revolutionize the field, making the technology more accessible, efficient, and capable of producing real-time, ultra-high-resolution results thus creating numerous opportunities for market growth on a global scale.
The electron microscopy market is segmented into type, application, end-users and region. By type, the market is categorized into scanning electron microscope (SEM) and transmission electron microscope (TEM). On the basis of application, it is classified into life sciences, material sciences, and others. By end-user, it is categorized into healthcare, research institute, and others. Region wise, the market is analyzed across North America, Europe, Asia-Pacific, and LAMEA (Latin America, and the Middle East & Africa).
The key companies profiled in the research report include Bruker, Hitachi High-Tech Corporation, Oxford Instruments, JEOL Ltd, Advantest Corporation, Thermo Fisher Scientific, Inc.,Nikon Corporation, Delong Instruments, and ZEISS Group.
Key Benefits For Stakeholders
- This report provides a quantitative analysis of the market segments, current trends, estimations, and dynamics of the electron microscopy market analysis from 2024 to 2034 to identify the prevailing electron microscopy market opportunities.
- The market research is offered along with information related to key drivers, restraints, and opportunities.
- Porter’s five forces analysis highlights the potency of buyers and suppliers to enable stakeholders make profit-oriented business decisions and strengthen their supplier-buyer network.
- In-depth analysis of the electron microscopy market segmentation assists to determine the prevailing market opportunities.
- Major countries in each region are mapped according to their revenue contribution to the global market.
- Market player positioning facilitates benchmarking and provides a clear understanding of the present position of the market players.
- The report includes the analysis of the regional as well as global electron microscopy market trends, key players, market segments, application areas, and market growth strategies.
Additional benefits you will get with this purchase are:
- Quarterly Update and* (only available with a corporate license, on listed price)
- 5 additional Company Profile of client Choice pre- or Post-purchase, as a free update.
- Free Upcoming Version on the Purchase of Five and Enterprise User License.
- 16 analyst hours of support* (post-purchase, if you find additional data requirements upon review of the report, you may receive support amounting to 16 analyst hours to solve questions, and post-sale queries)
- 15% Free Customization* (in case the scope or segment of the report does not match your requirements, 15% is equivalent to 3 working days of free work, applicable once)
- Free data Pack on the Five and Enterprise User License. (Excel version of the report)
- Free Updated report if the report is 6-12 months old or older.
- 24-hour priority response*
- Free Industry updates and white papers.
Possible Customization with this report (with additional cost and timeline, please talk to the sales executive to know more)
- Product Life Cycles
- Pain Point Analysis
- Import Export Analysis/Data
Electron Microscopy Market Report Highlights
| Aspects | Details |
|
Market Size By 2034
|
USD 10.3 billion |
|
Growth Rate
|
CAGR of 8.1% |
|
Forecast period
|
2024 – 2034 |
|
Report Pages
|
300 |
|
By Type
|
|
|
By Application
|
|
|
By End User
|
|
|
By Region
|
|
|
Key Market Players
|
Oxford Instruments, JEOL Ltd., Bruker, Thermo Fisher Scientific, Inc., Advantest Corporation, ZEISS Group, Hitachi High-Tech Corporation, Delong Instruments, Nikon Corporation, Tescan Group a.s. |
Table of Content
CHAPTER 1: INTRODUCTION
1.1. Report description
1.2. Key market segments
1.3. Key benefits to the stakeholders
1.4. Research methodology
1.4.1. Primary research
1.4.2. Secondary research
1.4.3. Analyst tools and models
CHAPTER 2: EXECUTIVE SUMMARY
2.1. CXO perspective
CHAPTER 3: MARKET OVERVIEW
3.1. Market definition and scope
3.2. Key findings
3.2.1. Top impacting factors
3.2.2. Top investment pockets
3.3. Porter’s five forces analysis
3.3.1. Low bargaining power of suppliers
3.3.2. Low threat of new entrants
3.3.3. Low threat of substitutes
3.3.4. Low intensity of rivalry
3.3.5. Low bargaining power of buyers
3.4. Market dynamics
3.4.1. Drivers
3.4.1.1. Surge in Semiconductor, Battery and Materials R&D & Manufacturing
3.4.1.2. Automation, AI, and Usability Improvements Lowering the Technical Barrier
3.4.1.3. Rising Adoption of Advanced Life-Sciences & Structural Biology Applications
3.4.2. Restraints
3.4.2.1. High Capital Cost and Total Cost of Ownership
3.4.3. Opportunities
3.4.3.1. Expansion of Cryo-EM, Correlative & Multimodal Workflows
3.4.3.2. Growth of Service-Based and Tabletop Electron Microscopy Solutions
CHAPTER 4: ELECTRON MICROSCOPY MARKET, BY TYPE
4.1. Overview
4.1.1. Market size and forecast
4.2. Scanning Electron Microscope (SEM)
4.2.1. Key market trends, growth factors and opportunities
4.2.2. Market size and forecast, by region
4.2.3. Market share analysis by country
4.3. Transmission Electron Microscope (TEM)
4.3.1. Key market trends, growth factors and opportunities
4.3.2. Market size and forecast, by region
4.3.3. Market share analysis by country
CHAPTER 5: ELECTRON MICROSCOPY MARKET, BY APPLICATION
5.1. Overview
5.1.1. Market size and forecast
5.2. Life Sciences
5.2.1. Key market trends, growth factors and opportunities
5.2.2. Market size and forecast, by region
5.2.3. Market share analysis by country
5.3. Material Sciences
5.3.1. Key market trends, growth factors and opportunities
5.3.2. Market size and forecast, by region
5.3.3. Market share analysis by country
5.4. Other
5.4.1. Key market trends, growth factors and opportunities
5.4.2. Market size and forecast, by region
5.4.3. Market share analysis by country
CHAPTER 6: ELECTRON MICROSCOPY MARKET, BY END USER
6.1. Overview
6.1.1. Market size and forecast
6.2. Healthcare
6.2.1. Key market trends, growth factors and opportunities
6.2.2. Market size and forecast, by region
6.2.3. Market share analysis by country
6.3. Research Institute
6.3.1. Key market trends, growth factors and opportunities
6.3.2. Market size and forecast, by region
6.3.3. Market share analysis by country
6.4. Others
6.4.1. Key market trends, growth factors and opportunities
6.4.2. Market size and forecast, by region
6.4.3. Market share analysis by country
CHAPTER 7: ELECTRON MICROSCOPY MARKET, BY REGION
7.1. Overview
7.1.1. Market size and forecast By Region
7.2. North America
7.2.1. Key market trends, growth factors and opportunities
7.2.2. Market size and forecast, by Type
7.2.3. Market size and forecast, by Application
7.2.4. Market size and forecast, by End User
7.2.5. Market size and forecast, by country
7.2.5.1. U.S.
7.2.5.1.1. Market size and forecast, by Type
7.2.5.1.2. Market size and forecast, by Application
7.2.5.1.3. Market size and forecast, by End User
7.2.5.2. Canada
7.2.5.2.1. Market size and forecast, by Type
7.2.5.2.2. Market size and forecast, by Application
7.2.5.2.3. Market size and forecast, by End User
7.2.5.3. Mexico
7.2.5.3.1. Market size and forecast, by Type
7.2.5.3.2. Market size and forecast, by Application
7.2.5.3.3. Market size and forecast, by End User
7.3. Europe
7.3.1. Key market trends, growth factors and opportunities
7.3.2. Market size and forecast, by Type
7.3.3. Market size and forecast, by Application
7.3.4. Market size and forecast, by End User
7.3.5. Market size and forecast, by country
7.3.5.1. France
7.3.5.1.1. Market size and forecast, by Type
7.3.5.1.2. Market size and forecast, by Application
7.3.5.1.3. Market size and forecast, by End User
7.3.5.2. Germany
7.3.5.2.1. Market size and forecast, by Type
7.3.5.2.2. Market size and forecast, by Application
7.3.5.2.3. Market size and forecast, by End User
7.3.5.3. Italy
7.3.5.3.1. Market size and forecast, by Type
7.3.5.3.2. Market size and forecast, by Application
7.3.5.3.3. Market size and forecast, by End User
7.3.5.4. Spain
7.3.5.4.1. Market size and forecast, by Type
7.3.5.4.2. Market size and forecast, by Application
7.3.5.4.3. Market size and forecast, by End User
7.3.5.5. UK
7.3.5.5.1. Market size and forecast, by Type
7.3.5.5.2. Market size and forecast, by Application
7.3.5.5.3. Market size and forecast, by End User
7.3.5.6. Russia
7.3.5.6.1. Market size and forecast, by Type
7.3.5.6.2. Market size and forecast, by Application
7.3.5.6.3. Market size and forecast, by End User
7.3.5.7. Rest of Europe
7.3.5.7.1. Market size and forecast, by Type
7.3.5.7.2. Market size and forecast, by Application
7.3.5.7.3. Market size and forecast, by End User
7.4. Asia-Pacific
7.4.1. Key market trends, growth factors and opportunities
7.4.2. Market size and forecast, by Type
7.4.3. Market size and forecast, by Application
7.4.4. Market size and forecast, by End User
7.4.5. Market size and forecast, by country
7.4.5.1. China
7.4.5.1.1. Market size and forecast, by Type
7.4.5.1.2. Market size and forecast, by Application
7.4.5.1.3. Market size and forecast, by End User
7.4.5.2. Japan
7.4.5.2.1. Market size and forecast, by Type
7.4.5.2.2. Market size and forecast, by Application
7.4.5.2.3. Market size and forecast, by End User
7.4.5.3. India
7.4.5.3.1. Market size and forecast, by Type
7.4.5.3.2. Market size and forecast, by Application
7.4.5.3.3. Market size and forecast, by End User
7.4.5.4. South Korea
7.4.5.4.1. Market size and forecast, by Type
7.4.5.4.2. Market size and forecast, by Application
7.4.5.4.3. Market size and forecast, by End User
7.4.5.5. Australia
7.4.5.5.1. Market size and forecast, by Type
7.4.5.5.2. Market size and forecast, by Application
7.4.5.5.3. Market size and forecast, by End User
7.4.5.6. Thailand
7.4.5.6.1. Market size and forecast, by Type
7.4.5.6.2. Market size and forecast, by Application
7.4.5.6.3. Market size and forecast, by End User
7.4.5.7. Malaysia
7.4.5.7.1. Market size and forecast, by Type
7.4.5.7.2. Market size and forecast, by Application
7.4.5.7.3. Market size and forecast, by End User
7.4.5.8. Indonesia
7.4.5.8.1. Market size and forecast, by Type
7.4.5.8.2. Market size and forecast, by Application
7.4.5.8.3. Market size and forecast, by End User
7.4.5.9. Rest of Asia-Pacific
7.4.5.9.1. Market size and forecast, by Type
7.4.5.9.2. Market size and forecast, by Application
7.4.5.9.3. Market size and forecast, by End User
7.5. LAMEA
7.5.1. Key market trends, growth factors and opportunities
7.5.2. Market size and forecast, by Type
7.5.3. Market size and forecast, by Application
7.5.4. Market size and forecast, by End User
7.5.5. Market size and forecast, by country
7.5.5.1. Brazil
7.5.5.1.1. Market size and forecast, by Type
7.5.5.1.2. Market size and forecast, by Application
7.5.5.1.3. Market size and forecast, by End User
7.5.5.2. South Africa
7.5.5.2.1. Market size and forecast, by Type
7.5.5.2.2. Market size and forecast, by Application
7.5.5.2.3. Market size and forecast, by End User
7.5.5.3. Saudi Arabia
7.5.5.3.1. Market size and forecast, by Type
7.5.5.3.2. Market size and forecast, by Application
7.5.5.3.3. Market size and forecast, by End User
7.5.5.4. UAE
7.5.5.4.1. Market size and forecast, by Type
7.5.5.4.2. Market size and forecast, by Application
7.5.5.4.3. Market size and forecast, by End User
7.5.5.5. Argentina
7.5.5.5.1. Market size and forecast, by Type
7.5.5.5.2. Market size and forecast, by Application
7.5.5.5.3. Market size and forecast, by End User
7.5.5.6. Rest of LAMEA
7.5.5.6.1. Market size and forecast, by Type
7.5.5.6.2. Market size and forecast, by Application
7.5.5.6.3. Market size and forecast, by End User
CHAPTER 8: COMPETITIVE LANDSCAPE
8.1. Introduction
8.2. Top winning strategies
8.3. Product mapping of top 10 player
8.4. Competitive dashboard
8.5. Competitive heatmap
8.6. Top player positioning, 2024
CHAPTER 9: COMPANY PROFILES
9.1. Nikon Corporation
9.1.1. Company overview
9.1.2. Key executives
9.1.3. Company snapshot
9.1.4. Operating business segments
9.1.5. Product portfolio
9.1.6. Business performance
9.2. JEOL Ltd.
9.2.1. Company overview
9.2.2. Key executives
9.2.3. Company snapshot
9.2.4. Operating business segments
9.2.5. Product portfolio
9.2.6. Business performance
9.3. Tescan Group a.s.
9.3.1. Company overview
9.3.2. Key executives
9.3.3. Company snapshot
9.3.4. Operating business segments
9.3.5. Product portfolio
9.4. ZEISS Group
9.4.1. Company overview
9.4.2. Key executives
9.4.3. Company snapshot
9.4.4. Operating business segments
9.4.5. Product portfolio
9.4.6. Business performance
9.4.7. Key strategic moves and developments
9.5. Bruker
9.5.1. Company overview
9.5.2. Key executives
9.5.3. Company snapshot
9.5.4. Operating business segments
9.5.5. Product portfolio
9.5.6. Business performance
9.5.7. Key strategic moves and developments
9.6. Thermo Fisher Scientific, Inc.
9.6.1. Company overview
9.6.2. Key executives
9.6.3. Company snapshot
9.6.4. Operating business segments
9.6.5. Product portfolio
9.6.6. Business performance
9.6.7. Key strategic moves and developments
9.7. Hitachi High-Tech Corporation
9.7.1. Company overview
9.7.2. Key executives
9.7.3. Company snapshot
9.7.4. Operating business segments
9.7.5. Product portfolio
9.7.6. Business performance
9.7.7. Key strategic moves and developments
9.8. Advantest Corporation
9.8.1. Company overview
9.8.2. Key executives
9.8.3. Company snapshot
9.8.4. Operating business segments
9.8.5. Product portfolio
9.8.6. Business performance
9.8.7. Key strategic moves and developments
9.9. Oxford Instruments
9.9.1. Company overview
9.9.2. Key executives
9.9.3. Company snapshot
9.9.4. Operating business segments
9.9.5. Product portfolio
9.9.6. Business performance
9.10. Delong Instruments
9.10.1. Company overview
9.10.2. Key executives
9.10.3. Company snapshot
9.10.4. Operating business segments
9.10.5. Product portfolio
9.10.6. Key strategic moves and developments
LIST OF TABLES
TABLE 01. GLOBAL ELECTRON MICROSCOPY MARKET, BY TYPE, 2024-2034 ($MILLION)
TABLE 02. ELECTRON MICROSCOPY MARKET FOR SCANNING ELECTRON MICROSCOPE (SEM), BY REGION, 2024-2034 ($MILLION)
TABLE 03. ELECTRON MICROSCOPY MARKET FOR TRANSMISSION ELECTRON MICROSCOPE (TEM), BY REGION, 2024-2034 ($MILLION)
TABLE 04. GLOBAL ELECTRON MICROSCOPY MARKET, BY APPLICATION, 2024-2034 ($MILLION)
TABLE 05. ELECTRON MICROSCOPY MARKET FOR LIFE SCIENCES, BY REGION, 2024-2034 ($MILLION)
TABLE 06. ELECTRON MICROSCOPY MARKET FOR MATERIAL SCIENCES, BY REGION, 2024-2034 ($MILLION)
TABLE 07. ELECTRON MICROSCOPY MARKET FOR OTHER, BY REGION, 2024-2034 ($MILLION)
TABLE 08. GLOBAL ELECTRON MICROSCOPY MARKET, BY END USER, 2024-2034 ($MILLION)
TABLE 09. ELECTRON MICROSCOPY MARKET FOR HEALTHCARE, BY REGION, 2024-2034 ($MILLION)
TABLE 10. ELECTRON MICROSCOPY MARKET FOR RESEARCH INSTITUTE, BY REGION, 2024-2034 ($MILLION)
TABLE 11. ELECTRON MICROSCOPY MARKET FOR OTHERS, BY REGION, 2024-2034 ($MILLION)
TABLE 12. ELECTRON MICROSCOPY MARKET, BY REGION, 2024-2034 ($MILLION)
TABLE 13. NORTH AMERICA ELECTRON MICROSCOPY MARKET, BY TYPE, 2024-2034 ($MILLION)
TABLE 14. NORTH AMERICA ELECTRON MICROSCOPY MARKET, BY APPLICATION, 2024-2034 ($MILLION)
TABLE 15. NORTH AMERICA ELECTRON MICROSCOPY MARKET, BY END USER, 2024-2034 ($MILLION)
TABLE 16. NORTH AMERICA ELECTRON MICROSCOPY MARKET, BY COUNTRY, 2024-2034 ($MILLION)
TABLE 17. U.S. ELECTRON MICROSCOPY MARKET, BY TYPE, 2024-2034 ($MILLION)
TABLE 18. U.S. ELECTRON MICROSCOPY MARKET, BY APPLICATION, 2024-2034 ($MILLION)
TABLE 19. U.S. ELECTRON MICROSCOPY MARKET, BY END USER, 2024-2034 ($MILLION)
TABLE 20. CANADA ELECTRON MICROSCOPY MARKET, BY TYPE, 2024-2034 ($MILLION)
TABLE 21. CANADA ELECTRON MICROSCOPY MARKET, BY APPLICATION, 2024-2034 ($MILLION)
TABLE 22. CANADA ELECTRON MICROSCOPY MARKET, BY END USER, 2024-2034 ($MILLION)
TABLE 23. MEXICO ELECTRON MICROSCOPY MARKET, BY TYPE, 2024-2034 ($MILLION)
TABLE 24. MEXICO ELECTRON MICROSCOPY MARKET, BY APPLICATION, 2024-2034 ($MILLION)
TABLE 25. MEXICO ELECTRON MICROSCOPY MARKET, BY END USER, 2024-2034 ($MILLION)
TABLE 26. EUROPE ELECTRON MICROSCOPY MARKET, BY TYPE, 2024-2034 ($MILLION)
TABLE 27. EUROPE ELECTRON MICROSCOPY MARKET, BY APPLICATION, 2024-2034 ($MILLION)
TABLE 28. EUROPE ELECTRON MICROSCOPY MARKET, BY END USER, 2024-2034 ($MILLION)
TABLE 29. EUROPE ELECTRON MICROSCOPY MARKET, BY COUNTRY, 2024-2034 ($MILLION)
TABLE 30. FRANCE ELECTRON MICROSCOPY MARKET, BY TYPE, 2024-2034 ($MILLION)
TABLE 31. FRANCE ELECTRON MICROSCOPY MARKET, BY APPLICATION, 2024-2034 ($MILLION)
TABLE 32. FRANCE ELECTRON MICROSCOPY MARKET, BY END USER, 2024-2034 ($MILLION)
TABLE 33. GERMANY ELECTRON MICROSCOPY MARKET, BY TYPE, 2024-2034 ($MILLION)
TABLE 34. GERMANY ELECTRON MICROSCOPY MARKET, BY APPLICATION, 2024-2034 ($MILLION)
TABLE 35. GERMANY ELECTRON MICROSCOPY MARKET, BY END USER, 2024-2034 ($MILLION)
TABLE 36. ITALY ELECTRON MICROSCOPY MARKET, BY TYPE, 2024-2034 ($MILLION)
TABLE 37. ITALY ELECTRON MICROSCOPY MARKET, BY APPLICATION, 2024-2034 ($MILLION)
TABLE 38. ITALY ELECTRON MICROSCOPY MARKET, BY END USER, 2024-2034 ($MILLION)
TABLE 39. SPAIN ELECTRON MICROSCOPY MARKET, BY TYPE, 2024-2034 ($MILLION)
TABLE 40. SPAIN ELECTRON MICROSCOPY MARKET, BY APPLICATION, 2024-2034 ($MILLION)
TABLE 41. SPAIN ELECTRON MICROSCOPY MARKET, BY END USER, 2024-2034 ($MILLION)
TABLE 42. UK ELECTRON MICROSCOPY MARKET, BY TYPE, 2024-2034 ($MILLION)
TABLE 43. UK ELECTRON MICROSCOPY MARKET, BY APPLICATION, 2024-2034 ($MILLION)
TABLE 44. UK ELECTRON MICROSCOPY MARKET, BY END USER, 2024-2034 ($MILLION)
TABLE 45. RUSSIA ELECTRON MICROSCOPY MARKET, BY TYPE, 2024-2034 ($MILLION)
TABLE 46. RUSSIA ELECTRON MICROSCOPY MARKET, BY APPLICATION, 2024-2034 ($MILLION)
TABLE 47. RUSSIA ELECTRON MICROSCOPY MARKET, BY END USER, 2024-2034 ($MILLION)
TABLE 48. REST OF EUROPE ELECTRON MICROSCOPY MARKET, BY TYPE, 2024-2034 ($MILLION)
TABLE 49. REST OF EUROPE ELECTRON MICROSCOPY MARKET, BY APPLICATION, 2024-2034 ($MILLION)
TABLE 50. REST OF EUROPE ELECTRON MICROSCOPY MARKET, BY END USER, 2024-2034 ($MILLION)
TABLE 51. ASIA-PACIFIC ELECTRON MICROSCOPY MARKET, BY TYPE, 2024-2034 ($MILLION)
TABLE 52. ASIA-PACIFIC ELECTRON MICROSCOPY MARKET, BY APPLICATION, 2024-2034 ($MILLION)
TABLE 53. ASIA-PACIFIC ELECTRON MICROSCOPY MARKET, BY END USER, 2024-2034 ($MILLION)
TABLE 54. ASIA-PACIFIC ELECTRON MICROSCOPY MARKET, BY COUNTRY, 2024-2034 ($MILLION)
TABLE 55. CHINA ELECTRON MICROSCOPY MARKET, BY TYPE, 2024-2034 ($MILLION)
TABLE 56. CHINA ELECTRON MICROSCOPY MARKET, BY APPLICATION, 2024-2034 ($MILLION)
TABLE 57. CHINA ELECTRON MICROSCOPY MARKET, BY END USER, 2024-2034 ($MILLION)
TABLE 58. JAPAN ELECTRON MICROSCOPY MARKET, BY TYPE, 2024-2034 ($MILLION)
TABLE 59. JAPAN ELECTRON MICROSCOPY MARKET, BY APPLICATION, 2024-2034 ($MILLION)
TABLE 60. JAPAN ELECTRON MICROSCOPY MARKET, BY END USER, 2024-2034 ($MILLION)
TABLE 61. INDIA ELECTRON MICROSCOPY MARKET, BY TYPE, 2024-2034 ($MILLION)
TABLE 62. INDIA ELECTRON MICROSCOPY MARKET, BY APPLICATION, 2024-2034 ($MILLION)
TABLE 63. INDIA ELECTRON MICROSCOPY MARKET, BY END USER, 2024-2034 ($MILLION)
TABLE 64. SOUTH KOREA ELECTRON MICROSCOPY MARKET, BY TYPE, 2024-2034 ($MILLION)
TABLE 65. SOUTH KOREA ELECTRON MICROSCOPY MARKET, BY APPLICATION, 2024-2034 ($MILLION)
TABLE 66. SOUTH KOREA ELECTRON MICROSCOPY MARKET, BY END USER, 2024-2034 ($MILLION)
TABLE 67. AUSTRALIA ELECTRON MICROSCOPY MARKET, BY TYPE, 2024-2034 ($MILLION)
TABLE 68. AUSTRALIA ELECTRON MICROSCOPY MARKET, BY APPLICATION, 2024-2034 ($MILLION)
TABLE 69. AUSTRALIA ELECTRON MICROSCOPY MARKET, BY END USER, 2024-2034 ($MILLION)
TABLE 70. THAILAND ELECTRON MICROSCOPY MARKET, BY TYPE, 2024-2034 ($MILLION)
TABLE 71. THAILAND ELECTRON MICROSCOPY MARKET, BY APPLICATION, 2024-2034 ($MILLION)
TABLE 72. THAILAND ELECTRON MICROSCOPY MARKET, BY END USER, 2024-2034 ($MILLION)
TABLE 73. MALAYSIA ELECTRON MICROSCOPY MARKET, BY TYPE, 2024-2034 ($MILLION)
TABLE 74. MALAYSIA ELECTRON MICROSCOPY MARKET, BY APPLICATION, 2024-2034 ($MILLION)
TABLE 75. MALAYSIA ELECTRON MICROSCOPY MARKET, BY END USER, 2024-2034 ($MILLION)
TABLE 76. INDONESIA ELECTRON MICROSCOPY MARKET, BY TYPE, 2024-2034 ($MILLION)
TABLE 77. INDONESIA ELECTRON MICROSCOPY MARKET, BY APPLICATION, 2024-2034 ($MILLION)
TABLE 78. INDONESIA ELECTRON MICROSCOPY MARKET, BY END USER, 2024-2034 ($MILLION)
TABLE 79. REST OF ASIA-PACIFIC ELECTRON MICROSCOPY MARKET, BY TYPE, 2024-2034 ($MILLION)
TABLE 80. REST OF ASIA-PACIFIC ELECTRON MICROSCOPY MARKET, BY APPLICATION, 2024-2034 ($MILLION)
TABLE 81. REST OF ASIA-PACIFIC ELECTRON MICROSCOPY MARKET, BY END USER, 2024-2034 ($MILLION)
TABLE 82. LAMEA ELECTRON MICROSCOPY MARKET, BY TYPE, 2024-2034 ($MILLION)
TABLE 83. LAMEA ELECTRON MICROSCOPY MARKET, BY APPLICATION, 2024-2034 ($MILLION)
TABLE 84. LAMEA ELECTRON MICROSCOPY MARKET, BY END USER, 2024-2034 ($MILLION)
TABLE 85. LAMEA ELECTRON MICROSCOPY MARKET, BY COUNTRY, 2024-2034 ($MILLION)
TABLE 86. BRAZIL ELECTRON MICROSCOPY MARKET, BY TYPE, 2024-2034 ($MILLION)
TABLE 87. BRAZIL ELECTRON MICROSCOPY MARKET, BY APPLICATION, 2024-2034 ($MILLION)
TABLE 88. BRAZIL ELECTRON MICROSCOPY MARKET, BY END USER, 2024-2034 ($MILLION)
TABLE 89. SOUTH AFRICA ELECTRON MICROSCOPY MARKET, BY TYPE, 2024-2034 ($MILLION)
TABLE 90. SOUTH AFRICA ELECTRON MICROSCOPY MARKET, BY APPLICATION, 2024-2034 ($MILLION)
TABLE 91. SOUTH AFRICA ELECTRON MICROSCOPY MARKET, BY END USER, 2024-2034 ($MILLION)
TABLE 92. SAUDI ARABIA ELECTRON MICROSCOPY MARKET, BY TYPE, 2024-2034 ($MILLION)
TABLE 93. SAUDI ARABIA ELECTRON MICROSCOPY MARKET, BY APPLICATION, 2024-2034 ($MILLION)
TABLE 94. SAUDI ARABIA ELECTRON MICROSCOPY MARKET, BY END USER, 2024-2034 ($MILLION)
TABLE 95. UAE ELECTRON MICROSCOPY MARKET, BY TYPE, 2024-2034 ($MILLION)
TABLE 96. UAE ELECTRON MICROSCOPY MARKET, BY APPLICATION, 2024-2034 ($MILLION)
TABLE 97. UAE ELECTRON MICROSCOPY MARKET, BY END USER, 2024-2034 ($MILLION)
TABLE 98. ARGENTINA ELECTRON MICROSCOPY MARKET, BY TYPE, 2024-2034 ($MILLION)
TABLE 99. ARGENTINA ELECTRON MICROSCOPY MARKET, BY APPLICATION, 2024-2034 ($MILLION)
TABLE 100. ARGENTINA ELECTRON MICROSCOPY MARKET, BY END USER, 2024-2034 ($MILLION)
TABLE 101. REST OF LAMEA ELECTRON MICROSCOPY MARKET, BY TYPE, 2024-2034 ($MILLION)
TABLE 102. REST OF LAMEA ELECTRON MICROSCOPY MARKET, BY APPLICATION, 2024-2034 ($MILLION)
TABLE 103. REST OF LAMEA ELECTRON MICROSCOPY MARKET, BY END USER, 2024-2034 ($MILLION)
TABLE 104. NIKON CORPORATION: KEY EXECUTIVES
TABLE 105. NIKON CORPORATION: COMPANY SNAPSHOT
TABLE 106. NIKON CORPORATION: PRODUCT SEGMENTS
TABLE 107. NIKON CORPORATION: PRODUCT PORTFOLIO
TABLE 108. JEOL LTD.: KEY EXECUTIVES
TABLE 109. JEOL LTD.: COMPANY SNAPSHOT
TABLE 110. JEOL LTD.: PRODUCT SEGMENTS
TABLE 111. JEOL LTD.: PRODUCT PORTFOLIO
TABLE 112. TESCAN GROUP A.S.: KEY EXECUTIVES
TABLE 113. TESCAN GROUP A.S.: COMPANY SNAPSHOT
TABLE 114. TESCAN GROUP A.S.: PRODUCT SEGMENTS
TABLE 115. TESCAN GROUP A.S.: PRODUCT PORTFOLIO
TABLE 116. ZEISS GROUP: KEY EXECUTIVES
TABLE 117. ZEISS GROUP: COMPANY SNAPSHOT
TABLE 118. ZEISS GROUP: PRODUCT SEGMENTS
TABLE 119. ZEISS GROUP: PRODUCT PORTFOLIO
TABLE 120. ZEISS GROUP: KEY STRATERGIES
TABLE 121. BRUKER: KEY EXECUTIVES
TABLE 122. BRUKER: COMPANY SNAPSHOT
TABLE 123. BRUKER: PRODUCT SEGMENTS
TABLE 124. BRUKER: PRODUCT PORTFOLIO
TABLE 125. BRUKER: KEY STRATERGIES
TABLE 126. THERMO FISHER SCIENTIFIC, INC.: KEY EXECUTIVES
TABLE 127. THERMO FISHER SCIENTIFIC, INC.: COMPANY SNAPSHOT
TABLE 128. THERMO FISHER SCIENTIFIC, INC.: PRODUCT SEGMENTS
TABLE 129. THERMO FISHER SCIENTIFIC, INC.: PRODUCT PORTFOLIO
TABLE 130. THERMO FISHER SCIENTIFIC, INC.: KEY STRATERGIES
TABLE 131. HITACHI HIGH-TECH CORPORATION: KEY EXECUTIVES
TABLE 132. HITACHI HIGH-TECH CORPORATION: COMPANY SNAPSHOT
TABLE 133. HITACHI HIGH-TECH CORPORATION: PRODUCT SEGMENTS
TABLE 134. HITACHI HIGH-TECH CORPORATION: PRODUCT PORTFOLIO
TABLE 135. HITACHI HIGH-TECH CORPORATION: KEY STRATERGIES
TABLE 136. ADVANTEST CORPORATION: KEY EXECUTIVES
TABLE 137. ADVANTEST CORPORATION: COMPANY SNAPSHOT
TABLE 138. ADVANTEST CORPORATION: PRODUCT SEGMENTS
TABLE 139. ADVANTEST CORPORATION: PRODUCT PORTFOLIO
TABLE 140. ADVANTEST CORPORATION: KEY STRATERGIES
TABLE 141. OXFORD INSTRUMENTS: KEY EXECUTIVES
TABLE 142. OXFORD INSTRUMENTS: COMPANY SNAPSHOT
TABLE 143. OXFORD INSTRUMENTS: PRODUCT SEGMENTS
TABLE 144. OXFORD INSTRUMENTS: PRODUCT PORTFOLIO
TABLE 145. DELONG INSTRUMENTS: KEY EXECUTIVES
TABLE 146. DELONG INSTRUMENTS: COMPANY SNAPSHOT
TABLE 147. DELONG INSTRUMENTS: PRODUCT SEGMENTS
TABLE 148. DELONG INSTRUMENTS: PRODUCT PORTFOLIO
TABLE 149. DELONG INSTRUMENTS: KEY STRATERGIES
LIST OF FIGURES
FIGURE 01. ELECTRON MICROSCOPY MARKET, 2024-2034
FIGURE 02. SEGMENTATION OF ELECTRON MICROSCOPY MARKET,2024-2034
FIGURE 03. TOP IMPACTING FACTORS IN ELECTRON MICROSCOPY MARKET (2024 TO 2034)
FIGURE 04. TOP INVESTMENT POCKETS IN ELECTRON MICROSCOPY MARKET (2025-2034)
FIGURE 05. LOW BARGAINING POWER OF SUPPLIERS
FIGURE 06. LOW THREAT OF NEW ENTRANTS
FIGURE 07. LOW THREAT OF SUBSTITUTES
FIGURE 08. LOW INTENSITY OF RIVALRY
FIGURE 09. LOW BARGAINING POWER OF BUYERS
FIGURE 10. GLOBAL ELECTRON MICROSCOPY MARKET:DRIVERS, RESTRAINTS AND OPPORTUNITIES
FIGURE 11. ELECTRON MICROSCOPY MARKET, BY TYPE, 2024 AND 2034(%)
FIGURE 12. COMPARATIVE SHARE ANALYSIS OF ELECTRON MICROSCOPY MARKET FOR SCANNING ELECTRON MICROSCOPE (SEM), BY COUNTRY 2024 AND 2034(%)
FIGURE 13. COMPARATIVE SHARE ANALYSIS OF ELECTRON MICROSCOPY MARKET FOR TRANSMISSION ELECTRON MICROSCOPE (TEM), BY COUNTRY 2024 AND 2034(%)
FIGURE 14. ELECTRON MICROSCOPY MARKET, BY APPLICATION, 2024 AND 2034(%)
FIGURE 15. COMPARATIVE SHARE ANALYSIS OF ELECTRON MICROSCOPY MARKET FOR LIFE SCIENCES, BY COUNTRY 2024 AND 2034(%)
FIGURE 16. COMPARATIVE SHARE ANALYSIS OF ELECTRON MICROSCOPY MARKET FOR MATERIAL SCIENCES, BY COUNTRY 2024 AND 2034(%)
FIGURE 17. COMPARATIVE SHARE ANALYSIS OF ELECTRON MICROSCOPY MARKET FOR OTHER, BY COUNTRY 2024 AND 2034(%)
FIGURE 18. ELECTRON MICROSCOPY MARKET, BY END USER, 2024 AND 2034(%)
FIGURE 19. COMPARATIVE SHARE ANALYSIS OF ELECTRON MICROSCOPY MARKET FOR HEALTHCARE, BY COUNTRY 2024 AND 2034(%)
FIGURE 20. COMPARATIVE SHARE ANALYSIS OF ELECTRON MICROSCOPY MARKET FOR RESEARCH INSTITUTE, BY COUNTRY 2024 AND 2034(%)
FIGURE 21. COMPARATIVE SHARE ANALYSIS OF ELECTRON MICROSCOPY MARKET FOR OTHERS, BY COUNTRY 2024 AND 2034(%)
FIGURE 22. ELECTRON MICROSCOPY MARKET BY REGION, 2024 AND 2034(%)
FIGURE 23. U.S. ELECTRON MICROSCOPY MARKET, 2024-2034 ($MILLION)
FIGURE 24. CANADA ELECTRON MICROSCOPY MARKET, 2024-2034 ($MILLION)
FIGURE 25. MEXICO ELECTRON MICROSCOPY MARKET, 2024-2034 ($MILLION)
FIGURE 26. FRANCE ELECTRON MICROSCOPY MARKET, 2024-2034 ($MILLION)
FIGURE 27. GERMANY ELECTRON MICROSCOPY MARKET, 2024-2034 ($MILLION)
FIGURE 28. ITALY ELECTRON MICROSCOPY MARKET, 2024-2034 ($MILLION)
FIGURE 29. SPAIN ELECTRON MICROSCOPY MARKET, 2024-2034 ($MILLION)
FIGURE 30. UK ELECTRON MICROSCOPY MARKET, 2024-2034 ($MILLION)
FIGURE 31. RUSSIA ELECTRON MICROSCOPY MARKET, 2024-2034 ($MILLION)
FIGURE 32. REST OF EUROPE ELECTRON MICROSCOPY MARKET, 2024-2034 ($MILLION)
FIGURE 33. CHINA ELECTRON MICROSCOPY MARKET, 2024-2034 ($MILLION)
FIGURE 34. JAPAN ELECTRON MICROSCOPY MARKET, 2024-2034 ($MILLION)
FIGURE 35. INDIA ELECTRON MICROSCOPY MARKET, 2024-2034 ($MILLION)
FIGURE 36. SOUTH KOREA ELECTRON MICROSCOPY MARKET, 2024-2034 ($MILLION)
FIGURE 37. AUSTRALIA ELECTRON MICROSCOPY MARKET, 2024-2034 ($MILLION)
FIGURE 38. THAILAND ELECTRON MICROSCOPY MARKET, 2024-2034 ($MILLION)
FIGURE 39. MALAYSIA ELECTRON MICROSCOPY MARKET, 2024-2034 ($MILLION)
FIGURE 40. INDONESIA ELECTRON MICROSCOPY MARKET, 2024-2034 ($MILLION)
FIGURE 41. REST OF ASIA-PACIFIC ELECTRON MICROSCOPY MARKET, 2024-2034 ($MILLION)
FIGURE 42. BRAZIL ELECTRON MICROSCOPY MARKET, 2024-2034 ($MILLION)
FIGURE 43. SOUTH AFRICA ELECTRON MICROSCOPY MARKET, 2024-2034 ($MILLION)
FIGURE 44. SAUDI ARABIA ELECTRON MICROSCOPY MARKET, 2024-2034 ($MILLION)
FIGURE 45. UAE ELECTRON MICROSCOPY MARKET, 2024-2034 ($MILLION)
FIGURE 46. ARGENTINA ELECTRON MICROSCOPY MARKET, 2024-2034 ($MILLION)
FIGURE 47. REST OF LAMEA ELECTRON MICROSCOPY MARKET, 2024-2034 ($MILLION)
FIGURE 48. TOP WINNING STRATEGIES, BY YEAR (2023-2025)
FIGURE 49. TOP WINNING STRATEGIES, BY DEVELOPMENT (2023-2025)
FIGURE 50. TOP WINNING STRATEGIES, BY COMPANY (2023-2025)
FIGURE 51. PRODUCT MAPPING OF TOP 10 PLAYERS
FIGURE 52. COMPETITIVE DASHBOARD
FIGURE 53. COMPETITIVE HEATMAP: ELECTRON MICROSCOPY MARKET
FIGURE 54. TOP PLAYER POSITIONING, 2024
FIGURE 55. NIKON CORPORATION: NET SALES, 2022-2024 ($MILLION)
FIGURE 56. NIKON CORPORATION: RESEARCH & DEVELOPMENT EXPENDITURE, 2022-2024 ($MILLION)
FIGURE 57. NIKON CORPORATION: REVENUE SHARE BY SEGMENT, 2024 (%)
FIGURE 58. NIKON CORPORATION: REVENUE SHARE BY REGION, 2024 (%)
FIGURE 59. JEOL LTD.: NET SALES, 2022-2024 ($MILLION)
FIGURE 60. JEOL LTD.: REVENUE SHARE BY SEGMENT, 2024 (%)
FIGURE 61. JEOL LTD.: REVENUE SHARE BY REGION, 2024 (%)
FIGURE 62. ZEISS GROUP: NET SALES, 2022-2024 ($MILLION)
FIGURE 63. ZEISS GROUP: RESEARCH & DEVELOPMENT EXPENDITURE, 2022-2024 ($MILLION)
FIGURE 64. ZEISS GROUP: REVENUE SHARE BY REGION, 2024 (%)
FIGURE 65. ZEISS GROUP: REVENUE SHARE BY SEGMENT, 2024 (%)
FIGURE 66. BRUKER: NET REVENUE, 2022-2024 ($MILLION)
FIGURE 67. BRUKER: RESEARCH & DEVELOPMENT EXPENDITURE, 2022-2024 ($MILLION)
FIGURE 68. BRUKER: REVENUE SHARE BY SEGMENT, 2024 (%)
FIGURE 69. BRUKER: REVENUE SHARE BY REGION, 2024 (%)
FIGURE 70. THERMO FISHER SCIENTIFIC, INC.: NET REVENUE, 2022-2024 ($MILLION)
FIGURE 71. THERMO FISHER SCIENTIFIC, INC.: RESEARCH & DEVELOPMENT EXPENDITURE, 2022-2024 ($MILLION)
FIGURE 72. THERMO FISHER SCIENTIFIC, INC.: REVENUE SHARE BY SEGMENT, 2024 (%)
FIGURE 73. THERMO FISHER SCIENTIFIC, INC.: REVENUE SHARE BY REGION, 2021 (%)
FIGURE 74. HITACHI HIGH-TECH CORPORATION: NET SALES, 2022-2024 ($MILLION)
FIGURE 75. HITACHI HIGH-TECH CORPORATION: REVENUE SHARE BY REGION, 2024 (%)
FIGURE 76. HITACHI HIGH-TECH CORPORATION: REVENUE SHARE BY SEGMENT, 2024 (%)
FIGURE 77. ADVANTEST CORPORATION: NET SALES, 2022-2024 ($MILLION)
FIGURE 78. ADVANTEST CORPORATION: REVENUE SHARE BY SEGMENT, 2024 (%)
FIGURE 79. ADVANTEST CORPORATION: REVENUE SHARE BY REGION, 2024 (%)
FIGURE 80. OXFORD INSTRUMENTS: NET SALES, 2022-2024 ($MILLION)
FIGURE 81. OXFORD INSTRUMENTS: REVENUE SHARE BY SEGMENT, 2024 (%)
FIGURE 82. OXFORD INSTRUMENTS: REVENUE SHARE BY REGION, 2024 (%)