Electric Scooters Market Size, Share & Trends Analysis Report
電動スクーター市場 - 駆動方式、バッテリー別、製品別(折りたたみ式、セルフバランス式、マキシ、三輪車)、バッテリー取り付け方法別(取り外し式、固定式)、最終用途別、地域、セグメント別予測による市場規模、成長と動向分析レポート 2026-2033年
Electric Scooters Market Size, Share & Trends Analysis Report By Drive, By Battery, By Product (Folding, Self-balancing, Maxi, Three-wheeled), By Battery Fitting (Detachable, Fixed), By End-use, By Region, And Segment Forecasts, 2025 - 2033
| 出版 | Grand View Research |
| 出版年月 | 2025年12月 |
| ページ数 | 130 |
| 価格 | 記載以外のライセンスについてはお問合せください |
| シングルユーザ | USD 4,950 |
| 種別 | 英文調査報告書 |
| 商品番号 | SMR-11831 |

世界の電動スクーター市場規模は、2024年には417億8,000万米ドルに達すると推定され、2025年から2033年にかけて年平均成長率9.6%で成長し、2033年には989億6,000万米ドルに達すると予測されています。燃費の良い自動車の需要の増加と、温室効果ガスおよび炭素排出に対する懸念の高まりが相まって、予測期間中に電動スクーター(eスクーター)の普及が促進されると予想されます。
米国環境保護庁(EPA)の温室効果ガス(GHG)排出基準、インドのBS-VI、中国のVIなど、政府機関による厳格な排出基準が電動スクーター市場を牽引しています。 さらに、電動スクーターは従来のスクーターに比べて機械効率が高く、静音性に優れ、メンテナンスの手間も少ないため、市場で消費者の支持を集めています。さらに、シェアリングモビリティや車両レンタルのエコシステムへの電動スクーターの導入も、電動スクーター業界の需要を押し上げています。
このレポートは、世界、地域、国レベルでの収益成長を予測し、2021年から2033年までの各サブセグメントにおける最新の業界動向の分析を提供します。この調査では、Grand View Researchが世界の電動スクーター市場レポートを、駆動、バッテリー、製品、バッテリーフィッティング、最終用途、地域に基づいてセグメント化しました。
Electric Scooters Market Summary
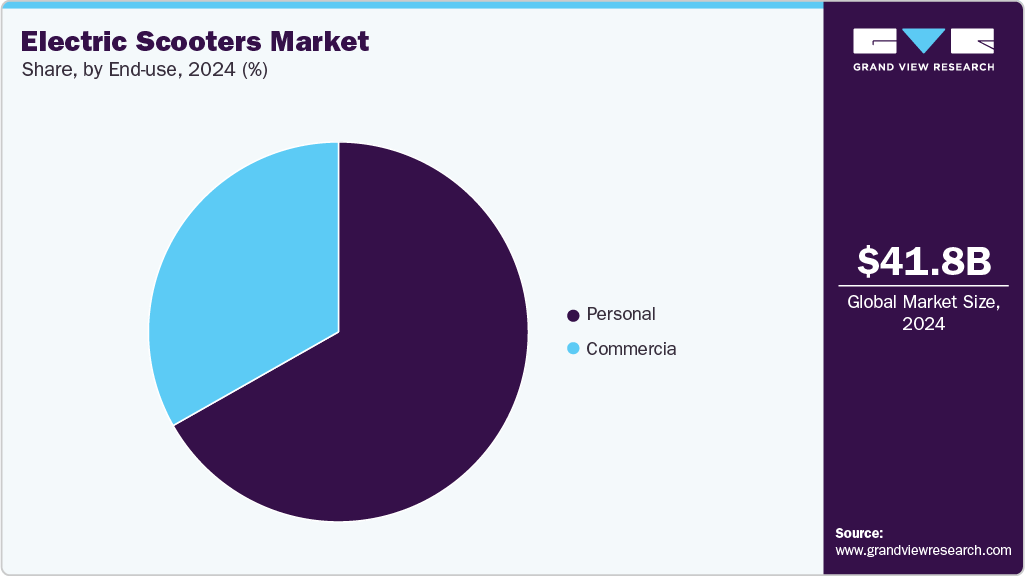
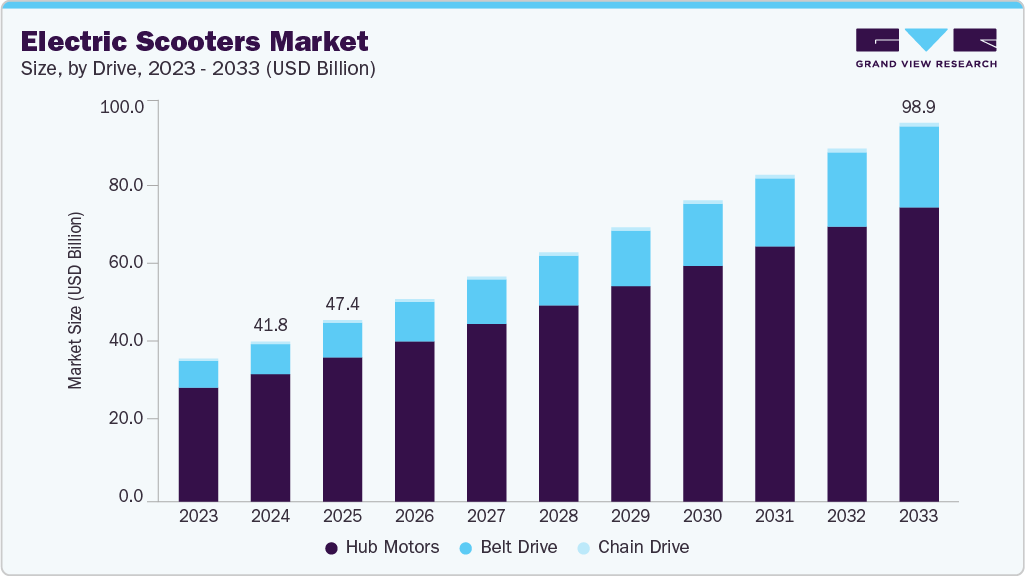
The global electric scooters market size was estimated at USD 41.78 billion in 2024, and is projected to reach USD 98.96 billion by 2033, growing at a CAGR of 9.6% from 2025 to 2033. The increasing demand for fuel-efficient vehicles, coupled with growing concerns over greenhouse gas and carbon emissions, is anticipated to drive the adoption of electric scooters (e-scooters) over the forecast period.
electric-scooters-market-size
Stringent emission norms by the government agencies, such as emission standards for greenhouse gas (GHG) emissions by the U.S. Environmental Protection Agency (EPA), BS-VI in India, and China VI, are driving the market for electric scooters.
Besides, the electric scooters have high mechanical efficiency, offer quieter operations, and require low maintenance over the conventional counterparts; thus, electric scooters are gaining consumer traction in the market. In addition, the inclusion of electric scooter fleets in shared mobility and vehicle renting ecosystems is propelling the demand for the electric scooters industry.
The COVID-19 pandemic has led to a global economic slowdown. Lockdown implementations in various parts of the world aimed to curb the spread of the virus led to supply chain disruptions and a temporary halt in manufacturing activities. The electric scooters became particularly vulnerable due to their dependency on global sourcing for the materials and components of their batteries. In addition, the initial purchase cost of electric vehicles is more significant than their gas-powered and hybrid counterparts, which further impacts the growth of electric scooters in the emerging economies of the world. However, post-pandemic, increasing government initiatives, such as tax rebates and policy changes, have resulted in a surge in demand for electric scooters.
Electric Scooters Market Report Scope
| Report Attribute | Details |
| Market size value in 2025 | USD 47.42 billion |
| Revenue forecast in 2033 | USD 98.96 billion |
| Growth rate | CAGR of 9.6% from 2025 to 2033 |
| Base year for estimation | 2024 |
| Historical data | 2021 – 2023 |
| Forecast period | 2025 – 2033 |
| Quantitative units | Revenue in USD million/billion, and CAGR from 2025 to 2033 |
| Report coverage | Revenue forecast, company ranking, competitive landscape, growth factors, and trends |
| Segments covered | Drive, battery, product, battery fitting, end-use, region |
| Regional scope | North America; Europe; Asia Pacific; Latin America; MEA |
| Country scope | U.S.; Canada; Mexico; Germany; UK; France; China; Japan; India; South Korea; Australia; Brazil; KSA; UAE; South Africa |
| Key companies profiled | AllCell Technologies LLC; BMW Motorrad International; BOXX Corp.; Gogoro, Inc.; Green Energy Motors Corp.; Greenwit Technologies Inc.; Honda Motor Co. Ltd.; Jiangsu Xinri E-Vehicle Co., Ltd.; KTM AG; Mahindra GenZe. |
| Customization scope | Free report customization (equivalent up to 8 analysts working days) with purchase. Addition or alteration to country, regional & segment scope. |
Global Electric Scooters Market Report Segmentation
This report forecasts revenue growth at the global, regional, and country levels and provides an analysis of the latest industry trends in each of the sub-segments from 2021 to 2033. For this study, Grand View Research has segmented the global electric scooters market report based on drive, battery, product, battery fitting,end-use, and region:
• Drive Outlook (Revenue, USD Billion, 2021 – 2033)
• Belt Drive
• Chain Drive
• Hub Motors
• Battery Outlook (Revenue, USD Billion, 2021 – 2033)
• Lead Acid
• Li-Ion
• Other
• Product Outlook (Revenue, USD Billion, 2021 – 2033)
• Standard
• Folding
• Self-Balancing
• Maxi
• Three-wheeled
• Battery Fitting Outlook (Revenue, USD Billion, 2021 – 2033)
• Detachable
• Fixed
• End-use Outlook (Revenue, USD Billion, 2021 – 2033)
• Personal
• Commercial
• Regional Outlook (Revenue, USD Billion, 2021 – 2033)
• North America
o U.S.
o Canada
o Mexico
• Europe
o Germany
o UK
o France
• Asia Pacific
o China
o Japan
o India
o South Korea
o Australia
• Latin America
o Brazil
• Middle East and Africa (MEA)
o KSA
o UAE
o South Africa
Table of Contents
Chapter 1. Methodology and Scope
1.1. Market Segmentation and Scope
1.2. Research Methodology
1.2.1. Information Procurement
1.3. Information or Data Analysis
1.4. Methodology
1.5. Research Scope and Assumptions
1.6. Market Formulation & Validation
1.7. Country Based Segment Share Calculation
1.8. List of Data Sources
Chapter 2. Executive Summary
2.1. Market Outlook
2.2. Segment Outlook
2.3. Competitive Insights
Chapter 3. Electric Scooters Market Variables, Trends, & Scope
3.1. Market Lineage Outlook
3.2. Market Dynamics
3.2.1. Market Driver Analysis
3.2.2. Market Restraint Analysis
3.2.3. Industry Challenge
3.3. Electric Scooters Market Analysis Tools
3.3.1. Industry Analysis – Porter’s
3.3.1.1. Bargaining power of the suppliers
3.3.1.2. Bargaining power of the buyers
3.3.1.3. Threats of substitution
3.3.1.4. Threats from new entrants
3.3.1.5. Competitive rivalry
3.3.2. PESTEL Analysis
3.3.2.1. Political landscape
3.3.2.2. Economic landscape
3.3.2.3. Social landscape
3.3.2.4. Technological landscape
3.3.2.5. Environmental landscape
3.3.2.6. Legal landscape
Chapter 4. Electric Scooters Market: Drive Estimates & Trend Analysis
4.1. Segment Dashboard
4.2. Electric Scooters Market: Drive Movement Analysis, USD Million, 2024 & 2033
4.3. Belt Drive
4.3.1. Belt Drive Market Revenue Estimates and Forecasts, 2021 – 2033 (USD Million)
4.4. Chain Drive
4.4.1. Chain Drive Market Revenue Estimates and Forecasts, 2021 – 2033 (USD Million)
4.5. Hub Motors
4.5.1. Hub Motors Market Revenue Estimates and Forecasts, 2021 – 2033 (USD Million)
Chapter 5. Electric Scooters Market: Battery Estimates & Trend Analysis
5.1. Segment Dashboard
5.2. Electric Scooters Market: Battery Movement Analysis, USD Million, 2024 & 2033
5.3. Lead Acid
5.3.1. Lead Acid Market Revenue Estimates and Forecasts, 2021 – 2033 (USD Million)
5.4. Li-Ion
5.4.1. Li-Ion Market Revenue Estimates and Forecasts, 2021 – 2033 (USD Million)
5.5. Other
5.5.1. Other Market Revenue Estimates and Forecasts, 2021 – 2033 (USD Million)
Chapter 6. Electric Scooters Market: Product Estimates & Trend Analysis
6.1. Segment Dashboard
6.2. Electric Scooters Market: Product Movement Analysis, USD Million, 2024 & 2033
6.3. Standard
6.3.1. Standard Market Revenue Estimates and Forecasts, 2021 – 2033 (USD Million)
6.4. Folding
6.4.1. Folding Market Revenue Estimates and Forecasts, 2021 – 2033 (USD Million)
6.5. Self-Balancing
6.5.1. Self-Balancing Market Revenue Estimates and Forecasts, 2021 – 2033 (USD Million)
6.6. Maxi
6.6.1. Maxi Market Revenue Estimates and Forecasts, 2021 – 2033 (USD Million)
6.7. Three-wheeled
6.7.1. Three-wheeled Market Revenue Estimates and Forecasts, 2021 – 2033 (USD Million)
Chapter 7. Electric Scooters Market: Battery Fitting Estimates & Trend Analysis
7.1. Segment Dashboard
7.2. Electric Scooters Market: Battery Fitting Movement Analysis, USD Million, 2024 & 2033
7.3. Detachable
7.3.1. Detachable Market Revenue Estimates and Forecasts, 2021 – 2033 (USD Million)
7.4. Fixed
7.4.1. Fixed Market Revenue Estimates and Forecasts, 2021 – 2033 (USD Million)
Chapter 8. Electric Scooters Market: End Use Estimates & Trend Analysis
8.1. Segment Dashboard
8.2. Electric Scooters Market: End Use Movement Analysis, USD Million, 2024 & 2033
8.3. Personal
8.3.1. Personal Market Revenue Estimates and Forecasts, 2021 – 2033 (USD Million)
8.4. Commercial
8.4.1. Commercial Market Revenue Estimates and Forecasts, 2021 – 2033 (USD Million)
Chapter 9. Electric Scooters Market: Regional Estimates & Trend Analysis
9.1. Electric Scooters Market Share, By Region, 2024 & 2033, USD Million
9.2. North America
9.2.1. North America Electric Scooters Market Estimates and Forecasts, 2021 – 2033 (USD Million)
9.2.2. U.S.
9.2.2.1. U.S. Electric Scooters Market Estimates and Forecasts, 2021 – 2033 (USD Million)
9.2.3. Canada
9.2.3.1. Canada Electric Scooters Market Estimates and Forecasts, 2021 – 2033 (USD Million)
9.2.4. Mexico
9.2.4.1. Mexico Electric Scooters Market Estimates and Forecasts, 2021 – 2033 (USD Million)
9.3. Europe
9.3.1. Europe Electric Scooters Market Estimates and Forecasts, 2021 – 2033 (USD Million)
9.3.2. UK
9.3.2.1. UK Electric Scooters Market Estimates and Forecasts, 2021 – 2033 (USD Million)
9.3.3. Germany
9.3.3.1. Germany Electric Scooters Market Estimates and Forecasts, 2021 – 2033 (USD Million)
9.3.4. France
9.3.4.1. France Electric Scooters Market Estimates and Forecasts, 2021 – 2033 (USD Million)
9.4. Asia Pacific
9.4.1. Asia Pacific Electric Scooters Market Estimates and Forecasts, 2021 – 2033 (USD Million)
9.4.2. China
9.4.2.1. China Electric Scooters Market Estimates and Forecasts, 2021 – 2033 (USD Million)
9.4.3. Japan
9.4.3.1. Japan Electric Scooters Market Estimates and Forecasts, 2021 – 2033 (USD Million)
9.4.4. India
9.4.4.1. India Electric Scooters Market Estimates and Forecasts, 2021 – 2033 (USD Million)
9.4.5. South Korea
9.4.5.1. South Korea Electric Scooters Market Estimates and Forecasts, 2021 – 2033 (USD Million)
9.4.6. Australia
9.4.6.1. Australia Electric Scooters Market Estimates and Forecasts, 2021 – 2033 (USD Million)
9.5. Latin America
9.5.1. Latin America Electric Scooters Market Estimates and Forecasts, 2021 – 2033 (USD Million)
9.5.2. Brazil
9.5.2.1. Brazil Electric Scooters Market Estimates and Forecasts, 2021 – 2033 (USD Million)
9.6. Middle East and Africa
9.6.1. Middle East and Africa Electric Scooters Market Estimates and Forecasts, 2021 – 2033 (USD Million)
9.6.2. UAE
9.6.2.1. UAE Electric Scooters Market Estimates and Forecasts, 2021 – 2033 (USD Million)
9.6.3. KSA
9.6.3.1. KSA Electric Scooters Market Estimates and Forecasts, 2021 – 2033 (USD Million)
9.6.4. South Africa
9.6.4.1. South Africa Electric Scooters Market Estimates and Forecasts, 2021 – 2033 (USD Million)
Chapter 10. Competitive Landscape
10.1. Profiles/Listing
10.1.1. AllCell Technologies LLC
10.1.1.1. Participant’s Overview
10.1.1.2. Financial Performance
10.1.1.3. Product Benchmarking
10.1.1.4. Strategic Initiatives
10.1.2. BMW Motorrad International
10.1.2.1. Participant’s Overview
10.1.2.2. Financial Performance
10.1.2.3. Product Benchmarking
10.1.2.4. Strategic Initiatives
10.1.3. BOXX Corp.
10.1.3.1. Participant’s Overview
10.1.3.2. Financial Performance
10.1.3.3. Product Benchmarking
10.1.3.4. Strategic Initiatives
10.1.4. Gogoro, Inc.
10.1.4.1. Participant’s Overview
10.1.4.2. Financial Performance
10.1.4.3. Product Benchmarking
10.1.4.4. Strategic Initiatives
10.1.5. Green Energy Motors Corp.
10.1.5.1. Participant’s Overview
10.1.5.2. Financial Performance
10.1.5.3. Product Benchmarking
10.1.5.4. Strategic Initiatives
10.1.6. Greenwit Technologies Inc.
10.1.6.1. Participant’s Overview
10.1.6.2. Financial Performance
10.1.6.3. Product Benchmarking
10.1.6.4. Strategic Initiatives
10.1.7. Honda Motor Co. Ltd.
10.1.7.1. Participant’s Overview
10.1.7.2. Financial Performance
10.1.7.3. Product Benchmarking
10.1.7.4. Strategic Initiatives
10.1.8. Jiangsu Xinri E-Vehicle Co., Ltd.
10.1.8.1. Participant’s Overview
10.1.8.2. Financial Performance
10.1.8.3. Product Benchmarking
10.1.8.4. Strategic Initiatives
10.1.9. KTM AG
10.1.9.1. Participant’s Overview
10.1.9.2. Financial Performance
10.1.9.3. Product Benchmarking
10.1.9.4. Strategic Initiatives
10.1.10. Mahindra GenZe.
10.1.10.1. Participant’s Overview
10.1.10.2. Financial Performance
10.1.10.3. Product Benchmarking
10.1.10.4. Strategic Initiatives
List of Tables
Table 1 Global Electric Scooters Market size estimates & forecasts 2021 – 2033 (USD Million)
Table 2 Global Electric Scooters Market, by region 2021 – 2033 (USD Million)
Table 3 Global Electric Scooters Market, by Drive 2021 – 2033 (USD Million)
Table 4 Global Electric Scooters Market, by Battery 2021 – 2033 (USD Million)
Table 5 Global Electric Scooters Market, by Product 2021 – 2033 (USD Million)
Table 6 Global Electric Scooters Market, by Battery Fitting 2021 – 2033 (USD Million)
Table 7 Global Electric Scooters Market, by End Use 2021 – 2033 (USD Million)
Table 8 Belt Drive market, by region 2021 – 2033 (USD Million)
Table 9 Chain Drive market, by region 2021 – 2033 (USD Million)
Table 10 Hub Motors market, by region 2021 – 2033 (USD Million)
Table 11 Lead Acid market, by region 2021 – 2033 (USD Million)
Table 12 Li-Ion market, by region 2021 – 2033 (USD Million)
Table 13 Other market, by region 2021 – 2033 (USD Million)
Table 14 Standard market, by region 2021 – 2033 (USD Million)
Table 15 Folding market, by region 2021 – 2033 (USD Million)
Table 16 Self-Balancing market, by region 2021 – 2033 (USD Million)
Table 17 Maxi market, by region 2021 – 2033 (USD Million)
Table 18 Three-wheeled market, by region 2021 – 2033 (USD Million)
Table 19 Detachable market, by region 2021 – 2033 (USD Million)
Table 20 Fixed market, by region 2021 – 2033 (USD Million)
Table 21 Personal market, by region 2021 – 2033 (USD Million)
Table 22 Commercial market, by region 2021 – 2033 (USD Million)
Table 23 North America Electric Scooters Market, by Drive 2021 – 2033 (USD Million)
Table 24 North America Electric Scooters Market, by Battery 2021 – 2033 (USD Million)
Table 25 North America Electric Scooters Market, by Product 2021 – 2033 (USD Million)
Table 26 North America Electric Scooters Market, by Battery Fitting 2021 – 2033 (USD Million)
Table 27 North America Electric Scooters Market, by End Use 2021 – 2033 (USD Million)
Table 28 U.S. Electric Scooters Market, by Drive 2021 – 2033 (USD Million)
Table 29 U.S. Electric Scooters Market, by Battery 2021 – 2033 (USD Million)
Table 30 U.S. Electric Scooters Market, by Product 2021 – 2033 (USD Million)
Table 31 U.S. Electric Scooters Market, by Battery Fitting 2021 – 2033 (USD Million)
Table 32 U.S. Electric Scooters Market, by End Use 2021 – 2033 (USD Million)
Table 33 Canada Electric Scooters Market, by Drive 2021 – 2033 (USD Million)
Table 34 Canada Electric Scooters Market, by Battery 2021 – 2033 (USD Million)
Table 35 Canada Electric Scooters Market, by Product 2021 – 2033 (USD Million)
Table 36 Canada Electric Scooters Market, by Battery Fitting 2021 – 2033 (USD Million)
Table 37 Canada Electric Scooters Market, by End Use 2021 – 2033 (USD Million)
Table 38 Mexico Electric Scooters Market, by Drive 2021 – 2033 (USD Million)
Table 39 Mexico Electric Scooters Market, by Battery 2021 – 2033 (USD Million)
Table 40 Mexico Electric Scooters Market, by Product 2021 – 2033 (USD Million)
Table 41 Mexico Electric Scooters Market, by Battery Fitting 2021 – 2033 (USD Million)
Table 42 Mexico Electric Scooters Market, by End Use 2021 – 2033 (USD Million)
Table 43 Europe Electric Scooters Market, by Drive 2021 – 2033 (USD Million)
Table 44 Europe Electric Scooters Market, by Battery 2021 – 2033 (USD Million)
Table 45 Europe Electric Scooters Market, by Product 2021 – 2033 (USD Million)
Table 46 Europe Electric Scooters Market, by Battery Fitting 2021 – 2033 (USD Million)
Table 47 Europe Electric Scooters Market, by End Use 2021 – 2033 (USD Million)
Table 48 UK Electric Scooters Market, by Drive 2021 – 2033 (USD Million)
Table 49 UK Electric Scooters Market, by Battery 2021 – 2033 (USD Million)
Table 50 UK Electric Scooters Market, by Product 2021 – 2033 (USD Million)
Table 51 UK Electric Scooters Market, by Battery Fitting 2021 – 2033 (USD Million)
Table 52 UK Electric Scooters Market, by End Use 2021 – 2033 (USD Million)
Table 53 Germany Electric Scooters Market, by Drive 2021 – 2033 (USD Million)
Table 54 Germany Electric Scooters Market, by Battery 2021 – 2033 (USD Million)
Table 55 Germany Electric Scooters Market, by Product 2021 – 2033 (USD Million)
Table 56 Germany Electric Scooters Market, by Battery Fitting 2021 – 2033 (USD Million)
Table 57 Germany Electric Scooters Market, by End Use 2021 – 2033 (USD Million)
Table 58 France Electric Scooters Market, by Drive 2021 – 2033 (USD Million)
Table 59 France Electric Scooters Market, by Battery 2021 – 2033 (USD Million)
Table 60 France Electric Scooters Market, by Product 2021 – 2033 (USD Million)
Table 61 France Electric Scooters Market, by Battery Fitting 2021 – 2033 (USD Million)
Table 62 France Electric Scooters Market, by End Use 2021 – 2033 (USD Million)
Table 63 Asia Pacific Electric Scooters Market, by Drive 2021 – 2033 (USD Million)
Table 64 Asia Pacific Electric Scooters Market, by Battery 2021 – 2033 (USD Million)
Table 65 Asia Pacific Electric Scooters Market, by Product 2021 – 2033 (USD Million)
Table 66 Asia Pacific Electric Scooters Market, by Battery Fitting 2021 – 2033 (USD Million)
Table 67 Asia Pacific Electric Scooters Market, by End Use 2021 – 2033 (USD Million)
Table 68 China Electric Scooters Market, by Drive 2021 – 2033 (USD Million)
Table 69 China Electric Scooters Market, by Battery 2021 – 2033 (USD Million)
Table 70 China Electric Scooters Market, by Product 2021 – 2033 (USD Million)
Table 71 China Electric Scooters Market, by Battery Fitting 2021 – 2033 (USD Million)
Table 72 China Electric Scooters Market, by End Use 2021 – 2033 (USD Million)
Table 73 India Electric Scooters Market, by Drive 2021 – 2033 (USD Million)
Table 74 India Electric Scooters Market, by Battery 2021 – 2033 (USD Million)
Table 75 India Electric Scooters Market, by Product 2021 – 2033 (USD Million)
Table 76 India Electric Scooters Market, by Battery Fitting 2021 – 2033 (USD Million)
Table 77 India Electric Scooters Market, by End Use 2021 – 2033 (USD Million)
Table 78 Japan Electric Scooters Market, by Drive 2021 – 2033 (USD Million)
Table 79 Japan Electric Scooters Market, by Battery 2021 – 2033 (USD Million)
Table 80 Japan Electric Scooters Market, by Product 2021 – 2033 (USD Million)
Table 81 Japan Electric Scooters Market, by Battery Fitting 2021 – 2033 (USD Million)
Table 82 Japan Electric Scooters Market, by End Use 2021 – 2033 (USD Million)
Table 83 Australia Electric Scooters Market, by Drive 2021 – 2033 (USD Million)
Table 84 Australia Electric Scooters Market, by Battery 2021 – 2033 (USD Million)
Table 85 Australia Electric Scooters Market, by Product 2021 – 2033 (USD Million)
Table 86 Australia Electric Scooters Market, by Battery Fitting 2021 – 2033 (USD Million)
Table 87 Australia Electric Scooters Market, by End Use 2021 – 2033 (USD Million)
Table 88 South Korea Electric Scooters Market, by Drive 2021 – 2033 (USD Million)
Table 89 South Korea Electric Scooters Market, by Battery 2021 – 2033 (USD Million)
Table 90 South Korea Electric Scooters Market, by Product 2021 – 2033 (USD Million)
Table 91 South Korea Electric Scooters Market, by Battery Fitting 2021 – 2033 (USD Million)
Table 92 South Korea Electric Scooters Market, by End Use 2021 – 2033 (USD Million)
Table 93 Latin America Electric Scooters Market, by Drive 2021 – 2033 (USD Million)
Table 94 Latin America Electric Scooters Market, by Battery 2021 – 2033 (USD Million)
Table 95 Latin America Electric Scooters Market, by Product 2021 – 2033 (USD Million)
Table 96 Latin America Electric Scooters Market, by Battery Fitting 2021 – 2033 (USD Million)
Table 97 Latin America Electric Scooters Market, by End Use 2021 – 2033 (USD Million)
Table 98 Brazil Electric Scooters Market, by Drive 2021 – 2033 (USD Million)
Table 99 Brazil Electric Scooters Market, by Battery 2021 – 2033 (USD Million)
Table 100 Brazil Electric Scooters Market, by Product 2021 – 2033 (USD Million)
Table 101 Brazil Electric Scooters Market, by Battery Fitting 2021 – 2033 (USD Million)
Table 102 Brazil Electric Scooters Market, by End Use 2021 – 2033 (USD Million)
Table 103 MEA Electric Scooters Market, by Drive 2021 – 2033 (USD Million)
Table 104 MEA Electric Scooters Market, by Battery 2021 – 2033 (USD Million)
Table 105 MEA Electric Scooters Market, by Product 2021 – 2033 (USD Million)
Table 106 MEA Electric Scooters Market, by Battery Fitting 2021 – 2033 (USD Million)
Table 107 MEA Electric Scooters Market, by End Use 2021 – 2033 (USD Million)
Table 108 UAE Electric Scooters Market, by Drive 2021 – 2033 (USD Million)
Table 109 UAE Electric Scooters Market, by Battery 2021 – 2033 (USD Million)
Table 110 UAE Electric Scooters Market, by Product 2021 – 2033 (USD Million)
Table 111 UAE Electric Scooters Market, by Battery Fitting 2021 – 2033 (USD Million)
Table 112 UAE Electric Scooters Market, by End Use 2021 – 2033 (USD Million)
Table 113 KSA Electric Scooters Market, by Drive 2021 – 2033 (USD Million)
Table 114 KSA Electric Scooters Market, by Battery 2021 – 2033 (USD Million)
Table 115 KSA Electric Scooters Market, by Product 2021 – 2033 (USD Million)
Table 116 KSA Electric Scooters Market, by Battery Fitting 2021 – 2033 (USD Million)
Table 117 KSA Electric Scooters Market, by End Use 2021 – 2033 (USD Million)
Table 118 South Africa Electric Scooters Market, by Drive 2021 – 2033 (USD Million)
Table 119 South Africa Electric Scooters Market, by Battery 2021 – 2033 (USD Million)
Table 120 South Africa Electric Scooters Market, by Product 2021 – 2033 (USD Million)
Table 121 South Africa Electric Scooters Market, by Battery Fitting 2021 – 2033 (USD Million)
Table 122 South Africa Electric Scooters Market, by End Use 2021 – 2033 (USD Million)
List of Figures
Fig. 1 Electric Scooters Market Segmentation
Fig. 2 Market research Battery mode
Fig. 3 Information procurement
Fig. 4 Primary research pattern
Fig. 5 Market research approaches
Fig. 6 Value chain-based sizing & forecasting
Fig. 7 Parent market analysis
Fig. 8 Market formulation & validation
Fig. 9 Electric Scooters Market snapshot
Fig. 10 Electric Scooters Market segment snapshot
Fig. 11 Electric Scooters Market competitive landscape snapshot
Fig. 12 Market research Battery mode
Fig. 13 Market driver relevance analysis (Current & future impact)
Fig. 14 Market restraint relevance analysis (Current & future impact)
Fig. 15 Electric Scooters Market: Drive outlook key takeaways (USD Million)
Fig. 16 Electric Scooters Market: Drive movement analysis (USD Million), 2024 & 2033
Fig. 17 Belt Drive market revenue estimates and forecasts, 2021 – 2033 (USD Million)
Fig. 18 Chain Drive market revenue estimates and forecasts, 2021 – 2033 (USD Million)
Fig. 19 Hub Motors market revenue estimates and forecasts, 2021 – 2033 (USD Million)
Fig. 20 Electric Scooters Market: Battery outlook key takeaways (USD Million)
Fig. 21 Electric Scooters Market: Battery movement analysis (USD Million), 2024 & 2033
Fig. 22 Lead Acid market revenue estimates and forecasts, 2021 – 2033 (USD Million)
Fig. 23 Li-Ion market revenue estimates and forecasts, 2021 – 2033 (USD Million)
Fig. 24 Other market revenue estimates and forecasts, 2021 – 2033 (USD Million)
Fig. 25 Electric Scooters Market: Product outlook key takeaways (USD Million)
Fig. 26 Electric Scooters Market: Product movement analysis (USD Million), 2024 & 2033
Fig. 27 Standard market revenue estimates and forecasts, 2021 – 2033 (USD Million)
Fig. 28 Folding market revenue estimates and forecasts, 2021 – 2033 (USD Million)
Fig. 29 Self-Balancing market revenue estimates and forecasts, 2021 – 2033 (USD Million)
Fig. 30 Maxi market revenue estimates and forecasts, 2021 – 2033 (USD Million)
Fig. 31 Three-wheeled market revenue estimates and forecasts, 2021 – 2033 (USD Million)
Fig. 32 Electric Scooters Market: Battery Fitting outlook key takeaways (USD Million)
Fig. 33 Electric Scooters Market: Battery Fitting movement analysis (USD Million), 2024 & 2033
Fig. 34 Detachable market revenue estimates and forecasts, 2021 – 2033 (USD Million)
Fig. 35 Fixed market revenue estimates and forecasts, 2021 – 2033 (USD Million)
Fig. 36 Electric Scooters Market: End Use outlook key takeaways (USD Million)
Fig. 37 Electric Scooters Market: End Use movement analysis (USD Million), 2024 & 2033
Fig. 38 Personal market revenue estimates and forecasts, 2021 – 2033 (USD Million)
Fig. 39 Commercial market revenue estimates and forecasts, 2021 – 2033 (USD Million)
Fig. 40 Regional marketplace: Key takeaways
Fig. 41 Electric Scooters Market: Regional outlook, 2024 & 2033, USD Million
Fig. 42 North America Electric Scooters Market estimates and forecasts, 2021 – 2033 (USD Million)
Fig. 43 U.S. Electric Scooters Market estimates and forecasts, 2021 – 2033 (USD Million)
Fig. 44 Canada Electric Scooters Market estimates and forecasts, 2021 – 2033 (USD Million)
Fig. 45 Mexico Electric Scooters Market estimates and forecasts, 2021 – 2033 (USD Million)
Fig. 46 Europe Electric Scooters Market estimates and forecasts, 2021 – 2033 (USD Million
Fig. 47 UK Electric Scooters Market estimates and forecasts, 2021 – 2033 (USD Million)
Fig. 48 Germany Electric Scooters Market estimates and forecasts, 2021 – 2033 (USD Million)
Fig. 49 France Electric Scooters Market estimates and forecasts, 2021 – 2033 (USD Million)
Fig. 50 Asia Pacific Electric Scooters Market estimates and forecasts, 2021 – 2033 (USD Million)
Fig. 51 Japan Electric Scooters Market estimates and forecasts, 2021 – 2033 (USD Million)
Fig. 52 China Electric Scooters Market estimates and forecasts, 2021 – 2033 (USD Million)
Fig. 53 India Electric Scooters Market estimates and forecasts, 2021 – 2033 (USD Million)
Fig. 54 Australia Electric Scooters Market estimates and forecasts, 2021 – 2033 (USD Million)
Fig. 55 South Korea Electric Scooters Market estimates and forecasts, 2021 – 2033 (USD Million)
Fig. 56 Latin America Electric Scooters Market estimates and forecasts, 2021 – 2033 (USD Million)
Fig. 57 Brazil Electric Scooters Market estimates and forecasts, 2021 – 2033 (USD Million)
Fig. 58 MEA Electric Scooters Market estimates and forecasts, 2021 – 2033 (USD Million)
Fig. 59 KSA Electric Scooters Market estimates and forecasts, 2021 – 2033 (USD Million)
Fig. 60 UAE Electric Scooters Market estimates and forecasts, 2021 – 2033 (USD Million)
Fig. 61 South Africa Electric Scooters Market estimates and forecasts, 2021 – 2033 (USD Million)
Fig. 62 Strategy framework
Fig. 63 Company Categorization