| 出版社 | Mordor Intelligence |
| 出版年月 | 2025年6月 |
Mobile 3D – Market Share Analysis, Industry Trends & Statistics, Growth Forecasts (2025 – 2030)

モバイル 3D 市場レポートは、3D 対応モバイル デバイス (スマートフォン、タブレットなど)、デバイス コンポーネント (3D イメージ センサー、3D GPU/ISP など)、3D テクノロジー (飛行時間型 (ToF)、構造化光など)、3D アプリケーション (モバイル ゲーム、マップとナビゲーション、アニメーションと 3D コンテンツ作成など)、および地理によってセグメント化されています。
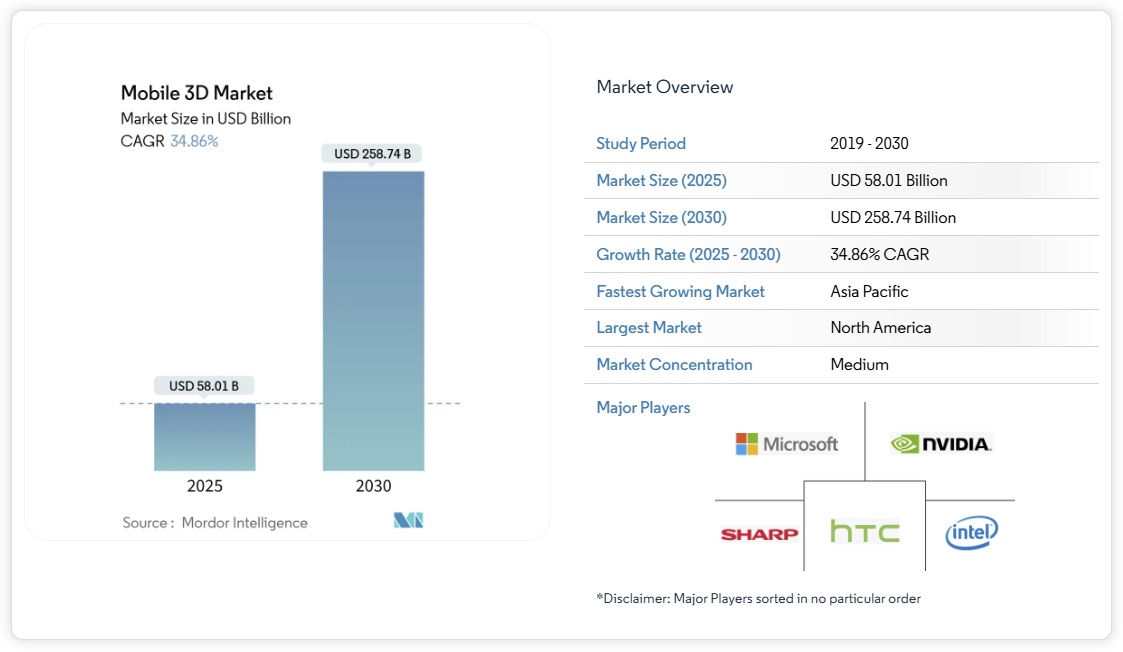
モバイル3D市場は2025年に580億1,000万米ドルに達し、2030年には2,587億4,000万米ドルに達し、年平均成長率(CAGR)34.86%で成長すると予測されています。この力強い成長は、エッジAI処理と高度な深度検知モジュールの組み合わせによって、日常的に使用する携帯電話が空間コンピューティングツールに変化したことによるものです。OLEDマイクロディスプレイのコスト低下により、スマートフォン、折りたたみ式デバイス、ウェアラブルデバイスで高解像度の空間コンテンツへのアクセスが拡大しています。ToF(Time-of-Flight)センサーはモバイルイメージングを強化し、ライトフィールドプロセッサーは30fpsで4Kホログラム品質を実現し、深度キャプチャイノベーションの次なる波を予感させます。企業の生産性向上、ARゲームの普及、5Gネットワークの展開により、ユーザー需要はさらに高まっています。VCSELエミッターとSPADセンサーをめぐるサプライチェーンの再編は、部品メーカー間の交渉力を再編する一方で、熱管理とバッテリー耐久性は依然として設計上の制約となっています。
2024年には、スマートフォンがモバイル3D市場の72%を占めました。これは、既存端末の優位性と年間のハードウェア更新サイクルを反映しています。フラッグシップ端末には現在、ToFアレイ、AIアクセラレータ、OLEDディスプレイが搭載されており、空間コンピューティングのロードマップのベースラインを形成しています。SamsungのGalaxy S25シリーズは、日常の写真を深度マップ付きの3Dアセットに変換するAI搭載のProVisualイメージングで、この好例です。折りたたみ式端末は、ユーザーの没入感を高めるレイヤードインターフェースを導入し、タブレットやノートパソコンは3Dコラボレーションをより広いキャンバスに拡張します。
AR/VRアイウェアは、現在、分子の規模は小さいものの、36.10%のCAGRで最も高い成長率を記録しています。MetaのReality Labsは、44億ドルの営業損失にもかかわらず、過去最高の売上高を記録し、潜在的な消費者の購買意欲を浮き彫りにしました。GoogleとSamsungは2026年にAndroid XRグラスを発表し、プラットフォームレベルでのコミットメントを示しています。これらのデバイスは、没入型ゲームからオンサイトメンテナンスのオーバーレイまで、エンターテインメントとエンタープライズを繋ぎます。数量が拡大するにつれ、ウェアラブル向けモバイル 3D 市場規模は、予測期間内にスマートフォンとの差を縮めるでしょう。
Mobile 3D Market Analysis
The Mobile 3D market generated USD 58.01 billion in 2025 and is forecast to reach USD 258.74 billion by 2030, advancing at a 34.86% CAGR. Robust growth reflects the pairing of edge-AI processing with advanced depth-sensing modules that turn everyday handsets into spatial-computing tools. Declining OLED micro-display costs widen access to high-resolution spatial content across smartphones, foldables, and wearables. Time-of-Flight (ToF) sensors strengthen mobile imaging while Light-Field processors reach 4K hologram quality at 30 fps, signaling the next wave of depth-capture innovation. Enterprise productivity gains, AR gaming uptake, and 5G network rollouts further elevate user demand. Supply-chain reshuffles around VCSEL emitters and SPAD sensors reshape bargaining power among component makers, while thermal management and battery endurance remain design constraints.
Mobile 3D – Market Share Analysis, Industry Trends & Statistics, Growth Forecasts (2025 – 2030)
List of Companies Covered in this Report:
- Apple Inc.
- Samsung Electronics Co. Ltd.
- Qualcomm Inc.
- LG Electronics Inc.
- Sony Corporation
- Google LLC
- Huawei Technologies Co. Ltd.
- Intel Corporation
- Nvidia Corporation
- AMS OSRAM AG
- Infineon Technologies AG
- STMicroelectronics N.V.
- pmdtechnologies ag
- MediaTek Inc.
- Xreal Technology (Formerly Nreal)
- Meta Platforms Inc.
- Xiaomi Corporation
- Oppo Mobile Telecommunications Corp.
- Vivo Communication Technology Co.
- Lenovo Group Limited
- Sharp Corporation
- HTC Corporation
- Hitachi Ltd.
- The 3M Company
Geography Analysis
North America led with a 40% Mobile 3D market share in 2024, buoyed by enterprise investments and high discretionary income. Meta’s cumulative AR/VR outlay topping USD 100 billion amplifies regional R&D momentum. Industrial firms report productivity gains from AR-enabled workflows, while consumers readily adopt premium smartphones that showcase bleeding-edge 3D features.
Asia Pacific is the growth pacesetter at a 41.02% CAGR through 2030. China’s 3D industrial camera revenue reached CNY 2.362 billion (USD 334 million) in 2024 on the back of robotics demand. The region contributes USD 880 billion of mobile value-added to GDP, positioning it as both supplier and demand center. Korean and Japanese firms push display and holo-processor research, while contract manufacturers in Vietnam and India absorb new assembly mandates for AR wearables.
Europe records steady take-up driven by Industry 4.0 projects in automotive and aerospace. Regulation supports secure data handling, encouraging enterprises to trial edge-AI 3D tools. Middle East and Africa and Latin America remain nascent Mobile 3D markets, yet rising 5G penetration and urbanization lay groundwork for accelerated adoption once hardware costs dip.