Data Center Wire And Cable - Market Share Analysis, Industry Trends & Statistics, Growth Forecasts (2026 - 2031)
データセンター用ワイヤおよびケーブル市場レポートは、ケーブルの種類(光ファイバー、銅データなど)、データセンターの種類(エンタープライズエッジおよびマイクロ、コロケーションなど)、アプリケーション(構造化配線など)、ケーブルの構造(シールド付き、シールドなしなど)、展開環境(屋内ホワイトスペースなど)、および地域(北米など)によって区分されています。
The Data Center Wire and Cable Market Report is Segmented by Cable Type (Optical Fiber, Copper Data, and More), Data Center Type (Enterprise Edge and Micro, Colocation, and More), Application (Structured Cabling, and More), Cable Construction (Shielded, Unshielded, and More), Deployment Environment (Indoor White Space, and More), and Geography (North America, and More).
| 出版 | Mordor Intelligence |
| 出版年月 | 2026年02月 |
| ページ数 | 159 |
| 価格 | 記載以外のライセンスについてはお問合せください |
| シングルユーザ | USD 4,750 |
| 種別 | 英文調査報告書 |
| 商品番号 | SMR-1564915649 |

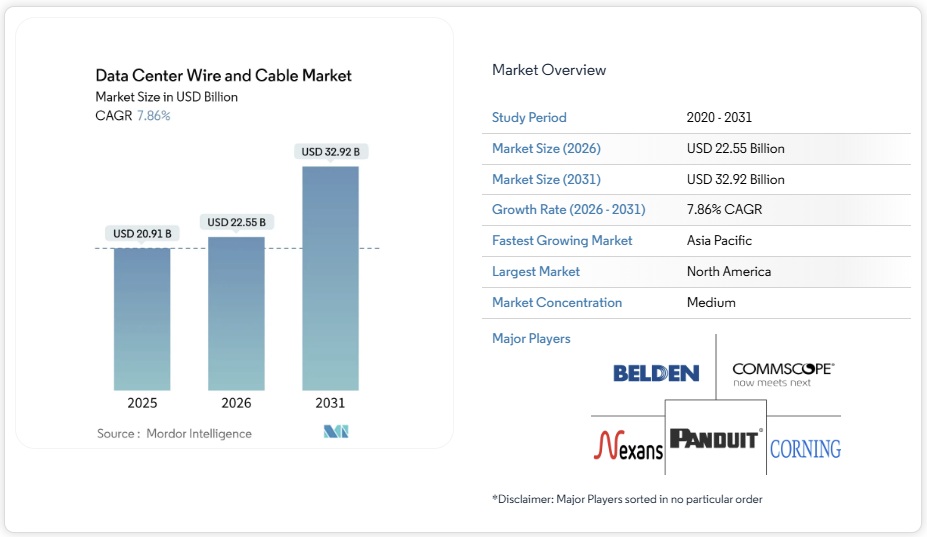
データセンター用ワイヤおよびケーブル市場は、2025年の209億1,000万米ドルから2026年には225億5,000万米ドルに成長し、2026年から2031年にかけて年平均成長率(CAGR)7.86%で成長し、2031年には329億2,000万米ドルに達すると予測されています。ハイパースケール構築の継続、400Gおよび800G光インターコネクトへの急速な移行、AIおよび高性能コンピューティング(HPC)ワークロードからの需要急増が、成長の主要因となっています。新規構築施設では、従来のCPU中心のホールよりも最大5倍高密度の構造化ケーブル配線が指定されるようになり、ラック内およびラック間リンクにおいて光ファイバーの消費量が銅線を上回っています。5Gおよびレイテンシに敏感なアプリケーションによって加速されたエッジおよびマイクロデータセンターの展開は、堅牢で耐熱性に優れたケーブル設計の新たなユースケースを生み出しています。 「ビルド・アメリカ・バイ・アメリカ法」などの政策インセンティブは国内の光ファイバー投資を促進しており、欧州の持続可能性に関する規制は、低損失でリサイクル可能な素材への購買を促している。商品価格の変動は依然として注視すべき事項であり、銅価格は2024年に一時的に1ポンドあたり5.20ドルに達し、ケーブル料金を最大35%上昇させた。
セグメント分析
- 光ファイバーは2025年時点でデータセンター用電線・ケーブル市場の59.30%を占め、2031年まで年平均成長率(CAGR)8.12%で成長すると予測されており、ほぼすべての指標で銅線を上回っています。光ファイバーケーブルのデータセンター用電線・ケーブル市場規模は、400G、800G、そして今後登場する1.6Tへのアップグレードにおいて不可欠であることから、2031年までに198億米ドルに達すると予測されています。銅線データケーブルは10G以下の低遅延バイパスゾーンでは依然として重要ですが、熱負荷の上昇とEMI(電磁干渉)の問題により、ケーブル長には限界があります。電力ケーブルは体積的には小さいものの、ラック電力が90kWを超え、施設が415V配電を採用するにつれて、依然としてミッションクリティカルな役割を担っています。
- イノベーションの中心は高密度化です。コーニングのSMF-28 Contourは、従来144芯だった筐体内に288芯のファイバーを収容でき、設計者は曲げ半径を40%削減できます。銅被覆アルミニウムは、金属の揮発性を相殺するため、短距離・低電流用途で使用されています。また、欧州の環境規制に対応するため、バイオベースの被覆材を使用した光ファイバーアセンブリも各社から発売されています。ケーブル、コネクタ、トランシーバーを統合的に設計する競争は、サプライヤー間の差別化を図り、長期的な包括サービス契約を強固なものにしています。
- ハイパースケール施設は、2025年の売上高の48.60%を占め、データセンター用電線・ケーブル市場で最大のシェアを獲得しました。しかし、エッジノードとマイクロノードは年平均成長率8.78%で成長を牽引し、これらの展開におけるデータセンター用ワイヤ・ケーブル市場規模は2031年までに65億5,000万米ドルに達すると予測されています。オハイオ州、バージニア州、ウッタル・プラデーシュ州にあるギガワット規模のキャンパスでは、GPUポッドを相互接続するために数千キロメートルものシングルモードファイバーが必要となります。一方、プレハブ式のマイクロEDCはケーブル長は短くなりますが、高価格帯の堅牢な被覆材とIP規格準拠のコネクタが求められます。
- フランクフルトとアッシュバーンのコロケーション事業者は、AIテナント誘致のために構造化ケーブルを継続的に更新していますが、多くの既存エンタープライズホールでは、高額な改修よりもクラウドオフロードを選択しています。サプライヤーは、ハイパースケールのビル内配線には曲げに強いマルチモードファイバー、サイドウォークキャビネットには装甲ルースチューブファイバーなど、用途に合わせた製品を提供しています。5Gスタンドアロンコアの普及に伴い、マイクロサイトでも無線ヘッドにPoE(Power over Ethernet)を導入する動きが見られ、銅線使用量が徐々に増加しています。集中型支出と分散型支出のバランスが、ベンダー間の研究開発資金の配分を決定づけるだろう。
Data Center Wire And Cable Market Analysis
The Data Center Wire and Cable market is expected to grow from USD 20.91 billion in 2025 to USD 22.55 billion in 2026 and is forecast to reach USD 32.92 billion by 2031 at 7.86% CAGR over 2026-2031. Continued hyperscale construction, rapid migration to 400 G and 800 G optical interconnects, and surging demand from AI and high-performance computing (HPC) workloads are the core growth engines. New-build facilities now specify structured cabling footprints up to five times denser than legacy CPU-centric halls, pushing optical-fiber consumption ahead of copper for intra-rack and inter-rack links. Edge and micro-data-center roll-outs, accelerated by 5G and latency-sensitive applications, are creating fresh use cases for ruggedized, temperature-hardened cable designs. Policy incentives such as the Build America Buy America Act are spurring domestic fiber investments, while sustainability mandates in Europe are steering purchasing toward low-loss and recyclable formulations. Commodity volatility remains a watch item; copper briefly touched USD 5.20 per pound in 2024 and lifted cable bills by as much as 35%.
Global Data Center Wire And Cable Market Trends and Insights
Robust Data-Center Expansion Worldwide
Hyperscale cloud operators announced multi-gigawatt campuses across the United States, India, and Indonesia in 2025, each demanding several million fiber terminations. Average rack densities rose from 15 kW in 2022 to 40 kW in new AI halls, doubling the horizontal cable runs per rack. Contractors, therefore, specify higher cable-tray capacities and pre-terminated trunk bundles to compress installation schedules. Regional governments in Singapore and Malaysia capped new data-center permits, yet green-field projects in secondary metros such as Johor Bahru and Phoenix offset the slowdown. Suppliers able to guarantee short lead times on multimodal assemblies are winning multi-year supply agreements with hyperscalers.
Surge in AI/HPC Workloads Requiring Ultra-Low-Latency Links
Training clusters built around tens of thousands of GPUs need four to five times more fiber jumpers per server than CPU racks, shifting bill-of-materials weighting toward high-density MPO-to-MPO trunks. Ethernet is overtaking InfiniBand for large-scale AI fabrics, prompting broad adoption of 400 G and 800 G short-reach optics that still fit the leaf-and-spine model. Corning’s Contour Flow cable now ships with 288 fibers in the same outer diameter as earlier 144-fiber bundles, halving pathway congestion. Latency budgets of 5 µs between GPU nodes force operators to minimize splice points, favoring factory-terminated solutions and driving demand for precision-polished MT-based connectors.
Thermal-Management Challenges in High-Density Bundles
Airflow constriction inside cable ladders raises inlet temperatures, and each 1 °C rise cuts DWDM link margin by 0.08 dB. Liquid-cooling manifolds occupy space once used for cable trays, forcing designers to reroute bundles in tighter radii that risk micro-bending losses. Vendors counter with gel-free cables rated to 85 °C and introduce flat-pack trunk formats that occupy 30% less cross-section than round designs. Operators trial heat-resistant pull-tabs to ease port access inside 55 °C aisles but still budget higher OpEx for frequent re-termination.
Other drivers and restraints analyzed in the detailed report include:
- Rapid Adoption of 400 G/800 G Optical Interconnects
- Proliferation of Edge and Micro Data Centers
- Retrofitting Legacy Facilities with High-Speed Cabling
For complete list of drivers and restraints, kindly check the Table Of Contents.
Segment Analysis
Optical fiber captured 59.30% of the Data Center Wire and Cable market in 2025 and is forecast to grow at an 8.12% CAGR to 2031, outpacing copper on nearly every metric. The Data Center Wire and Cable market size for fiber cables is projected to reach USD 19.8 billion by 2031, reflecting its indispensability for 400 G, 800 G, and forthcoming 1.6 T upgrades. Copper data cables retain relevance below 10 G and in low-latency bypass zones, yet rising thermal loads and EMI concerns cap their lane length. Power cables, while volumetrically smaller, remain mission-critical as rack power climbs past 90 kW and facilities adopt 415 V distribution.
Innovation centers on density: Corning’s SMF-28 Contour enables 288 fibers within earlier 144-fiber envelopes, giving designers 40% bend-radius relief. Copper-clad aluminum substitutes appear in short, low-ampacity applications to offset metal volatility. Vendors also release fiber-optic assemblies with bio-based jackets to meet European environmental regulations. The race to co-design cable, connector, and transceiver as a holistic channel differentiates suppliers and cements long-term master-service agreements.
Hyperscale facilities held 48.60% of 2025 revenue, equal to the largest share in the Data Center Wire and Cable market. Edge and micro nodes, however, lead growth at 8.78% CAGR, lifting the Data Center Wire and Cable market size for these deployments to USD 6.55 billion by 2031. Gigawatt-scale campuses in Ohio, Virginia, and Uttar Pradesh require thousands of kilometers of single-mode fiber to interconnect GPU pods. Conversely, prefabricated µEDCs consume shorter runs but demand ruggedized sheathing and IP-rated connectors that command premium pricing.
Colocation operators in Frankfurt and Ashburn keep refreshing structured cabling to court AI tenants, yet many legacy enterprise halls opt for cloud offload rather than expensive overhauls. Suppliers tailor SKUs: bend-insensitive multimode for hyperscale intra-build runs and armored loose-tube for sidewalk cabinets. As 5G standalone cores proliferate, micro sites also install power-over-ethernet for radio heads, subtly raising copper volumes. The balance between centralized and distributed spends will dictate the allocation of R&D funds across vendors.
The Data Center Wire and Cable Market is Segmented by Cable Type (Optical Fiber, Copper Data and More), Data Center Type (Enterprise, Colocation and More), Application (Structured Cabling, Power Distribution and More), Cable Construction(Shielded, Unshielded and More), Deployment Environment (Indoor White Space, Outdoor Plant and More), and Geography(North America, and More). Market Forecasts are Provided in Terms of Value (USD).
Geography Analysis
North America led the Data Center Wire and Cable market in 2025, driven by hyperscale investments exceeding USD 34 billion and reinforced by federal policies mandating domestic fiber for publicly funded broadband projects. Corning, CommScope, and AFL collectively pledged more than USD 500 million in new capacity, reducing import reliance and shortening project lead times. Canada benefits from colder climates and renewable energy, luring colocation builds in Québec. Mexico’s near-shoring wave fuels Tier III halls in Querétaro, which now require bilingual installation crews versed in U.S. standards.
Asia-Pacific delivers the highest regional CAGR through 2031, propelled by India’s data-sovereignty rules and China’s cloud service scale-up. Singapore’s construction moratorium pushed operators to Johor and Batam, stimulating cross-border fiber corridors. Australia records new submarine landings on its western coast, linking Perth to Muscat and Mombasa. Meanwhile, Japan and South Korea spearhead 1.6 T Ethernet R&D, accelerating domestic demand for prototype trunk cables.
Europe remains steady but highly regulated; EN 50575 and CPR rules require CE marking and fire-class certification for any cable permanently installed in buildings. Germany, the Netherlands, and the Nordics compete on renewable energy availability and stable grids, fostering sustainability-driven cable specifications. Middle East and Africa, though smaller, post double-digit growth as UAE, Saudi Arabia, and Kenya entice international cloud incumbents. Subsea projects circling the African continent guarantee long-term pull for ultra-long-haul fiber, even as political risk premiums linger.
List of Companies Covered in this Report:
- Nexans S.A.
- Belden Inc.
- Panduit Corp.
- CommScope Holding Co. Inc.
- Corning Inc.
- TE Connectivity plc
- Yangtze Optical Fibre and Cable (YOFC)
- Legrand Group
- Southwire Company LLC
- Furukawa Electric Co. Ltd.
- Prysmian Group
- Sumitomo Electric Industries Ltd.
- LS Cable and System
- Superior Essex Inc.
- AFL Global
- Rosenberger Hochfrequenztechnik GmbH
- Hexatronic Group AB
- HUBER+SUHNER AG
- Fujikura Ltd.
- Datwyler IT Infra
- Ciena Corporation
- Tratos Cavi S.p.A.
Additional Benefits:
- The market estimate (ME) sheet in Excel format
- 3 months of analyst support
Table of Contents
1 INTRODUCTION
1.1 Study Assumptions and Market Definition
1.2 Scope of the Study
2 RESEARCH METHODOLOGY
3 EXECUTIVE SUMMARY
4 MARKET LANDSCAPE
4.1 Market Overview
4.2 Market Drivers
4.2.1 Robust data-center expansion worldwide
4.2.2 Surge in AI/HPC workloads requiring ultra-low-latency links
4.2.3 Rapid adoption of 400G/800G optical inter-connects
4.2.4 Proliferation of edge and micro data centers
4.2.5 Sustainability mandates for low-loss recyclable cabling
4.2.6 Government incentives for domestic fiber and power-cable production
4.3 Market Restraints
4.3.1 Thermal-management challenges in high-density bundles
4.3.2 Retrofitting legacy facilities with high-speed cabling
4.3.3 Volatility in copper and aluminum commodity prices
4.3.4 Skilled-labor shortage for advanced fiber termination
4.4 Value / Supply-Chain Analysis
4.5 Regulatory Landscape
4.6 Technological Outlook
4.7 Porter’s Five Forces
4.7.1 Threat of New Entrants
4.7.2 Bargaining Power of Suppliers
4.7.3 Bargaining Power of Buyers
4.7.4 Threat of Substitutes
4.7.5 Competitive Rivalry
4.8 Pricing Analysis
4.9 Investment Analysis
5 ANALYSIS OF DATA CENTER CONSTRUCTION ACTIVITY WORLDWIDE
5.1 Upcoming Data Center Construction Hotspots (planned IT-load additions)
5.2 Growth of Hyperscale Data Centers
5.3 Regional DC Construction – Vendor Landscape
6 MARKET SIZE AND GROWTH FORECASTS (VALUE)
6.1 By Cable Type
6.1.1 Optical Fiber Cables
6.1.2 Copper Data Cables (Twisted Pair)
6.1.3 Power Cables
6.1.3.1 Voltage Type
6.1.3.1.1 High Voltage (HV)
6.1.3.1.2 Medium Voltage (MV)
6.1.3.1.3 Low Voltage (LV)
6.1.3.2 Material Type
6.1.3.2.1 Copper
6.1.3.2.2 Aluminum
6.1.3.3 Application
6.1.3.3.1 PDUs and UPS Systems
6.1.3.3.2 HVAC System
6.1.3.3.3 Networking and IT Equipment
6.1.3.3.4 Others
6.1.4 Other Cables (Grounding, Sensor, Control)
6.2 By Data Center Type
6.2.1 Enterprise/ Edge / Micro
6.2.2 Colocation
6.2.3 Hyperscale
6.3 By Application
6.3.1 Structured Cabling
6.3.2 Power Distribution
6.3.3 HVAC and Building Systems
6.3.4 Monitoring and Control
6.3.5 High-Speed Interconnects (>100 G)
6.4 By Cable Construction
6.4.1 Shielded
6.4.2 Unshielded
6.4.3 Armored
6.4.4 Plenum-Rated
6.5 By Deployment Environment
6.5.1 Indoor (White Space)
6.5.2 Outdoor Plant
6.5.3 Sub-sea / Inter-facility
6.6 By Geography
6.6.1 North America
6.6.1.1 United States
6.6.1.2 Canada
6.6.1.3 Mexico
6.6.2 South America
6.6.2.1 Brazil
6.6.2.2 Argentina
6.6.2.3 Rest of South America
6.6.3 Europe
6.6.3.1 Germany
6.6.3.2 United Kingdom
6.6.3.3 France
6.6.3.4 Nordic Region
6.6.3.5 Russia
6.6.3.6 Rest of Europe
6.6.4 Asia-Pacific
6.6.4.1 China
6.6.4.2 India
6.6.4.3 Japan
6.6.4.4 South Korea
6.6.4.5 Southeast Asia
6.6.4.6 Rest of Asia-Pacific
6.6.5 Middle East
6.6.5.1 UAE
6.6.5.2 Saudi Arabia
6.6.5.3 Turkey
6.6.5.4 Rest of Middle East
6.6.6 Africa
6.6.6.1 South Africa
6.6.6.2 Nigeria
6.6.6.3 Rest of Africa
7 COMPETITIVE LANDSCAPE
7.1 Market Share Analysis
7.2 Company Profiles (includes Global level Overview, Market level overview, Core Segments, Financials as available, Strategic Information, Market Rank/Share for key companies, Products and Services, and Recent Developments)
7.2.1 Nexans S.A.
7.2.2 Belden Inc.
7.2.3 Panduit Corp.
7.2.4 CommScope Holding Co. Inc.
7.2.5 Corning Inc.
7.2.6 TE Connectivity plc
7.2.7 Yangtze Optical Fibre and Cable (YOFC)
7.2.8 Legrand Group
7.2.9 Southwire Company LLC
7.2.10 Furukawa Electric Co. Ltd.
7.2.11 Prysmian Group
7.2.12 Sumitomo Electric Industries Ltd.
7.2.13 LS Cable and System
7.2.14 Superior Essex Inc.
7.2.15 AFL Global
7.2.16 Rosenberger Hochfrequenztechnik GmbH
7.2.17 Hexatronic Group AB
7.2.18 HUBER+SUHNER AG
7.2.19 Fujikura Ltd.
7.2.20 Datwyler IT Infra
7.2.21 Ciena Corporation
7.2.22 Tratos Cavi S.p.A.
8 MARKET OPPORTUNITIES AND FUTURE OUTLOOK
8.1 White-Space and Unmet-Need Assessment