Force Sensors Market Report 2026-2034
力覚センサー市場レポート : センシング技術(ひずみゲージ、ロードセル、感圧抵抗器など)、力の種類(圧縮、引張、圧縮と引張)、動作方式(アナログ、デジタル)、最終用途(自動車、鉄道車両、製造、鉱業、航空宇宙・防衛、建設、医療など)、および地域 2026-2034年
Force Sensors Market Report by Sensing Technology (Strain Gauge, Load Cell, Force Sensitive Resistors, and Others), Force Type (Compression, Tension, Compression and Tension), Operation (Analog, Digital), End Use (Automotive, Locomotive, Manufacturing, Mining, Aerospace and Defense, Construction, Healthcare, and Others), and Region 2026-2034
| 出版 | IMARC Group |
| 出版年月 | 2026年04月 |
| ページ数 | 136 |
| 図表数 | 112 |
| 価格 | 記載以外のライセンスについてはお問合せください |
| シングルユーザ | USD 3,999 |
| 種別 | 英文調査報告書 |
| 商品番号 | SMR-17319 |

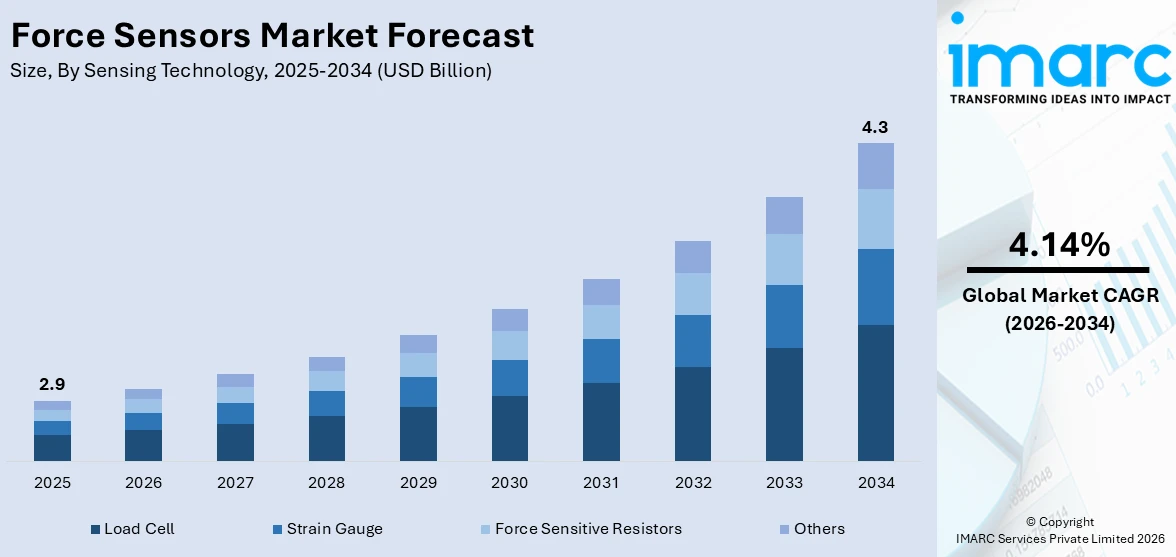
世界の力覚センサー市場は2025年には29億米ドルの市場規模となりました。IMARCグループは力覚センサー市場規模は2026年から2034年にかけて年平均成長率(CAGR)4.14%で成長し、2034年までに43億米ドルに達すると予測しています。力覚センサー市場は電気自動車(EV)の販売増加、効率と生産性向上のための様々な製造プロセスの自動化の進展、そして家電製品やウェアラブルデバイスの普及拡大によって、着実に成長を続けています。
IMARC Group(IMARCグループ)「力覚センサー市場レポート : センシング技術(ひずみゲージ、ロードセル、感圧抵抗器など)、力の種類(圧縮、引張、圧縮と引張)、動作方式(アナログ、デジタル)、最終用途(自動車、鉄道車両、製造、鉱業、航空宇宙・防衛、建設、医療など)、および地域 2026-2034年 – Force Sensors Market Report by Sensing Technology (Strain Gauge, Load Cell, Force Sensitive Resistors, and Others), Force Type (Compression, Tension, Compression and Tension), Operation (Analog, Digital), End Use (Automotive, Locomotive, Manufacturing, Mining, Aerospace and Defense, Construction, Healthcare, and Others), and Region 2026-2034」は力覚センサーの世界市場を調査し、主要セグメント別に分析・予測を行っています。
調査対象セグメント
- センシング技術
- ひずみゲージ
- ロードセル
- 感圧抵抗器
- その他
- 力覚タイプ
- 圧縮力
- 引張力
- 圧縮力と引張力
- 動作
- アナログ
- デジタル
- エンドユース
- 自動車
- 鉄道車両
- 製造業
- 鉱業
- 航空宇宙&防衛
- 建設
- 医療
- その他
- 地域
- 北米
- 米国
- カナダ
- アジア太平洋地域
- 中国
- 日本
- インド
- 韓国
- オーストラリア
- インドネシア
- その他
- 欧州
- ドイツ
- フランス
- 英国
- イタリア
- スペイン
- ロシア
- その他
- ラテンアメリカ
- ブラジル
- メキシコ
- その他
- 中東&アフリカ
- 北米
力覚センサー市場分析:
- 市場成長と規模:力覚センサー市場は、様々な産業における高精度な力計測への需要の高まりと、自動化およびインダストリー4.0イニシアチブの普及を背景に、緩やかな成長を遂げています。
- 主な市場推進要因:主な推進要因としては、特に製造プロセスにおける自動化の進展、そして各産業における品質管理と安全性への重視が挙げられます。
- 技術革新:マイクロ電気機械システム(MEMS)や圧電結晶などの材料における継続的な技術革新により、力覚センサーの精度と信頼性が向上しています。
- 産業用途:力覚センサーは、自動車組立、ロボット工学、医療機器、家電製品、航空宇宙試験など、幅広い分野で活用されており、その汎用性の高さが示されています。
- 主な市場動向:市場は、デジタル化とデータ駆動型意思決定という広範なトレンドに沿って、力覚センサーのデジタル化への移行が進んでいます。ウェアラブルデバイスや家電製品市場における力覚センサーの統合の拡大は、触覚フィードバックと高精度な力計測によるユーザーエクスペリエンスの向上というトレンドを反映しています。
- 地域別動向:アジア太平洋地域は、急速な工業化、製造業の成長、自動車および電子機器製造における各国の優位性を背景に、力覚センサー市場を牽引しています。一方、北米地域も、技術革新、インダストリー4.0の導入、製造における品質基準への強いこだわりを背景に、急速に成長している市場として台頭しています。
- 競争環境:競争環境は、主要企業が製品イノベーション、パートナーシップ、グローバル展開といった戦略的イニシアチブに取り組んでいることが特徴です。力覚センサー市場の大手企業は、市場での地位を強化し、変化する顧客ニーズに対応するための継続的な努力を続けています。
- 課題と機会:課題としては、変化する業界ニーズに対応するための絶え間ないイノベーションの必要性や、ますます複雑化するシステムへの力覚センサーの統合などが挙げられます。しかし、再生可能エネルギーや高度なヘルスケア技術といった、進化するアプリケーションへの対応機会は、これらの課題を克服する上で重要な役割を果たすと予測されます。
Report Overview
The global force sensors market size reached USD 2.9 Billion in 2025. Looking forward, IMARC Group expects the market to reach USD 4.3 Billion by 2034, exhibiting a growth rate (CAGR) of 4.14% during 2026-2034. The market is experiencing steady growth driven by the growing sales of electric vehicles (EVs), rising automation of various manufacturing processes to improve efficiency and productivity, and increasing proliferation of consumer electronics and wearable devices.
Force Sensors Market Analysis:
- Market Growth and Size: The force sensors market is experiencing moderate growth, driven by the increasing demand for precise force measurement across various industries and the proliferation of automation and Industry 4.0 initiatives.
- Major Market Drivers: Key drivers include the growing trend of automation, particularly in manufacturing processes, and the emphasis on quality control and safety across industries.
- Technological Advancements: Continuous advancements, especially in microelectromechanical systems (MEMS) and materials like piezoelectric crystals, are enhancing the precision and reliability of force sensors.
- Industry Applications: Force sensors find widespread applications in automotive assembly, robotics, healthcare devices, consumer electronics, and aerospace testing, showcasing their versatility.
- Key Market Trends: The market is witnessing a shift towards digital operation in force sensors, aligning with the broader trend of digitalization and data-driven decision-making. The increasing integration of force sensors in wearable devices and the consumer electronics market reflects a growing trend of enhancing user experiences through haptic feedback and precise force measurements.
- Geographical Trends: Asia Pacific leads the force sensors market, driven by rapid industrialization, manufacturing growth, and the prominence of countries in automotive and electronics manufacturing. Nonetheless, North America is emerging as a fast-growing market, driven by technological innovations, Industry 4.0 adoption, and a strong emphasis on quality standards in manufacturing.
- Competitive Landscape: The competitive landscape is characterized by key players engaging in strategic initiatives, such as product innovation, partnerships, and global expansions. Continuous efforts to strengthen market positions and meet evolving customer needs are observed among leading companies in the force sensors market.
- Challenges and Opportunities: Challenges include the need for constant innovation to meet evolving industry demands and the integration of force sensors into increasingly complex systems. However, opportunities for addressing evolving applications, like renewable energy and advanced healthcare technologies, are projected to overcome these challenges.
Force Sensors Market Trends:
Technological Advancements and Innovation
The market is driven by continuous technological advancements and innovations. As industries across the board strive for increased efficiency, accuracy, and automation, force sensors play a crucial role in enhancing the performance of various applications. The evolution of microelectromechanical systems (MEMS) technology is allowing for the development of miniaturized and more sensitive force sensors, expanding their applications across diverse industries. Moreover, with ongoing research and development (R&D), force sensors are becoming more sophisticated, offering improved precision and reliability. The integration of advanced materials, such as piezoelectric crystals and optical fibers, is enabling the creation of sensors capable of measuring forces with exceptional accuracy and responsiveness. These innovations are particularly impactful in industries, such as healthcare, automotive, aerospace, and robotics, where precise force measurements are critical for optimal performance. The rise of Industry 4.0 and the internet of things (IoT) is catalyzing the demand for advanced force sensors. These sensors are integral components in smart manufacturing environments, where real-time data on forces exerted in various processes contribute to predictive maintenance, process optimization, and overall operational efficiency.
Growing Automation Across Industries
The increasing trend of automating manufacturing processes is impelling the growth of the market. As industries are automating their operations to enhance productivity and reduce labor costs, the need for accurate force sensing is becoming paramount. Force sensors enable robots and automated machinery to perform tasks with precision by providing feedback on the force applied during different stages of a process. In sectors like automotive assembly lines, force sensors are utilized to ensure precise fitting of components, preventing damage and improving overall product quality. Similarly, in electronics manufacturing, force sensors play a vital role in delicate tasks, such as semiconductor wafer handling and assembly of miniature components. The adoption of collaborative robots (cobots) is another significant factor propelling the market growth. Force sensors enable cobots to work alongside humans safely by sensing and adjusting their force in response to human interaction, opening new possibilities for human-robot collaboration in various industries.
Increasing Applications in Consumer Electronics and Wearables
The proliferation of consumer electronics and wearable devices is contributing to the growth of the market. Force sensors find applications in various consumer products, such as smartphones, gaming controllers, and fitness wearables. The integration of force-sensitive touchscreens and haptic feedback systems in smartphones enhances user interaction by providing a tactile response to touch gestures. In the field of virtual reality (VR) and augmented reality (AR), force sensors play a crucial role in creating immersive experiences. Force-sensitive controllers in VR systems allow users to feel a sense of resistance or feedback, adding realism to virtual environments. As consumer demand for enhanced user experiences continues to rise, the adoption of force sensors in consumer electronics is expected to increase. The fitness and healthcare industries also leverage force sensors in wearable devices to monitor and provide real-time feedback on physical activities. Force sensors embedded in smart clothing or fitness trackers can measure parameters, such as applied force, posture, and movement, contributing to the development of advanced health monitoring solutions.
Force Sensors Industry Segmentation:
IMARC Group provides an analysis of the key trends in each segment of the market, along with forecasts at the global, regional, and country levels for 2026-2034. Our report has categorized the market based on sensing technology, force type, operation, and end use.
Breakup by Sensing Technology:
- Strain Gauge
- Load Cell
- Force Sensitive Resistors
- Others
Load cell accounts for the majority of the market share
The report has provided a detailed breakup and analysis of the market based on the sensing technology. This includes strain gauge, load cell, force sensitive resistors, and others. According to the report, load cell represented the largest segment.
Load cells are widely utilized for measuring force and weight across various industries due to their high accuracy and reliability. These devices convert applied force into an electrical signal, providing precise measurements crucial in applications ranging from industrial scales and material testing to healthcare equipment. Load cells come in various types, including hydraulic, pneumatic, and strain gauge load cells, each tailored to specific industry needs. The consistent demand for accurate weight measurement in manufacturing, logistics, and healthcare sectors propels the dominance of load cells within the force sensors market, making them a fundamental component in ensuring quality control and operational efficiency.
Strain gauge-based force sensors constitute a significant segment of the market, offering a versatile solution for measuring force in diverse applications. These sensors operate on the principle of measuring the deformation (strain) of a material under force, providing an electrical output proportional to the applied force. Strain gauge force sensors find extensive use in structural monitoring, automotive testing, and aerospace applications, where the ability to measure small changes in force is critical.
Force sensitive resistors (FSR) are particularly popular in applications requiring a low-cost, flexible, and lightweight solution for force measurement. Common uses of FSRs include touchscreens, musical instruments, and medical devices. The advantage of FSRs lies in their simple structure and ease of integration into various forms, making them suitable for applications where traditional load cells or strain gauges may be impractical.
Breakup by Force Type:
- Compression
- Tension
- Compression and Tension
Compression and tension hold the largest share in the industry
A detailed breakup and analysis of the market based on the force type have also been provided in the report. This includes compression, tension, and compression and tension. According to the report, compression and tension accounted for the largest market share.
Compression and tension are the largest segments, reflecting the prevalence of applications requiring sensors to measure both compression and tension forces. Industries, such as materials testing, construction, and automotive, often encounter scenarios where forces act in multiple directions. Compression and tension force sensors are designed to handle both types of forces, providing a versatile solution for a wide range of applications. In materials testing, these sensors accurately measure the compressive strength of materials as well as their tensile strength, offering a comprehensive solution for quality control and research purposes. The dual functionality of compression and tension force sensors contributes to their dominance in the market, addressing the diverse force measurement needs of various industries.
Industries, such as manufacturing, packaging, and pharmaceuticals frequently utilize compression force sensors to ensure the proper functioning and quality control of machinery and processes.
Industries like aerospace, automotive testing, and material handling rely on tension force sensors to assess the strength and durability of materials and components subjected to pulling or stretching forces.
Breakup by Operation:
- Analog
- Digital
Analog represents the leading market segment
The report has provided a detailed breakup and analysis of the market based on the operation. This includes analog and digital. According to the report, analog represented the largest segment.
Analog force sensors generate output signals that vary continuously in response to changes in force, providing a proportional and real-time representation of the applied force. This makes analog force sensors well-suited for applications where precise and continuous force measurement is critical, such as in research, testing, and industrial automation. The simplicity, reliability, and widespread compatibility of analog signals with existing systems contribute to the dominance of analog operation in the force sensors market. Industries ranging from automotive manufacturing to material testing often rely on analog force sensors to obtain accurate and instantaneous feedback on force dynamics.
Digital force sensors convert force measurements into discrete digital values, offering benefits, such as improved noise immunity, ease of data transmission, and compatibility with digital processing systems. Digital force sensors are commonly employed in applications where precise force data needs to be communicated to digital controllers or microprocessors, such as in robotics, consumer electronics, and smart manufacturing.
Breakup by End Use:
- Automotive
- Locomotive
- Manufacturing
- Mining
- Aerospace and Defense
- Construction
- Healthcare
- Others
Force Sensors Market – by End Use
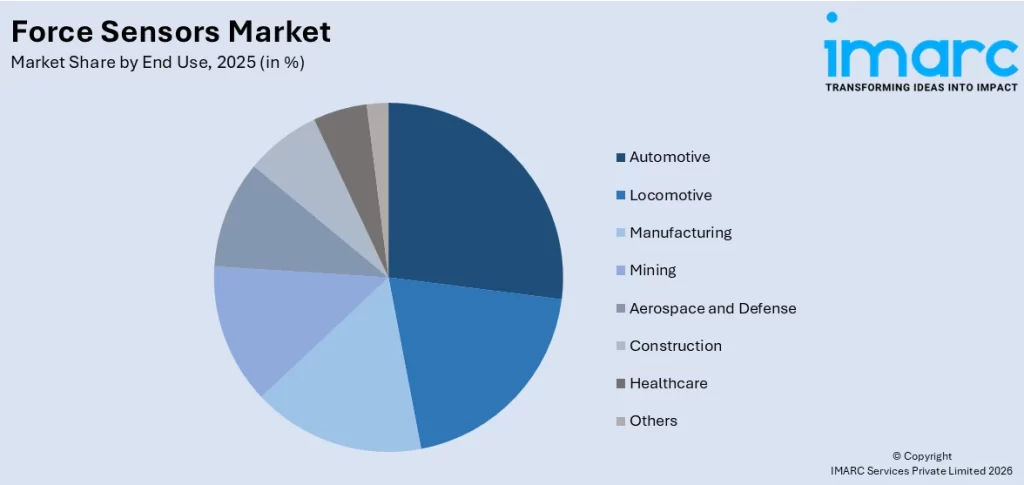
Automotive exhibits a clear dominance in the market
A detailed breakup and analysis of the market based on the end use have also been provided in the report. This includes automotive, locomotive, manufacturing, mining, aerospace and defense, construction, healthcare, and others. According to the report, automotive accounted for the largest market share.
Force sensors play a pivotal role in the automotive industry for various applications, including vehicle testing, quality control in manufacturing, and safety systems. In automotive testing, force sensors are used to measure parameters, such as brake pedal force, steering effort, and crash test impacts, providing critical data for performance optimization and safety assessment. In manufacturing processes, force sensors contribute to ensuring the precision and reliability of assembly operations, enhancing the overall quality of automotive components. Additionally, advancements in electric vehicles (EVs) and autonomous driving technologies are driving the demand for force sensors in the automotive sector, solidifying its position as a dominant end-use segment.
Force sensors are integral to aerospace applications, including aircraft testing, structural health monitoring, and space exploration. In aircraft testing, force sensors measure loads and stresses on components during flight, contributing to the design and maintenance of aircraft structures. In defense applications, force sensors play a crucial role in systems, such as missile guidance, munitions testing, and vehicle dynamics.
Manufacturing is a key end-use segment for force sensors, encompassing a broad range of industries, such as electronics, machinery, and consumer goods production. In manufacturing processes, force sensors are employed for quality control, assembly line optimization, and monitoring of robotic and automated systems. The versatility of force sensors makes them essential in addressing diverse force measurement needs across different manufacturing sectors, ranging from heavy machinery to delicate precision instruments.
Force sensors play a vital role in monitoring the forces exerted on mining equipment, such as crushers, conveyors, and drilling machines, contributing to maintenance planning and preventing equipment failures. Additionally, force sensors are utilized in safety systems, such as roof support systems in underground mining, where accurate force measurements are critical for ensuring the stability of structures.
Force sensors play a crucial role in ensuring the proper functioning of locomotive or braking systems by measuring the force applied to brake components, contributing to the safety and efficiency of rail transport. In track monitoring, force sensors are used to detect and analyze forces exerted on the tracks, helping to identify potential issues and prevent derailments.
Breakup by Region:
- North America
- United States
- Canada
- Asia-Pacific
- China
- Japan
- India
- South Korea
- Australia
- Indonesia
- Others
- Europe
- Germany
- France
- United Kingdom
- Italy
- Spain
- Russia
- Others
- Latin America
- Brazil
- Mexico
- Others
- Middle East and Africa
Asia Pacific leads the market, accounting for the largest force sensors market share
The market research report has also provided a comprehensive analysis of all the major regional markets, which include North America (the United States and Canada); Asia Pacific (China, Japan, India, South Korea, Australia, Indonesia, and others); Europe (Germany, France, the United Kingdom, Italy, Spain, Russia, and others); Latin America (Brazil, Mexico, and others); and the Middle East and Africa. According to the report, Asia Pacific accounted for the largest market share.
The Asia Pacific force sensors software market is driven by the focus on smart manufacturing and Industry 4.0 initiatives. Additionally, the increasing demand for electric vehicles (EVs) and other advanced safety systems is propelling the growth of the market. With a strong emphasis on research and development (R&D), the region witnesses continuous innovation in force sensor technology. The development of advanced sensors with improved accuracy, sensitivity, and integration capabilities is contributing to the market growth.
North America maintains a strong presence driven by the increasing demand for force sensors in developing advanced safety features, precision control systems, and efficient manufacturing processes.
Europe stands as another key region in the market, driven by the increasing need for accurate and reliable measurements to meet stringent quality standards.
Latin America exhibits growing potential in the force sensors market, fueled by the increasing use of force sensors for ensuring the efficiency and quality of manufacturing processes.
The Middle East and Africa region show a developing market for force sensors, primarily driven by the increasing demand for ensuring the efficiency and safety of operations in the oil and gas sector.
Leading Key Players in the Force Sensors Industry:
Key players are actively engaged in strategic initiatives to strengthen their market position. This includes continuous research and development (R&D) to introduce innovative sensor technologies, enhancing sensitivity and precision. Top companies focus on expanding their product portfolios to cater to diverse industry needs, incorporating advanced materials and smart sensor features. Strategic partnerships and collaborations with technology providers and end-users also play a crucial role, facilitating the integration of force sensors into various applications. Additionally, global players are exploring market expansion opportunities in emerging regions, capitalizing on the increasing demand for force sensors in industries, such as automotive, manufacturing, healthcare, and aerospace.
The market research report has provided a comprehensive analysis of the competitive landscape. Detailed profiles of all major companies have also been provided. Some of the key players in the market include:
- Alps Alpine Co., Ltd
- Flintec
- FUTEK Advanced Sensor Technology, Inc
- Honeywell International Inc
- Hottinger Brüel & Kjær
- Interlink Electronics, Inc
- PPS UK Limited
- Qorvo, Inc
- Sensata Technologies, Inc
- Tangio Printed Electronics
- Tekscan, Inc.
Force Sensors Market Report Scope:
| Report Features | Details |
|---|---|
| Base Year of the Analysis | 2025 |
| Historical Period | 2020-2025 |
| Forecast Period | 2026-2034 |
| Units | Billion USD |
| Scope of the Report | Exploration of Historical Trends and Market Outlook, Industry Catalysts and Challenges, Segment-Wise Historical and Future Market Assessment:
|
| Sensing Technologies Covered | Strain Gauge, Load Cell, Force Sensitive Resistors, Others |
| Force Types Covered | Compression, Tension, Compression and Tension |
| Operations Covered | Analog, Digital |
| End Uses Covered | Automotive, Locomotive, Manufacturing, Mining, Aerospace and Defense, Construction, Healthcare, Others |
| Regions Covered | Asia Pacific, Europe, North America, Latin America, Middle East and Africa |
| Countries Covered | United States, Canada, Germany, France, United Kingdom, Italy, Spain, Russia, China, Japan, India, South Korea, Australia, Indonesia, Brazil, Mexico |
| Companies Covered | Alps Alpine Co., Ltd, Flintec, FUTEK Advanced Sensor Technology, Inc, Honeywell International Inc, Hottinger Brüel & Kjær, Interlink Electronics, Inc, PPS UK Limited, Qorvo, Inc, Sensata Technologies, Inc, Tangio Printed Electronics, Tekscan, Inc., etc. |
| Customization Scope | 10% Free Customization |
| Post-Sale Analyst Support | 10-12 Weeks |
| Delivery Format | PDF and Excel through Email (We can also provide the editable version of the report in PPT/Word format on special request) |
Key Questions Answered in This Report
- What was the size of the global force sensors market in 2025?
- What is the expected growth rate of the global force sensors market during 2026-2034?
- What are the key factors driving the global force sensors market?
- What has been the impact of COVID-19 on the global force sensors market?
- What is the breakup of the global force sensors market based on the sensing technology?
- What is the breakup of the global force sensors market based on the force type?
- What is the breakup of the global force sensors market based on the operation?
- What is the breakup of the global force sensors market based on the end use?
- What are the key regions in the global force sensors market?
- Who are the key players/companies in the global force sensors market?
Table of Contents
1 Preface
2 Scope and Methodology
2.1 Objectives of the Study
2.2 Stakeholders
2.3 Data Sources
2.3.1 Primary Sources
2.3.2 Secondary Sources
2.4 Market Estimation
2.4.1 Bottom-Up Approach
2.4.2 Top-Down Approach
2.5 Forecasting Methodology
3 Executive Summary
4 Introduction
4.1 Overview
4.2 Key Industry Trends
5 Global Force Sensors Market
5.1 Market Overview
5.2 Market Performance
5.3 Impact of COVID-19
5.4 Market Forecast
6 Market Breakup by Sensing Technology
6.1 Strain Gauge
6.1.1 Market Trends
6.1.2 Market Forecast
6.2 Load Cell
6.2.1 Market Trends
6.2.2 Market Forecast
6.3 Force Sensitive Resistors
6.3.1 Market Trends
6.3.2 Market Forecast
6.4 Others
6.4.1 Market Trends
6.4.2 Market Forecast
7 Market Breakup by Force Type
7.1 Compression
7.1.1 Market Trends
7.1.2 Market Forecast
7.2 Tension
7.2.1 Market Trends
7.2.2 Market Forecast
7.3 Compression and Tension
7.3.1 Market Trends
7.3.2 Market Forecast
8 Market Breakup by Operation
8.1 Analog
8.1.1 Market Trends
8.1.2 Market Forecast
8.2 Digital
8.2.1 Market Trends
8.2.2 Market Forecast
9 Market Breakup by End Use
9.1 Automotive
9.1.1 Market Trends
9.1.2 Market Forecast
9.2 Locomotive
9.2.1 Market Trends
9.2.2 Market Forecast
9.3 Manufacturing
9.3.1 Market Trends
9.3.2 Market Forecast
9.4 Mining
9.4.1 Market Trends
9.4.2 Market Forecast
9.5 Aerospace and Defense
9.5.1 Market Trends
9.5.2 Market Forecast
9.6 Construction
9.6.1 Market Trends
9.6.2 Market Forecast
9.7 Healthcare
9.7.1 Market Trends
9.7.2 Market Forecast
9.8 Others
9.8.1 Market Trends
9.8.2 Market Forecast
10 Market Breakup by Region
10.1 North America
10.1.1 United States
10.1.1.1 Market Trends
10.1.1.2 Market Forecast
10.1.2 Canada
10.1.2.1 Market Trends
10.1.2.2 Market Forecast
10.2 Asia-Pacific
10.2.1 China
10.2.1.1 Market Trends
10.2.1.2 Market Forecast
10.2.2 Japan
10.2.2.1 Market Trends
10.2.2.2 Market Forecast
10.2.3 India
10.2.3.1 Market Trends
10.2.3.2 Market Forecast
10.2.4 South Korea
10.2.4.1 Market Trends
10.2.4.2 Market Forecast
10.2.5 Australia
10.2.5.1 Market Trends
10.2.5.2 Market Forecast
10.2.6 Indonesia
10.2.6.1 Market Trends
10.2.6.2 Market Forecast
10.2.7 Others
10.2.7.1 Market Trends
10.2.7.2 Market Forecast
10.3 Europe
10.3.1 Germany
10.3.1.1 Market Trends
10.3.1.2 Market Forecast
10.3.2 France
10.3.2.1 Market Trends
10.3.2.2 Market Forecast
10.3.3 United Kingdom
10.3.3.1 Market Trends
10.3.3.2 Market Forecast
10.3.4 Italy
10.3.4.1 Market Trends
10.3.4.2 Market Forecast
10.3.5 Spain
10.3.5.1 Market Trends
10.3.5.2 Market Forecast
10.3.6 Russia
10.3.6.1 Market Trends
10.3.6.2 Market Forecast
10.3.7 Others
10.3.7.1 Market Trends
10.3.7.2 Market Forecast
10.4 Latin America
10.4.1 Brazil
10.4.1.1 Market Trends
10.4.1.2 Market Forecast
10.4.2 Mexico
10.4.2.1 Market Trends
10.4.2.2 Market Forecast
10.4.3 Others
10.4.3.1 Market Trends
10.4.3.2 Market Forecast
10.5 Middle East and Africa
10.5.1 Market Trends
10.5.2 Market Breakup by Country
10.5.3 Market Forecast
11 SWOT Analysis
11.1 Overview
11.2 Strengths
11.3 Weaknesses
11.4 Opportunities
11.5 Threats
12 Value Chain Analysis
13 Porters Five Forces Analysis
13.1 Overview
13.2 Bargaining Power of Buyers
13.3 Bargaining Power of Suppliers
13.4 Degree of Competition
13.5 Threat of New Entrants
13.6 Threat of Substitutes
14 Price Analysis
15 Competitive Landscape
15.1 Market Structure
15.2 Key Players
15.3 Profiles of Key Players
15.3.1 Alps Alpine Co., Ltd
15.3.1.1 Company Overview
15.3.1.2 Product Portfolio
15.3.1.3 Financials
15.3.1.4 SWOT Analysis
15.3.2 Flintec
15.3.2.1 Company Overview
15.3.2.2 Product Portfolio
15.3.2.3 Financials
15.3.2.4 SWOT Analysis
15.3.3 FUTEK Advanced Sensor Technology, Inc
15.3.3.1 Company Overview
15.3.3.2 Product Portfolio
15.3.4 Honeywell International Inc
15.3.4.1 Company Overview
15.3.4.2 Product Portfolio
15.3.4.3 Financials
15.3.4.4 SWOT Analysis
15.3.5 Hottinger Brüel & Kjær
15.3.5.1 Company Overview
15.3.5.2 Product Portfolio
15.3.6 Interlink Electronics, Inc
15.3.6.1 Company Overview
15.3.6.2 Product Portfolio
15.3.6.3 Financials
15.3.7 PPS UK Limited
15.3.7.1 Company Overview
15.3.7.2 Product Portfolio
15.3.7.3 Financials
15.3.7.4 SWOT Analysis
15.3.8 Qorvo, Inc
15.3.8.1 Company Overview
15.3.8.2 Product Portfolio
15.3.9 Sensata Technologies, Inc
15.3.9.1 Company Overview
15.3.9.2 Product Portfolio
15.3.10 Tangio Printed Electronics
15.3.10.1 Company Overview
15.3.10.2 Product Portfolio
15.3.11 Tekscan, Inc.
15.3.11.1 Company Overview
15.3.11.2 Product Portfolio
List of Tables
Table 1: Global: Force Sensors Market: Key Industry Highlights, 2025 and 2034
Table 2: Global: Force Sensors Market Forecast: Breakup by Sensing Technology (in Million USD), 2026-2034
Table 3: Global: Force Sensors Market Forecast: Breakup by Force Type (in Million USD), 2026-2034
Table 4: Global: Force Sensors Market Forecast: Breakup by Operation (in Million USD), 2026-2034
Table 5: Global: Force Sensors Market Forecast: Breakup by End Use (in Million USD), 2026-2034
Table 6: Global: Force Sensors Market Forecast: Breakup by Region (in Million USD), 2026-2034
Table 7: Global: Force Sensors Market: Competitive Structure
Table 8: Global: Force Sensors Market: Key Players
List of Figures
Figure 1: Global: Force Sensors Market: Major Drivers and Challenges
Figure 2: Global: Force Sensors Market: Sales Value (in Billion USD), 2020-2025
Figure 3: Global: Force Sensors Market Forecast: Sales Value (in Billion USD), 2026-2034
Figure 4: Global: Force Sensors Market: Breakup by Sensing Technology (in %), 2025
Figure 5: Global: Force Sensors Market: Breakup by Force Type (in %), 2025
Figure 6: Global: Force Sensors Market: Breakup by Operation (in %), 2025
Figure 7: Global: Force Sensors Market: Breakup by End Use (in %), 2025
Figure 8: Global: Force Sensors Market: Breakup by Region (in %), 2025
Figure 9: Global: Force Sensors (Strain Gauge) Market: Sales Value (in Million USD), 2020 & 2025
Figure 10: Global: Force Sensors (Strain Gauge) Market Forecast: Sales Value (in Million USD), 2026-2034
Figure 11: Global: Force Sensors (Load Cell) Market: Sales Value (in Million USD), 2020 & 2025
Figure 12: Global: Force Sensors (Load Cell) Market Forecast: Sales Value (in Million USD), 2026-2034
Figure 13: Global: Force Sensors (Force Sensitive Resistors) Market: Sales Value (in Million USD), 2020 & 2025
Figure 14: Global: Force Sensors (Force Sensitive Resistors) Market Forecast: Sales Value (in Million USD), 2026-2034
Figure 15: Global: Force Sensors (Other Sensing Technologies) Market: Sales Value (in Million USD), 2020 & 2025
Figure 16: Global: Force Sensors (Other Sensing Technologies) Market Forecast: Sales Value (in Million USD), 2026-2034
Figure 17: Global: Force Sensors (Compression) Market: Sales Value (in Million USD), 2020 & 2025
Figure 18: Global: Force Sensors (Compression) Market Forecast: Sales Value (in Million USD), 2026-2034
Figure 19: Global: Force Sensors (Tension) Market: Sales Value (in Million USD), 2020 & 2025
Figure 20: Global: Force Sensors (Tension) Market Forecast: Sales Value (in Million USD), 2026-2034
Figure 21: Global: Force Sensors (Compression and Tension) Market: Sales Value (in Million USD), 2020 & 2025
Figure 22: Global: Force Sensors (Compression and Tension) Market Forecast: Sales Value (in Million USD), 2026-2034
Figure 23: Global: Force Sensors (Analog) Market: Sales Value (in Million USD), 2020 & 2025
Figure 24: Global: Force Sensors (Analog) Market Forecast: Sales Value (in Million USD), 2026-2034
Figure 25: Global: Force Sensors (Digital) Market: Sales Value (in Million USD), 2020 & 2025
Figure 26: Global: Force Sensors (Digital) Market Forecast: Sales Value (in Million USD), 2026-2034
Figure 27: Global: Force Sensors (Automotive) Market: Sales Value (in Million USD), 2020 & 2025
Figure 28: Global: Force Sensors (Automotive) Market Forecast: Sales Value (in Million USD), 2026-2034
Figure 29: Global: Force Sensors (Locomotive) Market: Sales Value (in Million USD), 2020 & 2025
Figure 30: Global: Force Sensors (Locomotive) Market Forecast: Sales Value (in Million USD), 2026-2034
Figure 31: Global: Force Sensors (Manufacturing) Market: Sales Value (in Million USD), 2020 & 2025
Figure 32: Global: Force Sensors (Manufacturing) Market Forecast: Sales Value (in Million USD), 2026-2034
Figure 33: Global: Force Sensors (Mining) Market: Sales Value (in Million USD), 2020 & 2025
Figure 34: Global: Force Sensors (Mining) Market Forecast: Sales Value (in Million USD), 2026-2034
Figure 35: Global: Force Sensors (Aerospace and Defense) Market: Sales Value (in Million USD), 2020 & 2025
Figure 36: Global: Force Sensors (Aerospace and Defense) Market Forecast: Sales Value (in Million USD), 2026-2034
Figure 37: Global: Force Sensors (Construction) Market: Sales Value (in Million USD), 2020 & 2025
Figure 38: Global: Force Sensors (Construction) Market Forecast: Sales Value (in Million USD), 2026-2034
Figure 39: Global: Force Sensors (Healthcare) Market: Sales Value (in Million USD), 2020 & 2025
Figure 40: Global: Force Sensors (Healthcare) Market Forecast: Sales Value (in Million USD), 2026-2034
Figure 41: Global: Force Sensors (Other End Uses) Market: Sales Value (in Million USD), 2020 & 2025
Figure 42: Global: Force Sensors (Other End Uses) Market Forecast: Sales Value (in Million USD), 2026-2034
Figure 43: North America: Force Sensors Market: Sales Value (in Million USD), 2020 & 2025
Figure 44: North America: Force Sensors Market Forecast: Sales Value (in Million USD), 2026-2034
Figure 45: United States: Force Sensors Market: Sales Value (in Million USD), 2020 & 2025
Figure 46: United States: Force Sensors Market Forecast: Sales Value (in Million USD), 2026-2034
Figure 47: Canada: Force Sensors Market: Sales Value (in Million USD), 2020 & 2025
Figure 48: Canada: Force Sensors Market Forecast: Sales Value (in Million USD), 2026-2034
Figure 49: Asia-Pacific: Force Sensors Market: Sales Value (in Million USD), 2020 & 2025
Figure 50: Asia-Pacific: Force Sensors Market Forecast: Sales Value (in Million USD), 2026-2034
Figure 51: China: Force Sensors Market: Sales Value (in Million USD), 2020 & 2025
Figure 52: China: Force Sensors Market Forecast: Sales Value (in Million USD), 2026-2034
Figure 53: Japan: Force Sensors Market: Sales Value (in Million USD), 2020 & 2025
Figure 54: Japan: Force Sensors Market Forecast: Sales Value (in Million USD), 2026-2034
Figure 55: India: Force Sensors Market: Sales Value (in Million USD), 2020 & 2025
Figure 56: India: Force Sensors Market Forecast: Sales Value (in Million USD), 2026-2034
Figure 57: South Korea: Force Sensors Market: Sales Value (in Million USD), 2020 & 2025
Figure 58: South Korea: Force Sensors Market Forecast: Sales Value (in Million USD), 2026-2034
Figure 59: Australia: Force Sensors Market: Sales Value (in Million USD), 2020 & 2025
Figure 60: Australia: Force Sensors Market Forecast: Sales Value (in Million USD), 2026-2034
Figure 61: Indonesia: Force Sensors Market: Sales Value (in Million USD), 2020 & 2025
Figure 62: Indonesia: Force Sensors Market Forecast: Sales Value (in Million USD), 2026-2034
Figure 63: Others: Force Sensors Market: Sales Value (in Million USD), 2020 & 2025
Figure 64: Others: Force Sensors Market Forecast: Sales Value (in Million USD), 2026-2034
Figure 65: Europe: Force Sensors Market: Sales Value (in Million USD), 2020 & 2025
Figure 66: Europe: Force Sensors Market Forecast: Sales Value (in Million USD), 2026-2034
Figure 67: Germany: Force Sensors Market: Sales Value (in Million USD), 2020 & 2025
Figure 68: Germany: Force Sensors Market Forecast: Sales Value (in Million USD), 2026-2034
Figure 69: France: Force Sensors Market: Sales Value (in Million USD), 2020 & 2025
Figure 70: France: Force Sensors Market Forecast: Sales Value (in Million USD), 2026-2034
Figure 71: United Kingdom: Force Sensors Market: Sales Value (in Million USD), 2020 & 2025
Figure 72: United Kingdom: Force Sensors Market Forecast: Sales Value (in Million USD), 2026-2034
Figure 73: Italy: Force Sensors Market: Sales Value (in Million USD), 2020 & 2025
Figure 74: Italy: Force Sensors Market Forecast: Sales Value (in Million USD), 2026-2034
Figure 75: Spain: Force Sensors Market: Sales Value (in Million USD), 2020 & 2025
Figure 76: Spain: Force Sensors Market Forecast: Sales Value (in Million USD), 2026-2034
Figure 77: Russia: Force Sensors Market: Sales Value (in Million USD), 2020 & 2025
Figure 78: Russia: Force Sensors Market Forecast: Sales Value (in Million USD), 2026-2034
Figure 79: Others: Force Sensors Market: Sales Value (in Million USD), 2020 & 2025
Figure 80: Others: Force Sensors Market Forecast: Sales Value (in Million USD), 2026-2034
Figure 81: Latin America: Force Sensors Market: Sales Value (in Million USD), 2020 & 2025
Figure 82: Latin America: Force Sensors Market Forecast: Sales Value (in Million USD), 2026-2034
Figure 83: Brazil: Force Sensors Market: Sales Value (in Million USD), 2020 & 2025
Figure 84: Brazil: Force Sensors Market Forecast: Sales Value (in Million USD), 2026-2034
Figure 85: Mexico: Force Sensors Market: Sales Value (in Million USD), 2020 & 2025
Figure 86: Mexico: Force Sensors Market Forecast: Sales Value (in Million USD), 2026-2034
Figure 87: Others: Force Sensors Market: Sales Value (in Million USD), 2020 & 2025
Figure 88: Others: Force Sensors Market Forecast: Sales Value (in Million USD), 2026-2034
Figure 89: Middle East and Africa: Force Sensors Market: Sales Value (in Million USD), 2020 & 2025
Figure 90: Middle East and Africa: Force Sensors Market: Breakup by Country (in %), 2025
Figure 91: Middle East and Africa: Force Sensors Market Forecast: Sales Value (in Million USD), 2026-2034
Figure 92: Global: Force Sensors Industry: SWOT Analysis
Figure 93: Global: Force Sensors Industry: Value Chain Analysis
Figure 94: Global: Force Sensors Industry: Porter’s Five Forces Analysis