子供向けエンターテイメントセンター市場の規模、シェア、トレンド、予測 : 来場者層、施設規模、収益源、活動分野、地域別)、2026-2034年
Children’s Entertainment Centers Market Size, Share, Trends and Forecast by Visitor Demographics, Facility Size, Revenue Source, Activity Area, and Region, 2026-2034
| 出版 | IMARC Group |
| 出版年月 | 2026年03月 |
| ページ数 | 146 |
| 価格 | 記載以外のライセンスについてはお問合せください |
| シングルユーザ | USD 3,999 |
| 種別 | 英文調査報告書 |
| 商品番号 | SMR-1592515925 |

世界の子供向けエンターテイメントセンター市場規模は、2025年には138億米ドルと評価されました。IMARCグループは、今後、市場規模は2034年までに243億米ドルに達し、2026年から2034年にかけて年平均成長率(CAGR)6.53%を示すと予測しています。現在、アジア太平洋地域が市場を牽引しており、2025年には33.7%という大きな市場シェアを占めています。子供向けエンターテイメントセンターの市場シェアは、フランチャイズセンター、技術革新、屋内施設の増加により拡大しています。フランチャイズブランドは標準化された体験を提供し、リピーターを引き付け、市場での存在感を高めています。さらに、仮想現実(VR)や拡張現実(AR)などの先進技術はエンゲージメントを高め、顧客維持を促進します。
主要ブランドは複数の場所に展開し、家族や子供たちに標準化されたサービスと質の高い体験を提供しています。フランチャイズモデルは迅速な市場浸透を可能にし、事業運営リスクを軽減しながら効率的な事業拡大を支援します。知名度の高いブランドは顧客の信頼を集め、さまざまな地域での来場者数とリピート来場を促進します。ブランド化されたエンターテイメントセンターは革新的なテーマを取り入れ、独立した施設とは一線を画す独自の魅力的なアトラクションを提供しています。企業は高度なテクノロジーに投資し、仮想現実、拡張現実、インタラクティブなゲーム体験を取り入れることで顧客エンゲージメントを高めています。ショッピングモールや小売複合施設との戦略的パートナーシップによりアクセス性が向上し、全体的な来場者数が増加します。標準化された安全プロトコルと子供向けのデザインは親を安心させ、顧客ロイヤルティと顧客維持を促進します。会員プログラムとロイヤルティ特典は頻繁な来場を促し、フランチャイズセンターの持続的な収益成長を保証します。運営者はターゲットを絞ったマーケティングキャンペーンを実施し、デジタルプラットフォームとソーシャルメディアを活用して潜在顧客とのエンゲージメントを高めています。グローバル展開戦略は高成長地域に焦点を当て、構造化されたエンターテイメントに対する需要の高まりを捉え、市場の成長をさらに強化しています。
Report Overview
The global children’s entertainment centers market size was valued at USD 13.8 Billion in 2025. Looking forward, IMARC Group estimates the market to reach USD 24.3 Billion by 2034, exhibiting a CAGR of 6.53% during 2026-2034. Asia Pacific currently dominates the market, holding a significant market share of 33.7% in 2025 . The children’s entertainment centers market share is expanding due to franchised centers, technological advancements, and indoor facility growth. Franchised brands ensure standardized experiences, attracting repeat visitors and improving market presence. Moreover, advanced technologies like virtual reality (VR) and augmented reality (AR) enhance engagement, driving customer retention.

children’s entertainment centers market
Leading brands are established in multiple locations, ensuring standardized services and high-quality experiences for families and children. Franchise models allow rapid market penetration, helping businesses expand efficiently with reduced operational risks. Well-known brands attract customer trust, encouraging higher footfall and repeat visits across different regions. Branded entertainment centers integrate innovative themes, offering unique attractions that differentiate them from independent facilities. Companies invest in advanced technology, incorporating virtual reality, augmented reality, and interactive gaming experiences to enhance engagement. Strategic partnerships with shopping malls and retail complexes increase accessibility, improving overall visitor traffic. Standardized safety protocols and child-friendly designs reassure parents, promoting loyalty and customer retention. Membership programs and loyalty rewards encourage frequent visits, ensuring sustained revenue growth for franchised centers. Operators implement targeted marketing campaigns, leveraging digital platforms and social media to engage potential customers. Global expansion strategies focus on high-growth regions, tapping into rising demand for structured entertainment, further strengthening the market growth.
The expansion of indoor entertainment facilities is significantly driving the United States children’s entertainment centers market demand. Developers are creating diverse play zones, integrating interactive games, adventure courses, and educational activities for children. Rising demand for year-round entertainment options has led to increased investment in climate-controlled indoor amusement centers nationwide. Shopping malls and commercial complexes are incorporating entertainment centers, enhancing foot traffic and customer engagement. Urbanization is increasing the number of high-rise residential areas, driving demand for conveniently located indoor play spaces. Parents prefer these centers for safety, structured play, and supervised activities, leading to repeat visits and memberships. In October 2024, Five Star Parks completed a $500,000 renovation of Scene75 Chicagoland in Romeoville, Illinois. The 135,000 sq. ft. facility now features a 15,000 sq. ft. Slide Zone with three mega-slides, a zip rail, and air courts. A 5,000 sq. ft. Play Scene has been added for younger children, enhancing family entertainment experiences. Advanced themes including virtual reality zones and digital play areas, further increase attraction and engagement. Indoor trampoline parks, climbing walls, and obstacle courses promote physical fitness, supporting healthier lifestyles. Additionally, birthday party bookings are rising as families seek hassle-free, weather-independent celebration venues with interactive activities.
CHILDREN’S ENTERTAINMENT CENTERS MARKET TRENDS:
Growing population
The growing population is increasing demand for children’s entertainment centers by expanding the customer base. More children require engaging recreational spaces, catalyzing the need for interactive play areas and attractions. Rising birth rates contribute to larger family sizes, increasing visits to entertainment centers for leisure. Urbanization is accelerating this trend, with the World Health Organization estimating that over 55% of the global population currently lives in urban areas, a figure expected to reach 68% by 2050. Expanding urban areas accommodate more families, leading to higher footfall in amusement and edutainment centers. Higher population density in cities encourages the development of multi-functional entertainment zones with advanced features. Parents seek safe, structured environments for kids, driving investments in modern entertainment facilities. Entertainment centers integrate physical activities, digital games, and learning experiences to attract larger, diverse audiences. Demand for birthday party venues rises with more children, increasing revenue for entertainment centers globally. Developers expand locations in high-population regions to capitalize on growing demand for recreational activities. Government initiatives promoting child-friendly infrastructure further supports the establishment of entertainment centers nationwide. The rising number of working parents encourages demand for supervised play areas in entertainment centers. Businesses invest in innovative themes and activities to cater to an expanding children’s demographic.
Technological advancements
Technological advancements are transforming children’s entertainment centers by enhancing interactivity, engagement, and overall user experience. Virtual reality (VR) and augmented reality (AR) create immersive environments, attracting children with innovative digital interactions. According to IMARC Group, the global AR gaming market, valued at USD 14.2 billion in 2024, is expected to reach USD 141.7 billion by 2033, expanding at a CAGR of 25.9% from 2025 to 2033. This rapid growth reflects increasing adoption of AR-based attractions in entertainment centers, making experiences more engaging. Smart play areas incorporate artificial intelligence (AI)-driven games, making activities more personalized and adaptive to children’s preferences. Motion-sensing technology enables touchless gaming experiences, ensuring hygiene and seamless interaction in entertainment centers. Gamification trends introduce educational elements, blending learning with entertainment to appeal to both parents and children. Interactive digital walls and floors enhance creativity, allowing children to engage in dynamic, immersive play activities. Advanced simulation games provide realistic experiences, making entertainment centers more appealing for frequent visits. Mobile applications enable seamless booking, personalized recommendations, and loyalty programs, improving customer convenience and engagement. RFID-based wristbands offer secure, contactless payments, enhancing safety and ease of transactions within entertainment centers. Smart monitoring systems with AI-powered surveillance ensure child safety, providing real-time updates to parents.
Rising demand for toddler-focused play zones
Rising demand for toddler-focused play zones is significantly driving the children’s entertainment centers market outlook. Parents prefer safe, age-appropriate environments where toddlers can explore, interact, and develop essential motor skills. Soft play areas with padded structures ensure safety, making them attractive to families with young children. Sensory play zones with interactive elements enhance cognitive development, enhancing engagement and visitor retention. Educational play areas introduce toddlers to basic learning concepts, appealing to parents seeking developmental activities. Indoor playgrounds with themed environments create immersive experiences, encouraging repeat visits from families. Recognizing this trend, KidZania launched India’s first toddler-centric play zone, KidZania Neighborhood, at its Delhi/NCR center in May 2024. Spanning 3,500 sq. ft., the zone features interactive activities like a Science Lab, Play Gym, and Construction Site, promoting early childhood development through role-play, storytelling, and motor skill enhancement. Shopping malls integrate toddler-friendly play zones, increasing foot traffic and overall customer dwell time. Entertainment centers offer structured toddler activities like storytelling sessions, puppet shows, and musical playtime. Franchise brands expand toddler-specific play areas, ensuring standardized safety measures and quality experiences. Health-conscious parents prefer active play zones, promoting physical activity and social interaction from an early age.
Children’s Entertainment Centers Market Report Scope:
| Report Features | Details |
|---|---|
| Base Year of the Analysis | 2025 |
| Historical Period | 2020-2025 |
| Forecast Period | 2026-2034 |
| Units | Billion USD |
| Scope of the Report | Exploration of Historical Trends and Market Outlook, Industry Catalysts and Challenges, Segment-Wise Historical and Future Market Assessment:
|
| Visitors Demographics Covered | Families with Children (0-9), Families with Children (9-12), Teenagers (12-18), Young Adults (18-24), Adults (Ages 24+) |
| Facility Sizes Covered | Up to 5,000 Sq. Ft., 5,001 to 10,000 Sq. Ft., 10,001 to 20,000 Sq. Ft., 20,001 to 40,000 Sq. Ft., 1 to 10 Acres, 11 to 30 Acres, Over 30 Acres |
| Revenue Sources Covered | Entry Fees and Ticket Sales, Food and Beverages, Merchandising, Advertisement, Others |
| Activity Areas Covered | Arcade Studios, AR and VR Gaming Zones, Physical Play Activities, Skill/Competition Games, Others |
| Regions Covered | North America, Asia Pacific, Europe, Latin America, Middle East and Africa |
| Countries Covered | United States, Canada, Germany, France, United Kingdom, Italy, Spain, Russia, China, Japan, India, South Korea, Australia, Indonesia, Brazil, Mexico |
| Companies Covered | Cinergy Entertainment Group, Dave & Buster’s Inc., Fun City India (Landmark Group), Funriders Leisure & Amusement Pvt. Ltd., KidZania S.A.P.I. de C.V., Lucky Strike Entertainment, Scene75 Entertainment Centers, Smaaash and The Walt Disney Company. |
| Customization Scope | 10% Free Customization |
| Post-Sale Analyst Support | 10-12 Weeks |
| Delivery Format | PDF and Excel through Email (We can also provide the editable version of the report in PPT/Word format on special request) |
CHILDREN’S ENTERTAINMENT CENTERS INDUSTRY SEGMENTATION:
IMARC Group provides an analysis of the key trends in each segment of the global children’s entertainment centers market, along with forecasts at the global, regional, and country levels from 2026-2034. The market has been categorized based on visitor demographics, facility size, revenue source, and activity area.
Analysis by Visitor Demographics:
- Families with Children (0-9)
- Families with Children (9-12)
- Teenagers (12-18)
- Young Adults (18-24)
- Adults (Ages 24+)
Teenagers (12-18) stand as the largest component in 2025, holding 40.2% of the market. They actively seek recreational experiences, preferring social and interactive entertainment options in specialized centers. Gaming zones, virtual reality (VR) attractions, and adventure courses cater to their evolving interests and competitive nature. Teenagers visit entertainment centers frequently, increasing demand for immersive and high-energy activities. Social gatherings and group outings contribute to higher foot traffic, driving revenues for entertainment facilities. Many centers integrate educational and skill-based activities, attracting teenagers interested in creative and intellectual challenges. The rise of esports and competitive gaming makes entertainment centers appealing for teenage audiences. Facilities offering escape rooms, laser tag, and digital sports simulators gain momentum among teenagers. Peer influence plays a significant role in attracting teenagers to entertainment centers for group experiences. Teenagers prefer technologically advanced experiences, encouraging entertainment centers to adopt cutting-edge gaming and simulation technologies. High school events and organized trips contribute to increasing visits from teenage groups.
Analysis by Facility Size:
- Up to 5,000 Sq. Ft.
- 5,001 to 10,000 Sq. Ft.
- 10,001 to 20,000 Sq. Ft.
- 20,001 to 40,000 Sq. Ft.
- 1 to 10 Acres
- 11 to 30 Acres
- Over 30 Acres
Facilities spanning 1 to 10 acres dominate the market with 28.5% of market share in 2025. This size range allows entertainment centers to incorporate diverse attractions without excessive infrastructure costs. Developers prefer medium-sized facilities, as they accommodate a variety of entertainment options efficiently. Centers within this range can feature arcade studios, indoor playgrounds, trampoline parks, and interactive gaming zones. The cost of land and construction remains manageable, ensuring long-term profitability for entertainment center operators. Medium-sized facilities cater to both urban and suburban areas, maximizing accessibility and visitor convenience. Shopping malls and commercial complexes integrate entertainment centers of this size, enhancing customer engagement. These facilities attract families, teenagers, and young adults, ensuring a steady flow of visitors. Developers optimize space utilization, offering diverse entertainment experiences within a compact yet engaging environment. 1 to 10-acre centers efficiently manage staffing and operational expenses, maintaining sustainability and profitability. Franchise brands expand within this size range, ensuring consistency in offerings and customer experience. This segment supports private event bookings, corporate outings, and educational trips, increasing revenue streams, further strengthening market growth.
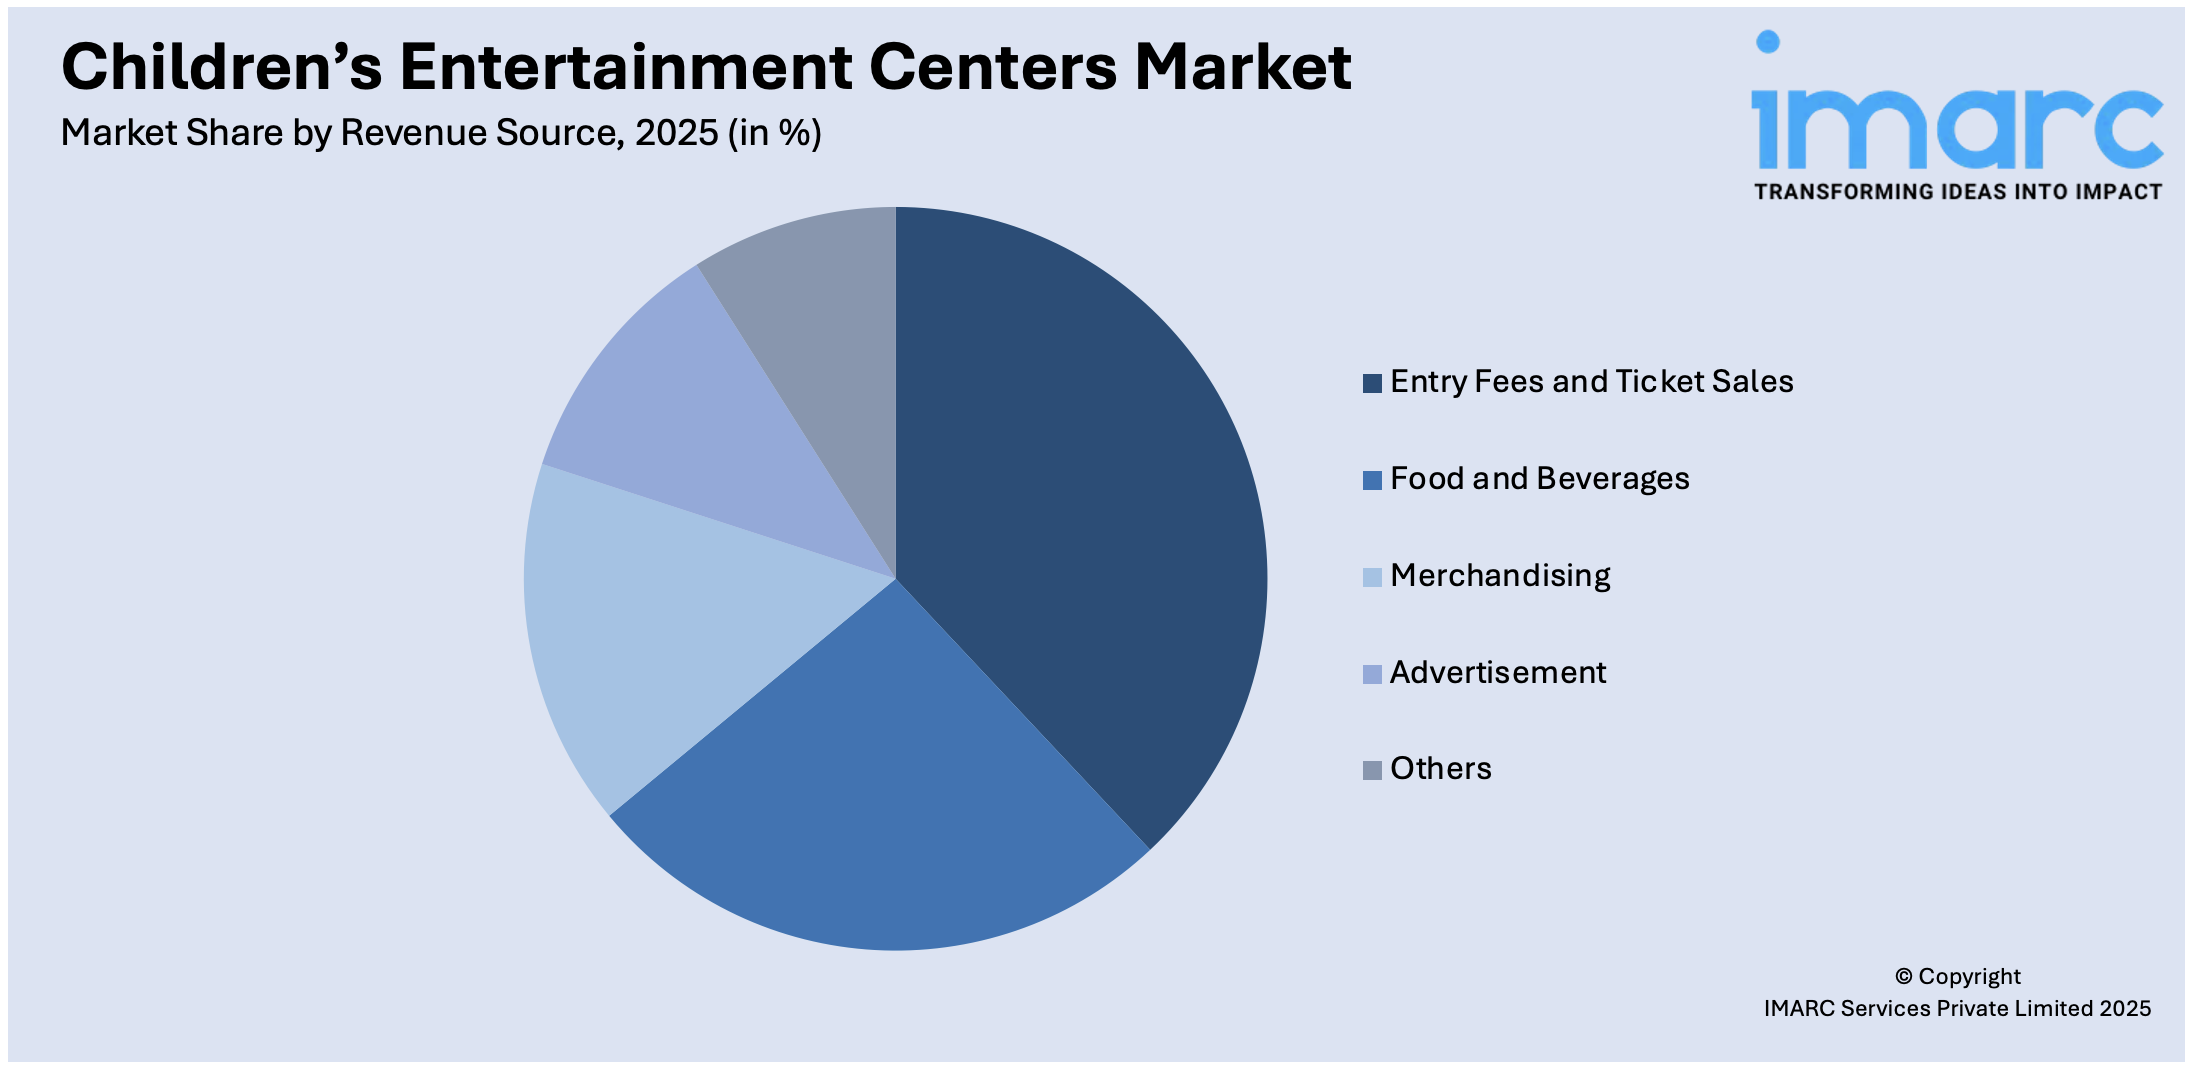
Analysis by Revenue Source:
- Entry Fees and Ticket Sales
- Food and Beverages
- Merchandising
- Advertisement
- Others
Entry fees and ticket sales leads the market with 37.4% of market share in 2025. Most entertainment centers operate on a pay-per-entry model, securing revenue before customer engagement begins. Visitors willingly pay for exclusive attractions including VR experiences, arcade games, and adventure courses. Premium ticketing options offer additional features, enhancing customer experience and increasing revenue per visitor. Tiered pricing strategies such as bundled passes and group discounts, drive higher foot traffic. Families prefer single-entry fees, simplifying costs and ensuring access to multiple entertainment zones. Seasonal promotions and special event tickets contribute to revenue spikes during peak periods. Facilities utilize dynamic pricing models, adjusting entry fees based on demand and visitor flow. Ticket sales remain a primary revenue source, providing predictable income for operators and investors. Online booking platforms streamline ticket sales, enhancing customer convenience and accessibility. Membership and loyalty programs offer discounted entry fees, encouraging repeat visits and long-term customer retention.
Analysis by Activity Area:
- Arcade Studios
- AR and VR Gaming Zones
- Physical Play Activities
- Skill/Competition Games
- Others
Arcade studios represent the largest market with 31.8% of market share in 2025. The trend of classic arcade games, combined with modern innovations, attracts diverse age groups. Arcade studios feature a variety of interactive games, ensuring continuous visitor engagement and excitement. High retention rates result from short gameplay durations, encouraging repeated spending on game credits. Technological advancements enhance arcade experiences, incorporating motion-sensing, virtual reality (VR), and augmented reality (AR) games. Visitors enjoy skill-based games, driving competitive engagement and repeat visits. Prize redemption systems encourage continuous participation, increasing spending per visitor. Family-friendly arcade centers appeal to children, teenagers, and young adults alike. Shopping malls and entertainment complexes integrate arcade studios to improve visitor traffic and dwell time. The affordability of arcade gaming makes it an accessible entertainment option for a broad audience. Operators introduce new game titles regularly, maintaining excitement and encouraging repeat visits. Esports and multiplayer arcade experiences enhance social engagement, attracting group visits.
Regional Analysis:
- North America
o United States
o Canada
- Asia Pacific
o China
o Japan
o India
o South Korea
o Australia
o Indonesia
o Others
- Europe
o Germany
o France
o United Kingdom
o Italy
o Spain
o Russia
o Others
- Latin America
o Brazil
o Mexico
o Others
- Middle East and Africa
In 2025, Asia Pacific accounted for the largest market share of 33.7%. High population density ensures a strong customer base, increasing demand for indoor amusement and recreational facilities. Expanding shopping malls incorporate entertainment centers, enhancing accessibility and increasing visitor footfall across urban regions. Technological advancements including VR and AR gaming, attract tech-savvy younger audiences, accelerating market growth. Government investments in tourism and entertainment infrastructure further support the expansion of amusement facilities. A strong cultural emphasis on family recreation encourages frequent visits to entertainment centers across the region. Large, franchised brands continue expanding, offering innovative attractions tailored to diverse audiences. In January 2025, Pokiddo Junior, a globally recognized brand, opened its first Mumbai location at Raghuvanshi Mills, Lower Parel. Spanning 11,000 square feet, this indoor adventure zone caters to children up to nine years old, featuring engaging activities that enhance fun and creativity. Birthday parties, school excursions, and holiday events contribute significantly to revenue, strengthening market growth. The rapid expansion of digital payment systems ensures seamless transactions, making entertainment centers more accessible. Rising real estate development across South Korea and Singapore enables larger, high-tech centers, solidifying Asia Pacific’s dominance in the global market.
KEY REGIONAL TAKEAWAYS:
UNITED STATES CHILDREN’S ENTERTAINMENT CENTERS MARKET ANALYSIS
The United States hold 76.20% of the market share in North America. The children’s entertainment centers market in the US is experiencing steady growth, driven by rising demand for interactive and immersive experiences. Attractions such as arcade games, indoor play zones, and themed entertainment centers continue to gain momentum. Family-friendly venues including trampoline parks, laser tag arenas, and interactive museums, further support market expansion. The increasing demand for birthday parties and special events hosted at these centers significantly contributes to revenue growth. The U.S. Bureau of Economic Analysis reported a USD 79.7 billion (0.4%) rise in Disposable Personal Income (DPI) and a USD 133.6 billion (0.7%) increase in Personal Consumption Expenditures (PCE). This growth reflects greater financial flexibility for family entertainment spending. With higher disposable income, US families prioritize experiences that combine fun and educational value for their children. Additionally, technological innovations like virtual reality (VR), augmented reality (AR), and escape rooms are attracting a younger, tech-savvy demographic, fueling market expansion. As customers preferences shift toward more customizable and engaging experiences, operators are increasingly investing in digital innovations to meet evolving demands. These factors collectively position the US as a key market for children’s entertainment centers, with continuous advancements expected in the coming years.
NORTH AMERICA CHILDREN’S ENTERTAINMENT CENTERS MARKET ANALYSIS
North America dominates the children’s entertainment centers market due to high disposable incomes and strong demand for family-oriented experiences. The region’s well-developed infrastructure supports large-scale entertainment centers, offering diverse attractions like trampoline parks, arcade studios, and VR gaming zones. The United States and Canada have a high concentration of franchised entertainment brands, ensuring standardized and high-quality experiences. Shopping malls integrate entertainment centers, driving foot traffic and increasing consumer engagement. Parents prioritize indoor play areas that provide educational and interactive experiences, fostering demand for edutainment-based attractions. Advanced technology adoption enhances gaming and simulation experiences, keeping children engaged and encouraging repeat visits. In November 2024, Chuck E. Cheese introduced Adventure Zones, featuring Trampoline Zones and Ninja Run obstacle courses to encourage active play and child development. Initially piloted in select locations, the concept received positive feedback, leading to a planned global rollout in 2025. This expansion aligns with growing consumer preferences for immersive, safe, and engaging experiences that promote children’s physical and cognitive development. Birthday parties, school trips, and corporate-sponsored events contribute significantly to revenue. Increasing urbanization and a preference for organized recreational activities further boost the market, while expanding loyalty programs ensure consistent visitor engagement.
EUROPE CHILDREN’S ENTERTAINMENT CENTERS MARKET ANALYSIS
The European market is experiencing steady growth due to the rising disposable incomes and increasing interest in family-oriented attractions. As families seek novel, interactive, and fun experiences for children, demand for soft play areas, arcades, and indoor amusement parks continues to rise. Trampoline parks and immersive entertainment experiences are also gaining traction, further expanding the market growth. Additionally, rising demand for children’s birthday parties and special events at entertainment centers is contributing to revenue growth. The integration of technology is modernizing offerings, with VR and AR gaming becoming key attractions. The European VR gaming market alone reached USD 8.5 Billion in 2024 and is projected to grow at a CAGR of 14.6%, reaching USD 30.7 Billion by 2033. This surge highlights the increasing appetite for digital and immersive experiences, particularly among tech-savvy families. Moreover, sustainability is becoming a key focus, with families preferring eco-friendly entertainment options, influencing market trends. Operators are responding by incorporating green building materials, energy-efficient designs, and environmentally conscious activities. These evolving customer preferences, along with advancements in digital entertainment, are shaping the future of the European children’s entertainment centers market.
LATIN AMERICA CHILDREN’S ENTERTAINMENT CENTERS MARKET ANALYSIS
The market in Latin American is steadily growing, influenced by rising demand for family-friendly recreational activities. In Brazil, per capita household earnings reached USD 2,069, enabling families to spend more on leisure. This has increased the preference for indoor entertainment options including arcades, soft play areas, and theme parks. Birthday parties and special events at entertainment centers are also gaining momentum, contributing to market expansion. The adoption of interactive technology such as VR, is attracting younger, tech-savvy audiences. As customer spending on leisure activities rises, operators are diversifying their offerings to provide engaging experiences. This trend, combined with growing disposable incomes, is driving the expansion of the Latin American children’s entertainment centers market.
MIDDLE EAST AND AFRICA CHILDREN’S ENTERTAINMENT CENTERS MARKET ANALYSIS
The Middle East and Africa children’s entertainment centers market is expanding, driven by urbanization and rising demand for family-friendly recreational spaces. According to UN-Habitat, urbanization in the region is expected to reach 97.6% by 2030, fueling the need for entertainment venues. Riyadh alone is projected to have a population of 8.2 million, with 75% being Saudis, increasing demand for indoor play areas, trampoline parks, and amusement centers. Families seek engaging experiences, particularly on weekends and holidays, strengthening market growth. The growing preference for special events, digital entertainment, and tech-driven attractions is further shaping industry trends. As urban populations grow, operators are expanding in key cities to meet the rising demand for diverse and immersive children’s entertainment experiences.
COMPETITIVE LANDSCAPE:
Leading companies are integrating virtual reality (VR), augmented reality (AR) and interactive gaming technologies to enhance immersive experiences. Franchised entertainment brands expand their presence, ensuring standardized services and high-quality experiences across multiple locations. Strategic partnerships with malls, shopping complexes, and educational institutions improve accessibility and increase visitor footfall. Companies develop themed entertainment zones, offering unique experiences that encourage repeat visits and improve brand loyalty. Loyalty programs and membership subscriptions further drive frequent visits, ensuring sustained revenue growth for entertainment centers. Safety remains a priority, with businesses implementing advanced surveillance systems and child-friendly facility designs. In January 2025, Dave & Buster’s Inc. launched its first Indian outlet at Mantri Avenue, Bangalore, marking its international debut. Partnering with Malpani Group, the venue features arcade games, social gaming, and bowling. With plans to expand across India, starting with 15 new locations in Mumbai, the brand is tapping into the growing demand for family entertainment centers. Additionally, companies are financing marketing campaigns, utilizing social media and digital platforms to engage target audiences. Sustainable initiatives, such as eco-friendly play structures and energy-efficient operations, further enhance brand reputation and customer appeal.
The report provides a comprehensive analysis of the competitive landscape in the children’s entertainment centers market with detailed profiles of all major companies, including:
- Cinergy Entertainment Group
- Dave & Buster’s Inc.
- Fun City India (Landmark Group)
- Funriders Leisure & Amusement Pvt. Ltd.
- KidZania S.A.P.I. de C.V.
- Lucky Strike Entertainment
- Scene75 Entertainment Centers
- Smaaash
- The Walt Disney Company
KEY QUESTIONS ANSWERED IN THIS REPORT
- How big is the children’s entertainment centers market?
- What is the future outlook of children’s entertainment centers market?
- What are the key factors driving the children’s entertainment centers market?
- Which region accounts for the largest children’s entertainment centers market share?
- Which are the leading companies in the global children’s entertainment centers market?
Table of Contents
1 Preface
2 Scope and Methodology
2.1 Objectives of the Study
2.2 Stakeholders
2.3 Data Sources
2.3.1 Primary Sources
2.3.2 Secondary Sources
2.4 Market Estimation
2.4.1 Bottom-Up Approach
2.4.2 Top-Down Approach
2.5 Forecasting Methodology
3 Executive Summary
4 Introduction
4.1 Overview
4.2 Key Industry Trends
5 Global Children’s Entertainment Centers Market
5.1 Market Overview
5.2 Market Performance
5.3 Impact of COVID-19
5.4 Market Forecast
6 Market Breakup by Visitor Demographics
6.1 Families with Children (0-9)
6.1.1 Market Trends
6.1.2 Market Forecast
6.2 Families with Children (9-12)
6.2.1 Market Trends
6.2.2 Market Forecast
6.3 Teenagers (12-18)
6.3.1 Market Trends
6.3.2 Market Forecast
6.4 Young Adults (18-24)
6.4.1 Market Trends
6.4.2 Market Forecast
6.5 Adults (Ages 24+)
6.5.1 Market Trends
6.5.2 Market Forecast
7 Market Breakup by Facility Size
7.1 Up to 5,000 Sq. Ft.
7.1.1 Market Trends
7.1.2 Market Forecast
7.2 5,001 to 10,000 Sq. Ft.
7.2.1 Market Trends
7.2.2 Market Forecast
7.3 10,001 to 20,000 Sq. Ft.
7.3.1 Market Trends
7.3.2 Market Forecast
7.4 20,001 to 40,000 Sq. Ft.
7.4.1 Market Trends
7.4.2 Market Forecast
7.5 1 to 10 Acres
7.5.1 Market Trends
7.5.2 Market Forecast
7.6 11 to 30 Acres
7.6.1 Market Trends
7.6.2 Market Forecast
7.7 Over 30 Acres
7.7.1 Market Trends
7.7.2 Market Forecast
8 Market Breakup by Revenue Source
8.1 Entry Fees and Ticket Sales
8.1.1 Market Trends
8.1.2 Market Forecast
8.2 Food and Beverages
8.2.1 Market Trends
8.2.2 Market Forecast
8.3 Merchandising
8.3.1 Market Trends
8.3.2 Market Forecast
8.4 Advertisement
8.4.1 Market Trends
8.4.2 Market Forecast
8.5 Others
8.5.1 Market Trends
8.5.2 Market Forecast
9 Market Breakup by Activity Area
9.1 Arcade Studios
9.1.1 Market Trends
9.1.2 Market Forecast
9.2 AR and VR Gaming Zones
9.2.1 Market Trends
9.2.2 Market Forecast
9.3 Physical Play Activities
9.3.1 Market Trends
9.3.2 Market Forecast
9.4 Skill/Competition Games
9.4.1 Market Trends
9.4.2 Market Forecast
9.5 Others
9.5.1 Market Trends
9.5.2 Market Forecast
10 Market Breakup by Region
10.1 North America
10.1.1 United States
10.1.1.1 Market Trends
10.1.1.2 Market Forecast
10.1.2 Canada
10.1.2.1 Market Trends
10.1.2.2 Market Forecast
10.2 Asia-Pacific
10.2.1 China
10.2.1.1 Market Trends
10.2.1.2 Market Forecast
10.2.2 Japan
10.2.2.1 Market Trends
10.2.2.2 Market Forecast
10.2.3 India
10.2.3.1 Market Trends
10.2.3.2 Market Forecast
10.2.4 South Korea
10.2.4.1 Market Trends
10.2.4.2 Market Forecast
10.2.5 Australia
10.2.5.1 Market Trends
10.2.5.2 Market Forecast
10.2.6 Indonesia
10.2.6.1 Market Trends
10.2.6.2 Market Forecast
10.2.7 Others
10.2.7.1 Market Trends
10.2.7.2 Market Forecast
10.3 Europe
10.3.1 Germany
10.3.1.1 Market Trends
10.3.1.2 Market Forecast
10.3.2 France
10.3.2.1 Market Trends
10.3.2.2 Market Forecast
10.3.3 United Kingdom
10.3.3.1 Market Trends
10.3.3.2 Market Forecast
10.3.4 Italy
10.3.4.1 Market Trends
10.3.4.2 Market Forecast
10.3.5 Spain
10.3.5.1 Market Trends
10.3.5.2 Market Forecast
10.3.6 Russia
10.3.6.1 Market Trends
10.3.6.2 Market Forecast
10.3.7 Others
10.3.7.1 Market Trends
10.3.7.2 Market Forecast
10.4 Latin America
10.4.1 Brazil
10.4.1.1 Market Trends
10.4.1.2 Market Forecast
10.4.2 Mexico
10.4.2.1 Market Trends
10.4.2.2 Market Forecast
10.4.3 Others
10.4.3.1 Market Trends
10.4.3.2 Market Forecast
10.5 Middle East and Africa
10.5.1 Market Trends
10.5.2 Market Breakup by Country
10.5.3 Market Forecast
11 SWOT Analysis
11.1 Overview
11.2 Strengths
11.3 Weaknesses
11.4 Opportunities
11.5 Threats
12 Value Chain Analysis
13 Porters Five Forces Analysis
13.1 Overview
13.2 Bargaining Power of Buyers
13.3 Bargaining Power of Suppliers
13.4 Degree of Competition
13.5 Threat of New Entrants
13.6 Threat of Substitutes
14 Price Analysis
15 Competitive Landscape
15.1 Market Structure
15.2 Key Players
15.3 Profiles of Key Players
15.3.1 Cinergy Entertainment Group
15.3.1.1 Company Overview
15.3.1.2 Product Portfolio
15.3.2 Dave & Buster’s Inc.
15.3.2.1 Company Overview
15.3.2.2 Product Portfolio
15.3.2.3 Financials
15.3.2.4 SWOT Analysis
15.3.3 Fun City India (Landmark Group)
15.3.3.1 Company Overview
15.3.3.2 Product Portfolio
15.3.4 Funriders Leisure & Amusement Pvt. Ltd.
15.3.4.1 Company Overview
15.3.4.2 Product Portfolio
15.3.5 KidZania S.A.P.I. de C.V.
15.3.5.1 Company Overview
15.3.5.2 Product Portfolio
15.3.6 Lucky Strike Entertainment
15.3.6.1 Company Overview
15.3.6.2 Product Portfolio
15.3.7 Scene75 Entertainment Centers
15.3.7.1 Company Overview
15.3.7.2 Product Portfolio
15.3.8 Smaaash
15.3.8.1 Company Overview
15.3.8.2 Product Portfolio
15.3.9 The Walt Disney Company
15.3.9.1 Company Overview
15.3.9.2 Product Portfolio
15.3.9.3 Financials
15.3.9.4 SWOT Analysis
List of Tables
Table 1: Global: Children’s Entertainment Centers Market: Key Industry Highlights, 2025 and 2034
Table 2: Global: Children’s Entertainment Centers Market Forecast: Breakup by Visitor Demographics (in Million USD), 2026-2034
Table 3: Global: Children’s Entertainment Centers Market Forecast: Breakup by Facility Size (in Million USD), 2026-2034
Table 4: Global: Children’s Entertainment Centers Market Forecast: Breakup by Revenue Source (in Million USD), 2026-2034
Table 5: Global: Children’s Entertainment Centers Market Forecast: Breakup by Activity Area (in Million USD), 2026-2034
Table 6: Global: Children’s Entertainment Centers Market Forecast: Breakup by Region (in Million USD), 2026-2034
Table 7: Global: Children’s Entertainment Centers Market: Competitive Structure
Table 8: Global: Children’s Entertainment Centers Market: Key Players
List of Figures
Figure 1: Global: Children’s Entertainment Centers Market: Major Drivers and Challenges
Figure 2: Global: Children’s Entertainment Centers Market: Sales Value (in Billion USD), 2020-2025
Figure 3: Global: Children’s Entertainment Centers Market Forecast: Sales Value (in Billion USD), 2026-2034
Figure 4: Global: Children’s Entertainment Centers Market: Breakup by Visitor Demographics (in %), 2025
Figure 5: Global: Children’s Entertainment Centers Market: Breakup by Facility Size (in %), 2025
Figure 6: Global: Children’s Entertainment Centers Market: Breakup by Revenue Source (in %), 2025
Figure 7: Global: Children’s Entertainment Centers Market: Breakup by Activity Area (in %), 2025
Figure 8: Global: Children’s Entertainment Centers Market: Breakup by Region (in %), 2025
Figure 9: Global: Children’s Entertainment Centers (Families with Children (0-9)) Market: Sales Value (in Million USD), 2020 & 2025
Figure 10: Global: Children’s Entertainment Centers (Families with Children (0-9)) Market Forecast: Sales Value (in Million USD), 2026-2034
Figure 11: Global: Children’s Entertainment Centers (Families with Children (9-12)) Market: Sales Value (in Million USD), 2020 & 2025
Figure 12: Global: Children’s Entertainment Centers (Families with Children (9-12)) Market Forecast: Sales Value (in Million USD), 2026-2034
Figure 13: Global: Children’s Entertainment Centers (Teenagers (12-18)) Market: Sales Value (in Million USD), 2020 & 2025
Figure 14: Global: Children’s Entertainment Centers (Teenagers (12-18)) Market Forecast: Sales Value (in Million USD), 2026-2034
Figure 15: Global: Children’s Entertainment Centers (Young Adults (18-24)) Market: Sales Value (in Million USD), 2020 & 2025
Figure 16: Global: Children’s Entertainment Centers (Young Adults (18-24)) Market Forecast: Sales Value (in Million USD), 2026-2034
Figure 17: Global: Children’s Entertainment Centers (Adults (Ages 24+)) Market: Sales Value (in Million USD), 2020 & 2025
Figure 18: Global: Children’s Entertainment Centers (Adults (Ages 24+)) Market Forecast: Sales Value (in Million USD), 2026-2034
Figure 19: Global: Children’s Entertainment Centers (Up to 5,000 Sq. Ft.) Market: Sales Value (in Million USD), 2020 & 2025
Figure 20: Global: Children’s Entertainment Centers (Up to 5,000 Sq. Ft.) Market Forecast: Sales Value (in Million USD), 2026-2034
Figure 21: Global: Children’s Entertainment Centers (5,001 to 10,000 Sq. Ft.) Market: Sales Value (in Million USD), 2020 & 2025
Figure 22: Global: Children’s Entertainment Centers (5,001 to 10,000 Sq. Ft.) Market Forecast: Sales Value (in Million USD), 2026-2034
Figure 23: Global: Children’s Entertainment Centers (10,001 to 20,000 Sq. Ft.) Market: Sales Value (in Million USD), 2020 & 2025
Figure 24: Global: Children’s Entertainment Centers (10,001 to 20,000 Sq. Ft.) Market Forecast: Sales Value (in Million USD), 2026-2034
Figure 25: Global: Children’s Entertainment Centers (20,001 to 40,000 Sq. Ft.) Market: Sales Value (in Million USD), 2020 & 2025
Figure 26: Global: Children’s Entertainment Centers (20,001 to 40,000 Sq. Ft.) Market Forecast: Sales Value (in Million USD), 2026-2034
Figure 27: Global: Children’s Entertainment Centers (1 to 10 Acres) Market: Sales Value (in Million USD), 2020 & 2025
Figure 28: Global: Children’s Entertainment Centers (1 to 10 Acres) Market Forecast: Sales Value (in Million USD), 2026-2034
Figure 29: Global: Children’s Entertainment Centers (11 to 30 Acres) Market: Sales Value (in Million USD), 2020 & 2025
Figure 30: Global: Children’s Entertainment Centers (11 to 30 Acres) Market Forecast: Sales Value (in Million USD), 2026-2034
Figure 31: Global: Children’s Entertainment Centers (Over 30 Acres) Market: Sales Value (in Million USD), 2020 & 2025
Figure 32: Global: Children’s Entertainment Centers (Over 30 Acres) Market Forecast: Sales Value (in Million USD), 2026-2034
Figure 33: Global: Children’s Entertainment Centers (Entry Fees and Ticket Sales) Market: Sales Value (in Million USD), 2020 & 2025
Figure 34: Global: Children’s Entertainment Centers (Entry Fees and Ticket Sales) Market Forecast: Sales Value (in Million USD), 2026-2034
Figure 35: Global: Children’s Entertainment Centers (Food and Beverages) Market: Sales Value (in Million USD), 2020 & 2025
Figure 36: Global: Children’s Entertainment Centers (Food and Beverages) Market Forecast: Sales Value (in Million USD), 2026-2034
Figure 37: Global: Children’s Entertainment Centers (Merchandising) Market: Sales Value (in Million USD), 2020 & 2025
Figure 38: Global: Children’s Entertainment Centers (Merchandising) Market Forecast: Sales Value (in Million USD), 2026-2034
Figure 39: Global: Children’s Entertainment Centers (Advertisement) Market: Sales Value (in Million USD), 2020 & 2025
Figure 40: Global: Children’s Entertainment Centers (Advertisement) Market Forecast: Sales Value (in Million USD), 2026-2034
Figure 41: Global: Children’s Entertainment Centers (Other Revenue Sources) Market: Sales Value (in Million USD), 2020 & 2025
Figure 42: Global: Children’s Entertainment Centers (Other Revenue Sources) Market Forecast: Sales Value (in Million USD), 2026-2034
Figure 43: Global: Children’s Entertainment Centers (Arcade Studios) Market: Sales Value (in Million USD), 2020 & 2025
Figure 44: Global: Children’s Entertainment Centers (Arcade Studios) Market Forecast: Sales Value (in Million USD), 2026-2034
Figure 45: Global: Children’s Entertainment Centers (AR and VR Gaming Zones) Market: Sales Value (in Million USD), 2020 & 2025
Figure 46: Global: Children’s Entertainment Centers (AR and VR Gaming Zones) Market Forecast: Sales Value (in Million USD), 2026-2034
Figure 47: Global: Children’s Entertainment Centers (Physical Play Activities) Market: Sales Value (in Million USD), 2020 & 2025
Figure 48: Global: Children’s Entertainment Centers (Physical Play Activities) Market Forecast: Sales Value (in Million USD), 2026-2034
Figure 49: Global: Children’s Entertainment Centers (Skill/Competition Games) Market: Sales Value (in Million USD), 2020 & 2025
Figure 50: Global: Children’s Entertainment Centers (Skill/Competition Games) Market Forecast: Sales Value (in Million USD), 2026-2034
Figure 51: Global: Children’s Entertainment Centers (Other Activity Areas) Market: Sales Value (in Million USD), 2020 & 2025
Figure 52: Global: Children’s Entertainment Centers (Other Activity Areas) Market Forecast: Sales Value (in Million USD), 2026-2034
Figure 53: North America: Children’s Entertainment Centers Market: Sales Value (in Million USD), 2020 & 2025
Figure 54: North America: Children’s Entertainment Centers Market Forecast: Sales Value (in Million USD), 2026-2034
Figure 55: United States: Children’s Entertainment Centers Market: Sales Value (in Million USD), 2020 & 2025
Figure 56: United States: Children’s Entertainment Centers Market Forecast: Sales Value (in Million USD), 2026-2034
Figure 57: Canada: Children’s Entertainment Centers Market: Sales Value (in Million USD), 2020 & 2025
Figure 58: Canada: Children’s Entertainment Centers Market Forecast: Sales Value (in Million USD), 2026-2034
Figure 59: Asia-Pacific: Children’s Entertainment Centers Market: Sales Value (in Million USD), 2020 & 2025
Figure 60: Asia-Pacific: Children’s Entertainment Centers Market Forecast: Sales Value (in Million USD), 2026-2034
Figure 61: China: Children’s Entertainment Centers Market: Sales Value (in Million USD), 2020 & 2025
Figure 62: China: Children’s Entertainment Centers Market Forecast: Sales Value (in Million USD), 2026-2034
Figure 63: Japan: Children’s Entertainment Centers Market: Sales Value (in Million USD), 2020 & 2025
Figure 64: Japan: Children’s Entertainment Centers Market Forecast: Sales Value (in Million USD), 2026-2034
Figure 65: India: Children’s Entertainment Centers Market: Sales Value (in Million USD), 2020 & 2025
Figure 66: India: Children’s Entertainment Centers Market Forecast: Sales Value (in Million USD), 2026-2034
Figure 67: South Korea: Children’s Entertainment Centers Market: Sales Value (in Million USD), 2020 & 2025
Figure 68: South Korea: Children’s Entertainment Centers Market Forecast: Sales Value (in Million USD), 2026-2034
Figure 69: Australia: Children’s Entertainment Centers Market: Sales Value (in Million USD), 2020 & 2025
Figure 70: Australia: Children’s Entertainment Centers Market Forecast: Sales Value (in Million USD), 2026-2034
Figure 71: Indonesia: Children’s Entertainment Centers Market: Sales Value (in Million USD), 2020 & 2025
Figure 72: Indonesia: Children’s Entertainment Centers Market Forecast: Sales Value (in Million USD), 2026-2034
Figure 73: Others: Children’s Entertainment Centers Market: Sales Value (in Million USD), 2020 & 2025
Figure 74: Others: Children’s Entertainment Centers Market Forecast: Sales Value (in Million USD), 2026-2034
Figure 75: Europe: Children’s Entertainment Centers Market: Sales Value (in Million USD), 2020 & 2025
Figure 76: Europe: Children’s Entertainment Centers Market Forecast: Sales Value (in Million USD), 2026-2034
Figure 77: Germany: Children’s Entertainment Centers Market: Sales Value (in Million USD), 2020 & 2025
Figure 78: Germany: Children’s Entertainment Centers Market Forecast: Sales Value (in Million USD), 2026-2034
Figure 79: France: Children’s Entertainment Centers Market: Sales Value (in Million USD), 2020 & 2025
Figure 80: France: Children’s Entertainment Centers Market Forecast: Sales Value (in Million USD), 2026-2034
Figure 81: United Kingdom: Children’s Entertainment Centers Market: Sales Value (in Million USD), 2020 & 2025
Figure 82: United Kingdom: Children’s Entertainment Centers Market Forecast: Sales Value (in Million USD), 2026-2034
Figure 83: Italy: Children’s Entertainment Centers Market: Sales Value (in Million USD), 2020 & 2025
Figure 84: Italy: Children’s Entertainment Centers Market Forecast: Sales Value (in Million USD), 2026-2034
Figure 85: Spain: Children’s Entertainment Centers Market: Sales Value (in Million USD), 2020 & 2025
Figure 86: Spain: Children’s Entertainment Centers Market Forecast: Sales Value (in Million USD), 2026-2034
Figure 87: Russia: Children’s Entertainment Centers Market: Sales Value (in Million USD), 2020 & 2025
Figure 88: Russia: Children’s Entertainment Centers Market Forecast: Sales Value (in Million USD), 2026-2034
Figure 89: Others: Children’s Entertainment Centers Market: Sales Value (in Million USD), 2020 & 2025
Figure 90: Others: Children’s Entertainment Centers Market Forecast: Sales Value (in Million USD), 2026-2034
Figure 91: Latin America: Children’s Entertainment Centers Market: Sales Value (in Million USD), 2020 & 2025
Figure 92: Latin America: Children’s Entertainment Centers Market Forecast: Sales Value (in Million USD), 2026-2034
Figure 93: Brazil: Children’s Entertainment Centers Market: Sales Value (in Million USD), 2020 & 2025
Figure 94: Brazil: Children’s Entertainment Centers Market Forecast: Sales Value (in Million USD), 2026-2034
Figure 95: Mexico: Children’s Entertainment Centers Market: Sales Value (in Million USD), 2020 & 2025
Figure 96: Mexico: Children’s Entertainment Centers Market Forecast: Sales Value (in Million USD), 2026-2034
Figure 97: Others: Children’s Entertainment Centers Market: Sales Value (in Million USD), 2020 & 2025
Figure 98: Others: Children’s Entertainment Centers Market Forecast: Sales Value (in Million USD), 2026-2034
Figure 99: Middle East and Africa: Children’s Entertainment Centers Market: Sales Value (in Million USD), 2020 & 2025
Figure 100: Middle East and Africa: Children’s Entertainment Centers Market: Breakup by Country (in %), 2025
Figure 101: Middle East and Africa: Children’s Entertainment Centers Market Forecast: Sales Value (in Million USD), 2026-2034
Figure 102: Global: Children’s Entertainment Centers Industry: SWOT Analysis
Figure 103: Global: Children’s Entertainment Centers Industry: Value Chain Analysis
Figure 104: Global: Children’s Entertainment Centers Industry: Porter’s Five Forces Analysis