透明ディスプレイ市場 - 解像度別(ウルトラHD、フルHD、HD、4K以上)、ディスプレイサイズ別(小型・中型、大型)、技術別、用途別、地域、セグメント別予測による市場規模、成長と動向分析レポート 2026-2033年
Transparent Display Market Size, Share & Trends Analysis Report By Resolution (Ultra HD, Full HD, HD, 4K And Above), By Display Size (Small & Medium, Large), By Technology, By End Use, By Region, And Segment Forecasts, 2026 - 2033
| 出版 | Grand View Research |
| 出版年月 | 2026年02月 |
| ページ数 | 130 |
| 価格 | 記載以外のライセンスについてはお問合せください |
| シングルユーザ | USD 4,950 |
| 種別 | 英文調査報告書 |
| 商品番号 | SMR-16189 |

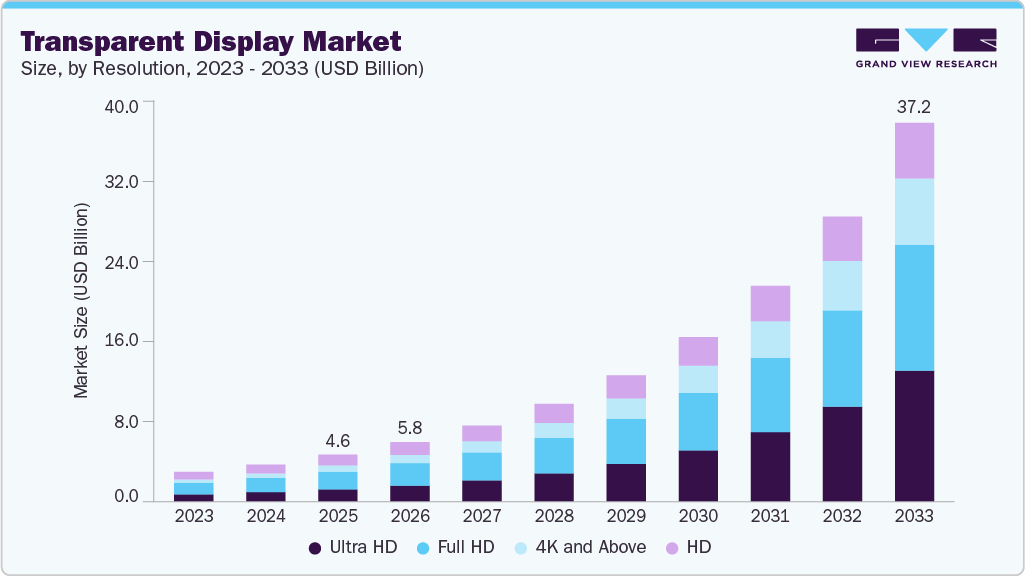
世界の透明ディスプレイ市場規模は、2025年には45億9,800万米ドルと評価され、2033年には372億420万米ドルに達すると予測されており、2026年から2033年にかけて年平均成長率(CAGR)30.3%に達するとGrand View Researchでは予測しています。
この成長は、没入型のビジュアルコミュニケーションを可能にする次世代ディスプレイソリューションへの需要の高まりによって牽引されています。
主要市場動向とインサイト
- アジア太平洋地域の透明ディスプレイ市場は、2025年に42%を超える最大の収益シェアを占めました。
- 解像度別に見ると、フルHDセグメントが2025年に38%を超える最大の市場シェアを占めました。
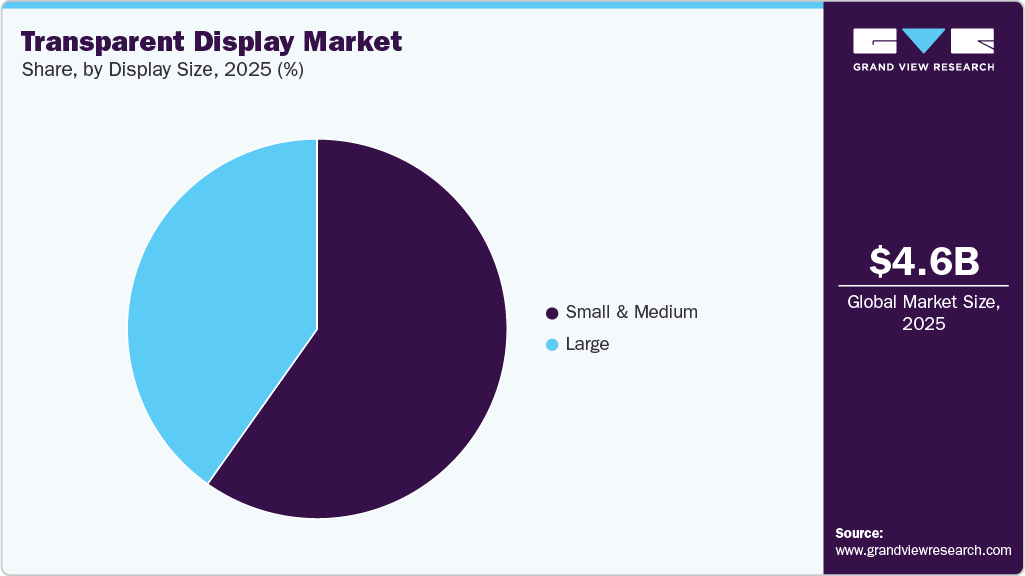
- ディスプレイサイズ別に見ると、小型・中型セグメントが2025年に59%を超える最大の収益シェアを占めました。
- 技術別に見ると、LCDセグメントが2025年に42%を超える最大の市場シェアを占めました。
- 用途別に見ると、小売セグメントが2025年に29%を超える最大の市場シェアを占めました。
最近の市場動向
- 2026年1月、LGディスプレイ株式会社は、透明OLED技術を2026年の成長戦略の中核に据え、パネルの透明度を大幅に向上させ、次世代車載ディスプレイやXR(拡張現実)アプリケーションへの展開を目指すと発表しました。この戦略的な取り組みは、没入型車載コックピットやウェアラブルディスプレイへの活用に向けた透明OLED性能の向上に対するLGの強いコミットメントを示すものであり、透明ディスプレイ市場における同社のリーダーシップをさらに強固なものにするものです。
- 2025年3月、サムスン電子株式会社は、世界的な自動車メーカーのデジタルコックピットプログラム向けに透明OLEDパネルを供給すると発表しました。これは、ヘッドアップディスプレイや車内情報システムを中心とした次世代車内インテリアにおける透明ディスプレイの商用化が加速していることを示しています。この動きにより、サムスンディスプレイは車載グレードの透明パネルの有力サプライヤーとしての地位を確立しました。
- 2025年3月、BOEテクノロジーグループは、自動車用ヘッドアップディスプレイや高級小売店向けサイネージをターゲットとした透明フレキシブルOLEDパネルの共同開発および量産化に向けて、Visionox社との戦略的パートナーシップを発表しました。これは、透明OLEDの生産規模拡大と応用範囲の拡大に向けた両社の協力関係の強化を示すものです。このパートナーシップは、BOEの透明ディスプレイ技術導入における進化を支えるものです。
Transparent Display Market Summary
The global transparent display market size was valued at USD 4,598.0 million in 2025 and is projected to reach USD 37,204.2 million by 2033, growing at a CAGR of 30.3% from 2026 to 2033. The growth is driven by the rising demand for next-generation display solutions that enable immersive visual communication.
transparent-display-market-size
Key Market Trends & Insights
- The Asia Pacific transparent display market accounted for the largest revenue share of over 42% in 2025.
- Based on resolution, the full HD segment held the highest market share of over 38% in 2025.
- Based on display size, the small & medium segment accounted for the largest revenue share of over 59% in 2025.
- Based on technology, the LCD segment held the largest market share of over 42% in 2025.
- Based on end use, the retail segment accounted for the highest market share of over 29% in 2025.
Market Size & Forecast
- 2025 Market Size: USD 4,598.0 Million
- 2033 Projected Market Size: USD 37,204.2 Million
- CAGR (2026-2033): 30.3%
- Asia Pacific: Largest market in 2025
Technological advancements in OLED- and micro-LED-based transparent panels, improvements in pixel density and brightness, and integration with IoT-enabled smart glass systems are enabling wider commercial adoption, further accelerating the growth of the transparent display industry.
The increasing adoption of next-generation display technologies, such as OLED-based transparent panels, micro-LED transparent screens, and smart glass-integrated digital signage, is expected to enhance visual engagement, improve space utilization, and deliver a premium user experience. The growing emphasis on immersive retail experiences, futuristic automotive cockpit designs, and smart building infrastructure, along with rising demand for interactive storefront advertising and advanced head-up display systems, is accelerating enterprise investments in advanced transparent displays, thereby contributing to the sustained expansion of the industry.
The rapid integration of automotive-grade transparent display systems, including AR head-up displays (HUDs), transparent dashboard panels, and windshield-projected interfaces, is creating substantial growth opportunities for the transparent display market. These innovations enable real-time navigation overlays, driver-assistance visualization, and enhanced cockpit user experiences while maintaining visibility and safety compliance. This trend is accelerating demand for high-brightness, high-transparency OLED and micro-LED displays that support durability, sunlight readability, and seamless integration into next-generation vehicle interiors.
Additionally, government initiatives worldwide are significant drivers fueling the growth of the transparent display industry. Public investments supporting smart city infrastructure, intelligent transportation systems, and digital public signage modernization are encouraging the adoption of advanced transparent display solutions across airports, metro stations, government buildings, and tourism hubs. Government-backed programs focused on energy-efficient building upgrades and smart commercial architecture are also lowering the financial barriers for deploying transparent OLED and smart glass-integrated displays, thereby propelling the expansion of the industry.
Moreover, leading display manufacturers and technology providers are actively strengthening their market position by expanding their production capabilities and commercial deployment partnerships. Companies are forming strategic collaborations with retail chains, luxury brands, smart glass manufacturers, and digital signage integrators to scale transparent displays for storefront advertising, interactive product showcases, and premium indoor commercial environments. The emphasis on improved transparency ratios, better contrast performance, longer operational lifetimes, and scalable manufacturing yields is further increasing the attractiveness of modern transparent displays, thereby supporting sustained market expansion.
Regional Insights
North America transparent display market accounted for a revenue share of over 25% in 2025, fueled by the region’s strong adoption of premium digital signage, high penetration of advanced retail visualization technologies, and the presence of major display innovators accelerating the commercialization of transparent OLED solutions. The rapid modernization of smart retail storefronts, airports, and high-end commercial infrastructure is driving demand for transparent displays. North America remains a global innovation hub for micro-LED development, AR-enabled display interfaces, and AI-powered interactive retail experiences, which are expected to redefine transparent display capabilities.
U.S. Transparent Display Market Trends
The transparent display market in the U.S. accounted for the largest regional share of over 79% in 2025, driven by the rapid deployment of digital-out-of-home (DOOH) advertising, strong investments in automotive HUD systems, and increasing adoption of smart glass and interactive display solutions. The U.S. focus on advanced driver-assistance systems (ADAS), next-generation cockpit digitization, and luxury vehicle personalization is accelerating demand for transparent displays. The country’s strong ecosystem of technology vendors, system integrators, and commercial display manufacturers is supporting the faster rollout of high-brightness transparent OLED and micro-LED products.
Europe Transparent Display Market Trends
The transparent display market in Europe is expected to grow at a CAGR of over 28% from 2026 to 2033. In Europe, the market is driven by rising adoption of energy-efficient smart building solutions, the expansion of high-end retail and luxury storefront modernization, and strong investments in interactive public information systems. The region’s emphasis on sustainability, architectural innovation, and premium customer experiences is encouraging the integration of transparent displays into glass façades, retail windows, and smart transportation hubs. Europe’s strong automotive manufacturing base is supporting demand for transparent displays in next-generation cockpit and HUD applications.
The UK transparent display market is expected to grow at a significant rate in the coming years. This expansion is supported by the U.K.’s strong growth in digital-out-of-home advertising and rising demand for immersive in-store product experiences across fashion, electronics, and luxury segments. The rapid adoption of interactive window displays, combined with the strong commercialization of retail technology in London and other metropolitan hubs, is encouraging brands to deploy transparent display-based storefront engagement solutions, thereby supporting sustained market growth in the country.
The transparent display market in Germany is rapidly expanding, driven by the country’s strong leadership in automotive engineering and rising adoption of AR head-up displays. Germany’s advanced manufacturing ecosystem and strong presence of automotive OEMs and Tier-1 suppliers are accelerating the integration of transparent displays into windshields, dashboards, and passenger infotainment systems. The growing modernization of smart factories and transportation infrastructure is increasing demand for high-durability transparent displays, reinforcing Germany’s position as a key growth market for the industry.
Asia-Pacific Transparent Display Market Trends
The transparent display market in Asia-Pacific is expected to register the highest CAGR of over 33% from 2026 to 2033, fueled by the rapid expansion of consumer electronics manufacturing, rising investments in smart city projects, and strong adoption of digital signage. The region’s dominance in display panel production, combined with aggressive innovation in OLED, micro-LED, and advanced glass technologies, is enabling faster commercialization and cost reduction. These factors are positioning Asia-Pacific as the fastest-growing market for transparent displays.
The Japan transparent display market is gaining momentum, driven by strong demand for premium consumer electronics, rapid adoption of transparent displays in high-end retail and brand showrooms, and increasing integration of AR-enabled visualization technologies in smart commercial environments. Japan’s focus on innovation-driven retail experiences, combined with strong adoption of advanced automotive cockpit systems, is supporting demand for transparent OLED displays with high clarity and durability. The increasing use of transparent displays in public venues, exhibitions, and smart transportation hubs is further strengthening long-term market growth in the country
The transparent display market in China is witnessing robust expansion, supported by the country’s dominance in display panel manufacturing, rapid rollout of smart retail ecosystems, and large-scale deployment of DOOH advertising infrastructure. China’s strong investments in micro-LED commercialization, high-volume OLED production, and smart glass integration are accelerating product availability and reducing cost barriers. The growing demand for transparent displays in shopping malls, metro stations, automotive applications, and interactive brand experiences is driving widespread adoption of transparent display solutions across the country.
Key Transparent Display Companies Insights
Some of the key players operating in the market are LG DISPLAY CO., LTD., and Samsung Electronics Co., Ltd., among others.
- LG DISPLAY CO., LTD. is a global company in advanced display technologies, specializing in transparent OLED and next-generation panel solutions that enable high transparency, vivid color reproduction, and integration into smart retail, automotive HUD, and commercial signage applications. With extensive R&D in micro-LED and transparent display optics, the company drives innovation in immersive customer engagement, premium storefront experiences, and connected smart environments, reinforcing its position as a core supplier in the transparent display industry.
- Samsung Electronics Co., Ltd. is a major innovator in transparent display technologies, offering transparent OLED, transparent LED, and advanced smart signage solutions for automotive, retail, and experiential display markets. Samsung’s transparent displays are integrated into smart glass applications, advanced head-up displays, and retail digital window systems that enhance visual interaction and brand storytelling while maintaining see-through clarity. The company’s strong ecosystem of hardware, software, and display intelligence — including AI-enabled content management and sensor integration — supports scalable deployment of transparent display solutions across global commercial and automotive segments.
Pro Display Ltd. and Kent Optronics, Inc. are some of the emerging participants in the transparent display market.
- Pro Display Ltd. is a specialist in transparent display modules and integrated systems designed for luxury retail, experiential marketing, and architectural showcase applications. Pro Display focuses on transparent OLED and high-performance transparent LCD technologies that blend digital content with physical environments, enabling brands to deliver immersive product visualization without obstructing the underlying space. With customizable form factors, interactive touch integration, and design-centric deployment approaches, Pro Display is gaining traction among premium retailers and creative agencies seeking differentiated transparent display experiences.
- Kent Optronics, Inc. is an emerging transparent display technology provider offering transparent OLED and interactive transparent panel solutions targeted at niche commercial and industrial applications. Kent Optronics emphasizes modular transparent screens, high transparency ratios, and enhanced optical performance to support digital signage, augmented visual interfaces, and integrated display solutions for smart buildings and vertical markets. The company’s focus on flexible integration, rapid prototyping, and tailored transparent display configurations positions it as a growing innovator within the transparent display ecosystem.
Key Transparent Display Companies:
The following key companies have been profiled for this study on the transparent display market.
- LG DISPLAY CO., LTD.
- Samsung Electronics Co., Ltd.
- BOE Technology Group Co., Ltd.
- Panasonic Corporation
- Planar Systems, Inc.
- Pro Display Ltd.
- Crystal Display Systems Ltd.
- Universal Display Corporation
- Kent Optronics, Inc.
- Nexnovo.
Recent Developments
- In January 2026, LG DISPLAY CO., LTD. announced that it is making transparent OLED technology a core growth pillar for 2026, with plans to significantly increase panel transparency and target next-generation automotive displays and XR (extended reality) applications. This strategic focus highlights LG’s commitment to advancing transparent OLED performance for use in immersive vehicle cockpits and wearable displays, further solidifying its leadership in the transparent display market.
- In March 2025, Samsung Electronics Co., Ltd. announced a supply of transparent OLED panels for a global automotive OEM’s digital cockpit program, signaling accelerated commercialization of transparent displays in next-generation vehicle interiors focused on heads-up and cabin information systems. This development places Samsung Display as a growing supplier of automotive-grade transparent panels.
- In March 2025, BOE Technology Group Co., Ltd. announced a strategic partnership with Visionox to co-develop and mass-produce transparent flexible OLED panels aimed at automotive heads-up displays and high-end retail signage, indicating collaborative momentum to scale transparent OLED production and widen its application scope. This partnership supports BOE’s evolution in transparent display technology adoption.
Transparent Display Market Report Scope
| Report Attribute | Details |
| Market size value in 2026 | USD 5,835.6 million |
| Revenue forecast in 2033 | USD 37,204.2 million |
| Growth rate | CAGR of 30.3% from 2026 to 2033 |
| Base year for estimation | 2025 |
| Historical data | 2021 – 2024 |
| Forecast period | 2026 – 2033 |
| Quantitative units | Revenue in USD million/billion and CAGR from 2026 to 2033 |
| Report Product | Revenue forecast, company ranking, competitive landscape, growth factors, and trends |
| Segments covered | Resolution, display size, technology, end use, and region |
| Regional scope | North America; Europe; Asia Pacific; Latin America; Middle East & Africa |
| Country scope | U.S.; Canada; Mexico; UK; Germany; France; China; Japan; India; South Korea; Australia; Brazil; UAE; Saudi Arabia; South Africa |
| Key companies profiled | LG DISPLAY CO., LTD.; Samsung Electronics Co., Ltd.; BOE Technology Group Co., Ltd.; Panasonic Corporation; Planar Systems, Inc.; Pro Display Ltd.; Crystal Display Systems Ltd; Universal Display Corporation; Kent Optronics, Inc.; Nexnovo. |
| Customization scope | Free report customization (equivalent to up to 8 analyst’s working days) with purchase. Addition or alteration to country, regional & segment scope. |
Global Transparent Display Market Report Segmentation
This report forecasts revenue growth at global, regional, and country levels and provides an analysis of the latest technology trends in each of the sub-segments from 2021 to 2033. For this study, Grand View Research has segmented the global transparent display market report based on resolution, display size, technology, end use, and region:
- Resolution Outlook (Revenue, USD Million, 2021 – 2033)
- Ultra HD
- Full HD
- HD
- 4K and Above
- Display Size Outlook (Revenue, USD Million, 2021 – 2033)
- Small & Medium
- Large
- Technology Outlook (Revenue, USD Million, 2021 – 2033)
- LCD
- OLED
- Micro-LED
- Others
- End Use Outlook (Revenue, USD Million, 2021 – 2033)
- Consumer Electronics
- Healthcare
- Automotive
- Aerospace and Defense
- Industrial & Manufacturing
- Retail
- Others
- Transparent Display Regional Outlook (Revenue, USD Million, 2021 – 2033)
- North America
- U.S.
- Canada
- Mexico
- Europe
- UK
- Germany
- France
- Asia Pacific
- China
- Japan
- India
- South Korea
- Australia
- Latin America
- Brazil
- Middle East & Africa
- Saudi Arabia
- South Africa
- UAE
- North America
Table of Contents
Chapter 1. Methodology and Scope
1.1. Market Segmentation and Scope
1.2. Market Definitions
1.2.1. Information analysis
1.2.2. Market formulation & data visualization
1.2.3. Data validation & publishing
1.3. Research Scope and Assumptions
1.3.1. List of Data Sources
Chapter 2. Executive Summary
2.1. Market Outlook
2.2. Segment Outlook
2.3. Competitive Insights
Chapter 3. Transparent Display Market Variables, Trends, & Scope
3.1. Market Lineage Outlook
3.2. Market Dynamics
3.2.1. Market Driver Analysis
3.2.2. Market Restraint Analysis
3.2.3. Market Opportunities
3.3. Transparent Display Market Analysis Tools
3.3.1. Industry Analysis – Porter’s
3.3.1.1. Bargaining power of the suppliers
3.3.1.2. Bargaining power of the buyers
3.3.1.3. Threats of substitution
3.3.1.4. Threats from new entrants
3.3.1.5. Competitive rivalry
3.3.2. PESTEL Analysis
3.3.2.1. Political landscape
3.3.2.2. Economic landscape
3.3.2.3. Social landscape
3.3.2.4. Technological landscape
3.3.2.5. Environmental landscape
3.3.2.6. Legal landscape
Chapter 4. Transparent Display Market: Resolution Estimates & Trend Analysis
4.1. Segment Dashboard
4.2. Transparent Display Market: Resolution Movement Analysis, 2025 & 2033 (USD Million)
4.3. Ultra HD
4.3.1. Ultra HD Market Revenue Estimates and Forecasts, 2021 – 2033 (USD Million)
4.4. Full HD
4.4.1. Full HD Market Revenue Estimates and Forecasts, 2021 – 2033 (USD Million)
4.5. HD
4.5.1. HD Market Revenue Estimates and Forecasts, 2021 – 2033 (USD Million)
4.6. 4K and Above
4.6.1. 4K and Above Market Revenue Estimates and Forecasts, 2021 – 2033 (USD Million)
Chapter 5. Transparent Display Market: Display Size Estimates & Trend Analysis
5.1. Segment Dashboard
5.2. Transparent Display Market: Display Size Movement Analysis, 2025 & 2033 (USD Million)
5.3. Small & Medium
5.3.1. Small & Medium Market Revenue Estimates and Forecasts, 2021 – 2033 (USD Million)
5.4. Large
5.4.1. Large Market Revenue Estimates and Forecasts, 2021 – 2033 (USD Million)
Chapter 6. Transparent Display Market: Technology Estimates & Trend Analysis
6.1. Segment Dashboard
6.2. Transparent Display Market: Technology Movement Analysis, 2025 & 2033 (USD Million)
6.3. LCD
6.3.1. LCD Medium Market Revenue Estimates and Forecasts, 2021 – 2033 (USD Million)
6.4. OLED
6.4.1. OLED Medium Market Revenue Estimates and Forecasts, 2021 – 2033 (USD Million)
6.5. Micro-LED
6.5.1. Micro-LED Medium Market Revenue Estimates and Forecasts, 2021 – 2033 (USD Million)
6.6. Others
6.6.1. Others Medium Market Revenue Estimates and Forecasts, 2021 – 2033 (USD Million)
Chapter 7. Transparent Display Market: End Use Estimates & Trend Analysis
7.1. Segment Dashboard
7.2. Transparent Display Market: End Use Movement Analysis, 2025 & 2033 (USD Million)
7.3. Consumer Electronics
7.3.1. Consumer Electronics Market Revenue Estimates and Forecasts, 2021 – 2033 (USD Million)
7.4. Healthcare
7.4.1. Healthcare Market Revenue Estimates and Forecasts, 2021 – 2033 (USD Million)
7.5. Automotive
7.5.1. Automotive Market Revenue Estimates and Forecasts, 2021 – 2033 (USD Million)
7.6. Aerospace and Defense
7.6.1. Aerospace and Defense Market Revenue Estimates and Forecasts, 2021 – 2033 (USD Million)
7.7. Industrial & Manufacturing
7.7.1. Industrial & Manufacturing Market Revenue Estimates and Forecasts, 2021 – 2033 (USD Million)
7.8. Retail
7.8.1. Retail Market Revenue Estimates and Forecasts, 2021 – 2033 (USD Million)
7.9. Others
7.9.1. Others Market Revenue Estimates and Forecasts, 2021 – 2033 (USD Million)
Chapter 8. Regional Estimates & Trend Analysis
8.1. Transparent Display Market by Region, 2025 & 2033
8.2. North America
8.2.1. North America Transparent Display Market Estimates & Forecasts, 2021 – 2033, (USD Million)
8.2.2. U.S.
8.2.2.1. U.S. Transparent Display Market Estimates and Forecasts, 2021 – 2033 (USD Million)
8.2.3. Canada
8.2.3.1. Canada Transparent Display Market Estimates and Forecasts, 2021 – 2033 (USD Million)
8.2.4. Mexico
8.2.4.1. Mexico Transparent Display Market Estimates and Forecasts, 2021 – 2033 (USD Million)
8.3. Europe
8.3.1. Europe Transparent Display Market Estimates and Forecasts, 2021 – 2033 (USD Million)
8.3.2. U.K.
8.3.2.1. U.K. Transparent Display Market Estimates and Forecasts, 2021 – 2033 (USD Million)
8.3.3. Germany
8.3.3.1. Germany Transparent Display Market Estimates and Forecasts, 2021 – 2033 (USD Million)
8.3.4. France
8.3.4.1. France Transparent Display Market Estimates and Forecasts, 2021 – 2033 (USD Million)
8.4. Asia Pacific
8.4.1. Asia Pacific Transparent Display Market Estimates and Forecasts, 2021 – 2033 (USD Million)
8.4.2. China
8.4.2.1. China Transparent Display Market Estimates and Forecasts, 2021 – 2033 (USD Million)
8.4.3. Japan
8.4.3.1. Japan Transparent Display Market Estimates and Forecasts, 2021 – 2033 (USD Million)
8.4.4. India
8.4.4.1. India Transparent Display Market Estimates and Forecasts, 2021 – 2033 (USD Million)
8.4.5. South Korea
8.4.5.1. South Korea Transparent Display Market Estimates and Forecasts, 2021 – 2033 (USD Million)
8.4.6. Australia
8.4.6.1. Australia Transparent Display Market Estimates and Forecasts, 2021 – 2033 (USD Million)
8.5. Latin America
8.5.1. Latin America Transparent Display Market Estimates and Forecasts, 2021 – 2033 (USD Million)
8.5.2. Brazil
8.5.2.1. Brazil Transparent Display Market Estimates and Forecasts, 2021 – 2033 (USD Million)
8.6. Middle East and Africa
8.6.1. Middle East and Africa Transparent Display Market Estimates and Forecasts, 2021 – 2033 (USD Million)
8.6.2. UAE
8.6.2.1. UAE Transparent Display Market Estimates and Forecasts, 2021 – 2033 (USD Million)
8.6.3. Saudi Arabia
8.6.3.1. Saudi Arabia Transparent Display Market Estimates and Forecasts, 2021 – 2033 (USD Million)
8.6.4. South Africa
8.6.4.1. South Africa Transparent Display Market Estimates and Forecasts, 2021 – 2033 (USD Million)
8.6.5. UAE
8.6.5.1. UAE Transparent Display Market Estimates and Forecasts, 2021 – 2033 (USD Million)
Chapter 9. Competitive Landscape
9.1. Company Categorization
9.2. Company Market Positioning
9.3. Company Heat Map Analysis
9.4. Company Profiles/Listing
9.4.1. LG DISPLAY CO., LTD.
9.4.1.1. Participant’s Overview
9.4.1.2. Financial Performance
9.4.1.3. Product Benchmarking
9.4.1.4. Strategic Initiatives
9.4.2. Samsung Electronics Co., Ltd.
9.4.2.1. Participant’s Overview
9.4.2.2. Financial Performance
9.4.2.3. Product Benchmarking
9.4.2.4. Strategic Initiatives
9.4.3. BOE Technology Group Co., Ltd.
9.4.3.1. Participant’s Overview
9.4.3.2. Financial Performance
9.4.3.3. Product Benchmarking
9.4.3.4. Strategic Initiatives
9.4.4. Panasonic Corporation
9.4.4.1. Participant’s Overview
9.4.4.2. Financial Performance
9.4.4.3. Product Benchmarking
9.4.4.4. Strategic Initiatives
9.4.5. Planar Systems, Inc.
9.4.5.1. Participant’s Overview
9.4.5.2. Financial Performance
9.4.5.3. Product Benchmarking
9.4.5.4. Strategic Initiatives
9.4.6. Pro Display Ltd.
9.4.6.1. Participant’s Overview
9.4.6.2. Financial Performance
9.4.6.3. Product Benchmarking
9.4.6.4. Strategic Initiatives
9.4.7. Crystal Display Systems Ltd.
9.4.7.1. Participant’s Overview
9.4.7.2. Financial Performance
9.4.7.3. Product Benchmarking
9.4.7.4. Strategic Initiatives
9.4.8. Universal Display Corporation
9.4.8.1. Participant’s Overview
9.4.8.2. Financial Performance
9.4.8.3. Product Benchmarking
9.4.8.4. Strategic Initiatives
9.4.9. Kent Optronics, Inc.
9.4.9.1. Participant’s Overview
9.4.9.2. Financial Performance
9.4.9.3. Product Benchmarking
9.4.9.4. Strategic Initiatives
9.4.10. Nexnovo.
9.4.10.1. Participant’s Overview
9.4.10.2. Financial Performance
9.4.10.3. Product Benchmarking
9.4.10.4. Strategic Initiatives
List of Tables
Table 1 Transparent Display Market Size Estimates & Forecasts 2021 – 2033 (USD Million)
Table 2 Transparent Display Market, By Resolution 2021 – 2033 (Revenue, USD Million)
Table 3 Transparent Display Market, By Display Size 2021 – 2033 (Revenue, USD Million)
Table 4 Transparent Display Market, By Technology 2021 – 2033 (Revenue, USD Million)
Table 5 Transparent Display Market, By End Use 2021 – 2033 (Revenue, USD Million)
Table 6 Ultra HD Market Estimates & Forecasts, 2021 – 2033 (Revenue, USD Million)
Table 7 Full HD Market Estimates & Forecasts, 2021 – 2033 (Revenue, USD Million)
Table 8 HD Market Estimates & Forecasts, 2021 – 2033 (Revenue, USD Million)
Table 9 4K and Above Market Estimates & Forecasts, 2021 – 2033 (Revenue, USD Million)
Table 10 Small & Medium Market Estimates & Forecasts, 2021 – 2033 (Revenue, USD Million)
Table 11 Large Market Estimates & Forecasts, 2021 – 2033 (Revenue, USD Million)
Table 12 LCD Market Estimates & Forecasts, 2021 – 2033 (Revenue, USD Million)
Table 13 OLED Market Estimates & Forecasts, 2021 – 2033 (Revenue, USD Million)
Table 14 Micro-LED Market Estimates & Forecasts, 2021 – 2033 (Revenue, USD Million)
Table 15 Others Market Estimates & Forecasts, 2021 – 2033 (Revenue, USD Million)
Table 16 Consumer Electronics Market Estimates & Forecasts, 2021 – 2033 (Revenue, USD Million)
Table 17 Healthcare Market Estimates & Forecasts, 2021 – 2033 (Revenue, USD Million)
Table 18 Automotive Market Estimates & Forecasts, 2021 – 2033 (Revenue, USD Million)
Table 19 Aerospace and Defense Market Estimates & Forecasts, 2021 – 2033 (Revenue, USD Million)
Table 20 Industrial & Manufacturing Market Estimates & Forecasts, 2021 – 2033 (Revenue, USD Million)
Table 21 Retail Market Estimates & Forecasts, 2021 – 2033 (Revenue, USD Million)
Table 22 Others Market Estimates & Forecasts, 2021 – 2033 (Revenue, USD Million)
Table 23 North America Transparent Display Market, By Resolution 2021 – 2033 (USD Million)
Table 24 North America Transparent Display Market, By Display Size 2021 – 2033 (USD Million)
Table 25 North America Transparent Display Market, By Technology 2021 – 2033 (USD Million)
Table 26 North America Transparent Display Market, By End Use 2021 – 2033 (USD Million)
Table 27 U.S. Transparent Display Market, By Resolution 2021 – 2033 (USD Million)
Table 28 U.S. Transparent Display Market, By Display Size 2021 – 2033 (USD Million)
Table 29 U.S. Transparent Display Market, By Technology 2021 – 2033 (USD Million)
Table 30 U.S. Transparent Display Market, By End Use 2021 – 2033 (USD Million)
Table 31 Canada Transparent Display Market, By Resolution 2021 – 2033 (USD Million)
Table 32 Canada Transparent Display Market, By Display Size 2021 – 2033 (USD Million)
Table 33 Canada Transparent Display Market, By Technology 2021 – 2033 (USD Million)
Table 34 Canada Transparent Display Market, By End Use 2021 – 2033 (USD Million)
Table 35 Mexico Transparent Display Market, By Resolution 2021 – 2033 (USD Million)
Table 36 Mexico Transparent Display Market, By Display Size 2021 – 2033 (USD Million)
Table 37 Mexico Transparent Display Market, By Technology 2021 – 2033 (USD Million)
Table 38 Mexico Transparent Display Market, By End Use 2021 – 2033 (USD Million)
Table 39 Europe Transparent Display Market, By Resolution 2021 – 2033 (USD Million)
Table 40 Europe Transparent Display Market, By Display Size 2021 – 2033 (USD Million)
Table 41 Europe Transparent Display Market, By Technology 2021 – 2033 (USD Million)
Table 42 Europe Transparent Display Market, By End Use 2021 – 2033 (USD Million)
Table 43 U.K. Transparent Display Market, By Resolution 2021 – 2033 (USD Million)
Table 44 U.K. Transparent Display Market, By Display Size 2021 – 2033 (USD Million)
Table 45 U.K. Transparent Display Market, By Technology 2021 – 2033 (USD Million)
Table 46 U.K. Transparent Display Market, By End Use 2021 – 2033 (USD Million)
Table 47 Germany Transparent Display Market, By Resolution 2021 – 2033 (USD Million)
Table 48 Germany Transparent Display Market, By Display Size 2021 – 2033 (USD Million)
Table 49 Germany Transparent Display Market, By Technology 2021 – 2033 (USD Million)
Table 50 Germany Transparent Display Market, By End Use 2021 – 2033 (USD Million)
Table 51 France Transparent Display Market, By Resolution 2021 – 2033 (USD Million)
Table 52 France Transparent Display Market, By Display Size 2021 – 2033 (USD Million)
Table 53 France Transparent Display Market, By Technology 2021 – 2033 (USD Million)
Table 54 France Transparent Display Market, By End Use 2021 – 2033 (USD Million)
Table 55 Asia Pacific Transparent Display Market, By Resolution 2021 – 2033 (USD Million)
Table 56 Asia Pacific Transparent Display Market, By Display Size 2021 – 2033 (USD Million)
Table 57 Asia Pacific Transparent Display Market, By Technology 2021 – 2033 (USD Million)
Table 58 Asia Pacific Transparent Display Market, By End Use 2021 – 2033 (USD Million)
Table 59 China Transparent Display Market, By Resolution 2021 – 2033 (USD Million)
Table 60 China Transparent Display Market, By Display Size 2021 – 2033 (USD Million)
Table 61 China Transparent Display Market, By Technology 2021 – 2033 (USD Million)
Table 62 China Transparent Display Market, By End Use 2021 – 2033 (USD Million)
Table 63 Japan Transparent Display Market, By Resolution 2021 – 2033 (USD Million)
Table 64 Japan Transparent Display Market, By Display Size 2021 – 2033 (USD Million)
Table 65 Japan Transparent Display Market, By Technology 2021 – 2033 (USD Million)
Table 66 Japan Transparent Display Market, By End Use 2021 – 2033 (USD Million)
Table 67 India Transparent Display Market, By Resolution 2021 – 2033 (USD Million)
Table 68 India Transparent Display Market, By Display Size 2021 – 2033 (USD Million)
Table 69 India Transparent Display Market, By Technology 2021 – 2033 (USD Million)
Table 70 India Transparent Display Market, By End Use 2021 – 2033 (USD Million)
Table 71 South Korea Transparent Display Market, By Resolution 2021 – 2033 (USD Million)
Table 72 South Korea Transparent Display Market, By Display Size 2021 – 2033 (USD Million)
Table 73 South Korea Transparent Display Market, By Technology 2021 – 2033 (USD Million)
Table 74 South Korea Transparent Display Market, By End Use 2021 – 2033 (USD Million)
Table 75 Australia Transparent Display Market, By Resolution 2021 – 2033 (USD Million)
Table 76 Australia Transparent Display Market, By Display Size 2021 – 2033 (USD Million)
Table 77 Australia Transparent Display Market, By Technology 2021 – 2033 (USD Million)
Table 78 Australia Transparent Display Market, By End Use 2021 – 2033 (USD Million)
Table 79 Latin America Transparent Display Market, By Resolution 2021 – 2033 (USD Million)
Table 80 Latin America Transparent Display Market, By Display Size 2021 – 2033 (USD Million)
Table 81 Latin America Transparent Display Market, By Technology 2021 – 2033 (USD Million)
Table 82 Latin America Transparent Display Market, By End Use 2021 – 2033 (USD Million)
Table 83 Brazil Transparent Display Market, By Resolution 2021 – 2033 (USD Million)
Table 84 Brazil Transparent Display Market, By Display Size 2021 – 2033 (USD Million)
Table 85 Brazil Transparent Display Market, By Technology 2021 – 2033 (USD Million)
Table 86 Brazil Transparent Display Market, By End Use 2021 – 2033 (USD Million)
Table 87 MEA Transparent Display Market, By Resolution 2021 – 2033 (USD Million)
Table 88 MEA Transparent Display Market, By Display Size 2021 – 2033 (USD Million)
Table 89 MEA Transparent Display Market, By Technology 2021 – 2033 (USD Million)
Table 90 MEA Transparent Display Market, By End Use 2021 – 2033 (USD Million)
Table 91 Saudi Arabia Transparent Display Market, By Resolution 2021 – 2033 (USD Million)
Table 92 Saudi Arabia Transparent Display Market, By Display Size 2021 – 2033 (USD Million)
Table 93 Saudi Arabia Transparent Display Market, By Technology 2021 – 2033 (USD Million)
Table 94 Saudi Arabia Transparent Display Market, By End Use 2021 – 2033 (USD Million)
Table 95 UAE Transparent Display Market, By Resolution 2021 – 2033 (USD Million)
Table 96 UAE Transparent Display Market, By Display Size 2021 – 2033 (USD Million)
Table 97 UAE Transparent Display Market, By Technology 2021 – 2033 (USD Million)
Table 98 UAE Transparent Display Market, By End Use 2021 – 2033 (USD Million)
Table 99 South Africa Transparent Display Market, By Resolution 2021 – 2033 (USD Million)
Table 100 South Africa Transparent Display Market, By Display Size 2021 – 2033 (USD Million)
Table 101 South Africa Transparent Display Market, By Technology 2021 – 2033 (USD Million)
Table 102 South Africa Transparent Display Market, By End Use 2021 – 2033 (USD Million)
List of Figures
Fig. 1 Transparent display market segmentation
Fig. 2 Information procurement
Fig. 3 Data analysis models
Fig. 4 Market formulation and validation
Fig. 5 Data validating & publishing
Fig. 6 Transparent display market snapshot
Fig. 7 Transparent display market segment snapshot
Fig. 8 Transparent display market competitive landscape snapshot
Fig. 9 Market research process
Fig. 10 Market driver relevance analysis (current & future impact)
Fig. 11 Market restraint relevance analysis (current & future impact)
Fig. 12 Transparent display market, by resolution, key takeaways
Fig. 13 Transparent display market, by resolution, market share, 2025 & 2033
Fig. 14 Ultra HD market estimates & forecasts, 2021 – 2033 (Revenue, USD Million)
Fig. 15 Full HD market estimates & forecasts, 2021 – 2033 (Revenue, USD Million)
Fig. 16 HD market estimates & forecasts, 2021 – 2033 (Revenue, USD Million)
Fig. 17 4K and above market estimates & forecasts, 2021 – 2033 (Revenue, USD Million)
Fig. 18 Transparent display market, by display size, key takeaways
Fig. 19 Transparent display market, by display size, market share, 2025 & 2033
Fig. 20 Small & medium market estimates & forecasts, 2021 – 2033 (Revenue, USD Million)
Fig. 21 Large market estimates & forecasts, 2021 – 2033 (Revenue, USD Million)
Fig. 22 Transparent display market, by technology, key takeaways
Fig. 23 Transparent display market, by technology, market share, 2025 & 2033
Fig. 24 LCD market estimates & forecasts, 2021 – 2033 (Revenue, USD Million)
Fig. 25 OLED market estimates & forecasts, 2021 – 2033 (Revenue, USD Million)
Fig. 26 Micro-LED market estimates & forecasts, 2021 – 2033 (Revenue, USD Million)
Fig. 27 Others market estimates & forecasts, 2021 – 2033 (Revenue, USD Million)
Fig. 28 Transparent display market, by end use, key takeaways
Fig. 29 Transparent display market, by end use, market share, 2025 & 2033
Fig. 30 Consumer electronics market estimates & forecasts, 2021 – 2033 (Revenue, USD Million)
Fig. 31 Healthcare market estimates & forecasts, 2021 – 2033 (Revenue, USD Million)
Fig. 32 Automotive market estimates & forecasts, 2021 – 2033 (Revenue, USD Million)
Fig. 33 Aerospace and defense market estimates & forecasts, 2021 – 2033 (Revenue, USD Million)
Fig. 34 Industrial & manufacturing market estimates & forecasts, 2021 – 2033 (Revenue, USD Million)
Fig. 35 Retail market estimates & forecasts, 2021 – 2033 (Revenue, USD Million)
Fig. 36 Others market estimates & forecasts, 2021 – 2033 (Revenue, USD Million)
Fig. 37 Regional marketplace: key takeaways
Fig. 38 North America transparent display market estimates & forecast, 2021 – 2033 (Revenue, USD Million)
Fig. 39 U.S. transparent display market estimates & forecast, 2021 – 2033 (Revenue, USD Million)
Fig. 40 Canada transparent display market estimates & forecast, 2021 – 2033 (Revenue, USD Million)
Fig. 41 Mexico transparent display market estimates & forecast, 2021 – 2033 (Revenue, USD Million)
Fig. 42 Europe transparent display market estimates & forecast, 2021 – 2033 (Revenue, USD Million)
Fig. 43 U.K. transparent display market estimates & forecast, 2021 – 2033 (Revenue, USD Million)
Fig. 44 Germany transparent display market estimates & forecast, 2021 – 2033 (Revenue, USD Million)
Fig. 45 France transparent display market estimates & forecast, 2021 – 2033 (Revenue, USD Million)
Fig. 46 Asia Pacific transparent display market estimates & forecast, 2021 – 2033 (Revenue, USD Million)
Fig. 47 China transparent display market estimates & forecast, 2021 – 2033 (Revenue, USD Million)
Fig. 48 Japan transparent display market estimates & forecast, 2021 – 2033 (Revenue, USD Million)
Fig. 49 India transparent display market estimates & forecast, 2021 – 2033 (Revenue, USD Million)
Fig. 50 South Korea transparent display market estimates & forecast, 2021 – 2033 (Revenue, USD Million)
Fig. 51 Australia transparent display market estimates & forecast, 2021 – 2033 (Revenue, USD Million)
Fig. 52 Latin America transparent display market estimates & forecast, 2021 – 2033 (Revenue, USD Million)
Fig. 53 Brazil transparent display market estimates & forecast, 2021 – 2033 (Revenue, USD Million)
Fig. 54 MEA transparent display market estimates & forecast, 2021 – 2033 (Revenue, USD Million)
Fig. 55 Saudi Arabia transparent display market estimates & forecast, 2021 – 2033 (Revenue, USD Million)
Fig. 56 UAE transparent display market estimates & forecast, 2021 – 2033 (Revenue, USD Million)
Fig. 57 South Africa transparent display market estimates & forecast, 2021 – 2033 (Revenue, USD Million)
Fig. 58 Key company categorization
Fig. 59 Strategy framework