Recycled Composites Market Size, Share & Trends Analysis Report
Recycled Composites Market Size, Share & Trends Analysis Report By End Use (Automotive & Transportation, Aerospace, Construction & Infrastructure, Industrial End Uses), By Fiber Type (rCF, rGF), By Region, And Segment Forecasts, 2025 - 2033
リサイクル複合材料市場 - 最終用途(自動車・輸送、航空宇宙、建設・インフラ、工業最終用途)、繊維タイプ別(rCF、rGF)、地域、セグメント別予測による市場規模、成長と動向分析レポート 2025-2033年
| 出版 | Grand View Research |
| 出版年月 | 2025年12月 |
| ページ数 | 101 |
| 価格 | 記載以外のライセンスについてはお問合せください |
| シングルユーザ | USD 5,950 |
| 種別 | 英文調査報告書 |
| 商品番号 | SMR-1183711837 |

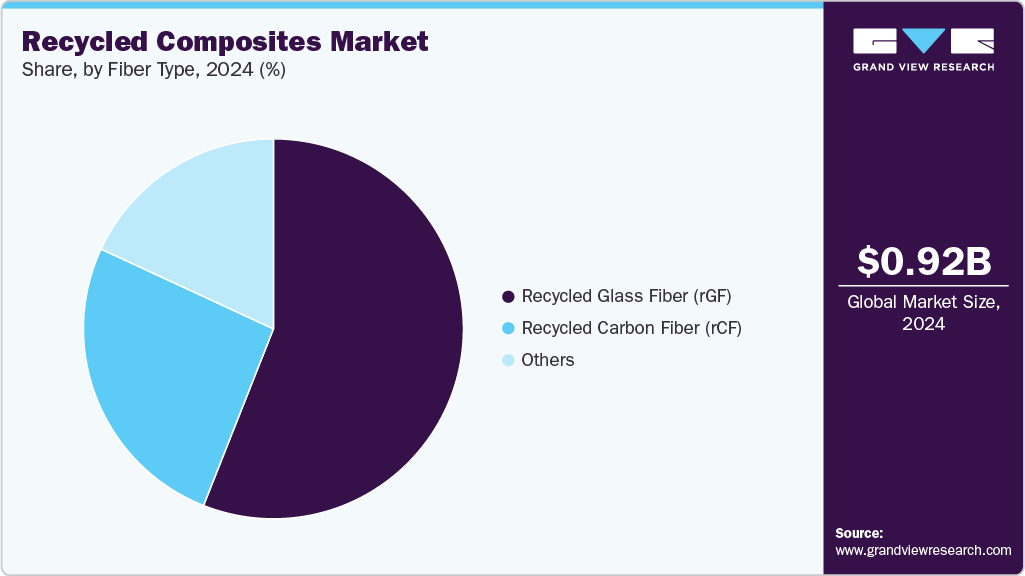
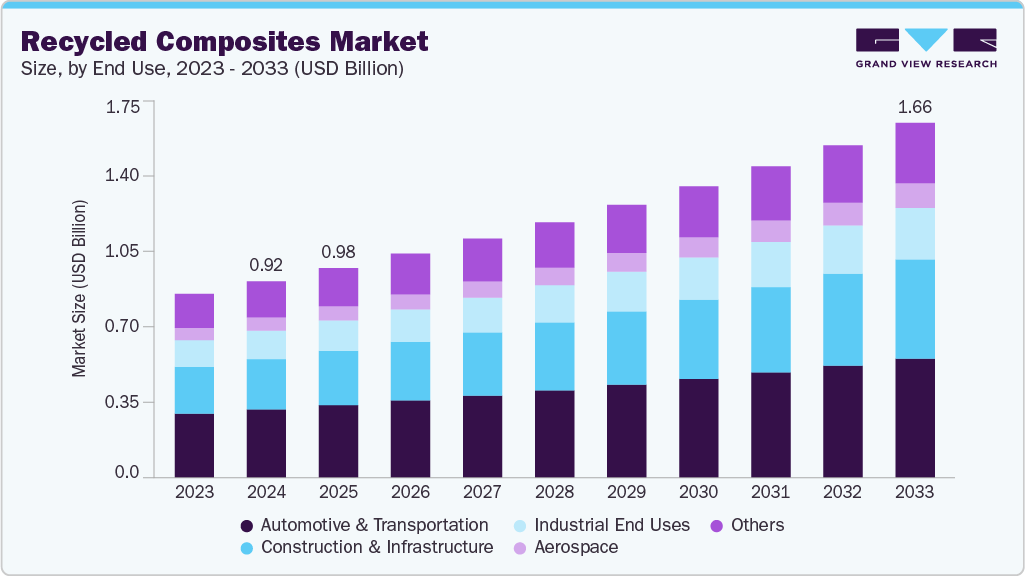
世界のリサイクル複合材市場規模は、2024年には9億2,060万米ドルと推定され、2033年には16億6,430万米ドルに達すると予想されています。これは、産業セクター全体における持続可能性への関心の高まりを背景に、2025年から2033年にかけて6.8%の年平均成長率(CAGR)で拡大する見込みです。政府や規制当局は、廃棄物の発生を最小限に抑え、二酸化炭素排出量を削減するための厳格なガイドラインの導入をますます進めています。
その結果、メーカーは環境コンプライアンス基準を満たすため、リサイクル複合材料への移行を進めています。この移行は、主要な業界プレーヤーが採用している企業の持続可能性への取り組みと循環型経済戦略によってさらに後押しされています。これらの要因が相まって、市場拡大のための強力な政策的かつ価値観主導の基盤が構築されています。自動車、航空宇宙、建設、消費財などの最終用途産業からの需要の高まりも、市場の成長に大きく貢献しています。軽量で耐久性があり、エネルギー効率の高い材料は、特に輸送において、性能向上と燃料消費量の削減に不可欠です。リサイクル複合材料は、バージン材料よりも低コストでこれらの利点を提供するため、魅力的な代替材料となっています。非構造および半構造最終用途におけるリサイクル複合材料の使用増加は、市場での受容の拡大を反映しています。産業界が効率性とコスト削減を優先するにつれて、リサイクル複合材料の需要は加速し続けています。
リサイクルプロセスにおける技術の進歩は、市場をさらに前進させています。メカニカルリサイクルとケミカルリサイクルの革新により、材料回収率の向上とリサイクル繊維および樹脂の品質向上が実現しました。加工技術の向上により、バージン材に匹敵する性能特性を持つ複合材の製造が可能になりました。これらの改善により、技術的障壁が低減され、最終用途の可能性が広がります。結果として、技術主導の改善は、リサイクル複合材製品の全体的な価値提案を強化します。
Recycled Composites Market Summary
The global recycled composites market size was estimated at USD 920.6 million in 2024 and is expected to reach USD 1664.3 million by 2033, expanding at a CAGR of 6.8% from 2025 to 2033, driven by the rising emphasis on sustainability across industrial sectors. Governments and regulatory bodies are increasingly implementing strict guidelines to minimize waste generation and reduce carbon footprints.
recycled-composites-market-size
As a result, manufacturers are shifting toward recycled composite materials to meet environmental compliance standards. This transition is further supported by corporate sustainability initiatives and circular-economy strategies adopted by major industry players. Together, these factors create a strong policy- and value-driven foundation for market expansion. Growing demand from end-use industries such as automotive, aerospace, construction, and consumer goods also contributes significantly to market growth. Lightweight, durable, and energy-efficient materials are essential for improving performance and reducing fuel consumption, especially in transportation. Recycled composites offer these advantages at a lower cost than virgin materials, making them an attractive alternative. Their increasing use in non-structural and semi-structural End Uses reflects the market’s widening acceptance. As industries prioritize efficiency and cost reduction, the demand for recycled composites continues to accelerate.
Technological advancements in recycling processes are further propelling the market forward. Innovations in mechanical and chemical recycling enable higher material recovery rates and improved quality of recycled fibers and resins. Enhanced processing techniques have made it possible to produce composites with performance characteristics comparable to virgin materials. These improvements reduce technical barriers and broaden end-use possibilities. Consequently, technology-driven enhancements strengthen the overall value proposition of recycled composite products.
Global Recycled Composites Market Report Scope
| Report Attribute | Details |
| Market size value in 2025 | USD 983.2 million |
| Revenue forecast in 2033 | USD 1664.3 million |
| Growth rate | CAGR of 6.8% from 2025 to 2033 |
| Base year for estimation | 2024 |
| Historical data | 2021 – 2023 |
| Forecast period | 2025 – 2033 |
| Quantitative units | Revenue in USD million/billion and CAGR from 2025 to 2033 |
| Report coverage | Revenue forecast, company ranking, competitive landscape, growth factors, and trends |
| Segments covered | Fiber type, end use, region |
| Regional scope | North America; Europe; Asia Pacific; Central & South America; Middle East & Africa |
| Country scope | U.S.; Canada; Mexico; U.K.; Germany; France; Italy; Spain; China; India; Japan |
| Key companies profiled | Trex Company, Inc.; Fiberon; UPM; SGL Carbon; Toray Industries, Inc.; Vartega Inc.; Carbon Conversions Inc.; Solvay; Mitsubishi Chemical Corporation |
| Customization scope | Free report customization (equivalent up to 8 analysts’ working days) with purchase. Addition or alteration to country, regional & segment scope. |
Global Recycled Composites Market Report Segmentation
This report forecasts revenue growth at global, regional, and country levels and provides an analysis of the latest industry trends in each of the sub-segments from 2021 to 2033. For this study, Grand View Research has segmented the global recycled composites market report based on end use, fiber type and region.
• End Use Outlook (Revenue, USD Million, 2021 – 2033)
• Automotive & Transportation
• Aerospace
• Construction & Infrastructure
• Industrial End Uses
• Others
• Fiber Type Outlook (Revenue, USD Million, 2021 – 2033)
• Recycled Carbon Fiber (rCF)
• Recycled Glass Fiber (rGF)
• Other Recycled Fibers
• Regional Outlook (Revenue, USD Million, 2021 – 2033)
• North America
o U.S.
o Canada
o Mexico
• Europe
o Germany
o UK
o France
o Italy
o Spain
• Asia Pacific
o China
o Japan
o India
• Central & South America
• Middle East & Africaa
Table of Contents
Chapter 1. Methodology and Scope
1.1. Research Methodology
1.2. Research Scope & Assumption
1.3. Information Procurement
1.3.1. Purchased Database
1.3.2. GVR’s Internal Database
1.3.3. Secondary Sources & Third-Party Perspectives
1.3.4. Primary Research
1.4. Information Analysis
1.4.1. Data Analysis Models
1.5. Market Formulation & Data Visualization
1.6. List of Data Sources
Chapter 2. Executive Summary
2.1. Market Outlook, 2024 (USD Million)
2.2. Segmental Outlook
2.3. Competitive Insights
Chapter 3. Recycled Composites Market Variables, Trends & Scope
3.1. Market Lineage/Ancillary Market Outlook
3.2. Industry Value Chain Analysis
3.2.1. Sales Channel Analysis
3.3. Regulatory Framework
3.3.1. Analyst Perspective
3.3.2. Regulations & Standards
3.4. Market Dynamics
3.4.1. Market Driver Analysis
3.4.2. Market Restraint Analysis
3.4.3. Industry Opportunities
3.4.4. Industry Challenges
3.5. Business Environmental Tools Analysis: Global Recycled Composites Market
3.5.1. Porter’s Five Forces Analysis
3.5.1.1. Bargaining Power of Suppliers
3.5.1.2. Bargaining Power of Buyers
3.5.1.3. Threat of Substitution
3.5.1.4. Threat of New Entrants
3.5.1.5. Competitive Rivalry
3.5.2. PESTLE Analysis
3.5.2.1. Political Landscape
3.5.2.2. Economic Landscape
3.5.2.3. Social Landscape
3.5.2.4. Technology Landscape
3.5.2.5. Environmental Landscape
3.5.2.6. Legal Landscape
3.6. Market Disruption Analysis
Chapter 4. Global Recycled Composites Market: End Use Estimates & Trend Analysis
4.1. Key Takeaways
4.2. End Use Movement Analysis & Market Share, 2024 & 2033
4.3. Global Recycled Composites Market By End Use, 2021 – 2033 (USD Million)
4.4. Automotive & Transportation
4.4.1. Recycled Composites Market Estimates And Forecasts, for Automotive & Transportation, 2021-2033 (USD Million)
4.5. Aerospace
4.5.1. Recycled Composites Market Estimates And Forecasts, for Aerospace, 2021-2033 (USD Million)
4.6. Construction & Infrastructure
4.6.1. Recycled Composites Market Estimates And Forecasts, for Construction & Infrastructure, 2021-2033 (USD Million)
4.7. Industrial End Uses
4.7.1. Recycled Composites Market Estimates And Forecasts, for Industrial End Uses, 2021-2033 (USD Million)
4.8. Others
4.8.1. Recycled Composites Market Estimates And Forecasts, for Others, 2021-2033 (USD Million)
Chapter 5. Global Recycled Composites Market: Fiber Type Estimates & Trend Analysis
5.1. Key Takeaways
5.2. Fiber Type Movement Analysis & Market Share, 2024 & 2033
5.3. Global Recycled Composites Market By Fiber Type, 2021 – 2033 (USD Million)
5.4. Recycled Carbon Fiber (rCF)
5.4.1. Recycled Carbon Fiber (rCF) Market Estimates And Forecasts, 2021-2033 (USD Million)
5.5. Recycled Glass Fiber (rGF)
5.5.1. Recycled Glass Fiber (rGF) Market Estimates And Forecasts, 2021-2033 (USD Million)
5.6. Other Glass Fibers
5.6.1. Other Recycled Fibers Market Estimates And Forecasts, by Other Recycled Fibers, 2021-2033 (USD Million)
Chapter 6. Global Recycled Composites Market: Regional Estimates & Trend Analysis
6.1. Key Takeaways
6.2. Regional Market Share Analysis, 2024 & 2033
6.3. North America
6.3.1. North America Recycled Composites Market Estimates And Forecasts, 2021 – 2033 (USD Million)
6.3.2. North America Recycled Composites Market Estimates And Forecasts, By End Use, 2021 – 2033 (USD Million)
6.3.3. North America Recycled Composites Market Estimates And Forecasts, By Fiber Type, 2021 – 2033 (USD Million)
6.3.4. U.S.
6.3.4.1. U.S. Recycled Composites Market Estimates And Forecasts, 2021 – 2033 (USD Million)
6.3.4.2. U.S. Recycled Composites Market Estimates And Forecasts, By End Use, 2021 – 2033 (USD Million)
6.3.4.3. U.S. Recycled Composites Market Estimates And Forecasts, By Fiber Type, 2021 – 2033 (USD Million)
6.3.5. Canada
6.3.5.1. Canada Recycled Composites Market Estimates And Forecasts, 2021 – 2033 (USD Million)
6.3.5.2. Canada Recycled Composites Market Estimates And Forecasts, By End Use, 2021 – 2033 (USD Million)
6.3.5.3. Canada Recycled Composites Market Estimates And Forecasts, By Fiber Type, 2021 – 2033 (USD Million)
6.3.6. Mexico
6.3.6.1. Mexico Recycled Composites Market Estimates And Forecasts, 2021 – 2033 (USD Million)
6.3.6.2. Mexico Recycled Composites Market Estimates And Forecasts, By End Use, 2021 – 2033 (USD Million)
6.3.6.3. Mexico Recycled Composites Market Estimates And Forecasts, By Fiber Type, 2021 – 2033 (USD Million)
6.4. Europe
6.4.1. Europe Recycled Composites Market Estimates And Forecasts, 2021 – 2033 (USD Million)
6.4.2. Europe Recycled Composites Market Estimates And Forecasts, By End Use, 2021 – 2033 (USD Million)
6.4.3. Europe Recycled Composites Market Estimates And Forecasts, By Fiber Type, 2021 – 2033 (USD Million)
6.4.4. Germany
6.4.4.1. Germany Recycled Composites Market Estimates And Forecasts, 2021 – 2033 (USD Million)
6.4.4.2. Germany Recycled Composites Market Estimates And Forecasts, By End Use, 2021 – 2033 (USD Million)
6.4.4.3. Germany Recycled Composites Market Estimates And Forecasts, By Fiber Type, 2021 – 2033 (USD Million)
6.4.5. UK
6.4.5.1. UK Recycled Composites Market Estimates And Forecasts, 2021 – 2033 (USD Million)
6.4.5.2. UK Recycled Composites Market Estimates And Forecasts, By End Use, 2021 – 2033 (USD Million)
6.4.5.3. UK Recycled Composites Market Estimates And Forecasts, By Fiber Type, 2021 – 2033 (USD Million)
6.4.6. France
6.4.6.1. France Recycled Composites Market Estimates And Forecasts, 2021 – 2033 (USD Million)
6.4.6.2. France Recycled Composites Market Estimates And Forecasts, By End Use, 2021 – 2033 (USD Million)
6.4.6.3. France Recycled Composites Market Estimates And Forecasts, By Fiber Type, 2021 – 2033 (USD Million)
6.4.7. Italy
6.4.7.1. Italy Recycled Composites Market Estimates And Forecasts, 2021 – 2033 (USD Million)
6.4.7.2. Italy Recycled Composites Market Estimates And Forecasts, By End Use, 2021 – 2033 (USD Million)
6.4.7.3. Italy Recycled Composites Market Estimates And Forecasts, By Fiber Type, 2021 – 2033 (USD Million)
6.4.8. Spain
6.4.8.1. Spain Recycled Composites Market Estimates And Forecasts, 2021 – 2033 (USD Million)
6.4.8.2. Spain Recycled Composites Market Estimates And Forecasts, By End Use, 2021 – 2033 (USD Million)
6.4.8.3. Spain Recycled Composites Market Estimates And Forecasts, By Fiber Type, 2021 – 2033 (USD Million)
6.5. Asia Pacific
6.5.1. Asia Pacific Recycled Composites Market Estimates And Forecasts, 2021 – 2033 (USD Million)
6.5.2. Asia Pacific Recycled Composites Market Estimates And Forecasts, By End Use, 2021 – 2033 (USD Million)
6.5.3. Asia Pacific Recycled Composites Market Estimates And Forecasts, By Fiber Type, 2021 – 2033 (USD Million)
6.5.4. China
6.5.4.1. China Recycled Composites Market Estimates And Forecasts, 2021 – 2033 (USD Million)
6.5.4.2. China Recycled Composites Market Estimates And Forecasts, By End Use, 2021 – 2033 (USD Million)
6.5.4.3. China Recycled Composites Market Estimates And Forecasts, By Fiber Type, 2021 – 2033 (USD Million)
6.5.5. India
6.5.5.1. India Recycled Composites Market Estimates And Forecasts, 2021 – 2033 (USD Million)
6.5.5.2. India Recycled Composites Market Estimates And Forecasts, By End Use, 2021 – 2033 (USD Million)
6.5.5.3. India Recycled Composites Market Estimates And Forecasts, By Fiber Type, 2021 – 2033 (USD Million)
6.5.6. Japan
6.5.6.1. Japan Recycled Composites Market Estimates And Forecasts, 2021 – 2033 (USD Million)
6.5.6.2. Japan Recycled Composites Market Estimates And Forecasts, By End Use, 2021 – 2033 (USD Million)
6.5.6.3. Japan Recycled Composites Market Estimates And Forecasts, By Fiber Type, 2021 – 2033 (USD Million)
6.6. Central & South America
6.6.1. Central & South America Recycled Composites Market Estimates And Forecasts, 2021 – 2033 (USD Million)
6.6.2. Central & South America Recycled Composites Market Estimates And Forecasts, By End Use, 2021 – 2033 (USD Million)
6.6.3. Central & South America Recycled Composites Market Estimates And Forecasts, By Fiber Type, 2021 – 2033 (USD Million)
6.7. Middle East & Africa
6.7.1. Middle East & Africa Recycled Composites Market Estimates And Forecasts, 2021 – 2033 (USD Million)
6.7.2. Middle East & Africa Recycled Composites Market Estimates And Forecasts, By End Use, 2021 – 2033 (USD Million)
6.7.3. Middle East & Africa Recycled Composites Market Estimates And Forecasts, By Fiber Type, 2021 – 2033 (USD Million)
Chapter 7. Supplier Intelligence
7.1.1. Kraljic Matrix
7.1.2. Engagement Model
7.1.3. Negotiation Strategies
7.1.4. Sourcing Best Practices
7.1.5. Vendor Selection Criteria
Chapter 8. Competitive Landscape
8.1. Key Players, their Recent Developments, and their Impact on Industry
8.2. Competition Categorization
8.3. Company Market Position Analysis
8.4. Company Heat Map Analysis
8.5. Strategy Mapping, 2024
8.6. Company Listing
8.6.1. Trex Company, Inc.
8.6.1.1. Company Overview
8.6.1.2. Financial Performance
8.6.1.3. Product Benchmarking
8.6.1.4. Strategic Initiatives
8.6.2. Fiberon
8.6.2.1. Company Overview
8.6.2.2. Financial Performance
8.6.2.3. Product Benchmarking
8.6.2.4. Strategic Initiatives
8.6.3. UPM
8.6.3.1. Company Overview
8.6.3.2. Financial Performance
8.6.3.3. Product Benchmarking
8.6.3.4. Strategic Initiatives
8.6.4. SGL Carbon
8.6.4.1. Company Overview
8.6.4.2. Financial Performance
8.6.4.3. Product Benchmarking
8.6.4.4. Strategic Initiatives
8.6.5. Toray Industries, Inc.
8.6.5.1. Company Overview
8.6.5.2. Financial Performance
8.6.5.3. Product Benchmarking
8.6.5.4. Strategic Initiatives
8.6.6. Vartega Inc.
8.6.6.1. Company Overview
8.6.6.2. Financial Performance
8.6.6.3. Product Benchmarking
8.6.6.4. Strategic Initiatives
8.6.7. Carbon Conversions Inc.
8.6.7.1. Company Overview
8.6.7.2. Financial Performance
8.6.7.3. Product Benchmarking
8.6.7.4. Strategic Initiatives
8.6.8. Solvay
8.6.8.1. Company Overview
8.6.8.2. Financial Performance
8.6.8.3. Product Benchmarking
8.6.8.4. Strategic Initiatives
8.6.9. Mitsubishi Chemical Corporation
8.6.9.1. Company Overview
8.6.9.2. Financial Performance
8.6.9.3. Product Benchmarking
8.6.9.4. Strategic Initiatives
List of Tables
Table 1 Recycled Composites Market Estimates And Forecasts, for Automotive & Transportation, 2021-2033 (USD Million)
Table 2 Recycled Composites Market Estimates And Forecasts, for Aerospace, 2021-2033 (USD Million)
Table 3 Recycled Composites Market Estimates And Forecasts, for Construction & Infrastructure, 2021-2033 (USD Million)
Table 4 Recycled Composites Market Estimates And Forecasts, for Industrial End Uses, 2021-2033 (USD Million)
Table 5 Recycled Composites Market Estimates And Forecasts, for Others, 2021-2033 (USD Million)
Table 6 Recycled Composites Market Estimates And Forecasts, by Recycled Carbon Fiber (rCF), 2021-2033 (USD Million)
Table 7 Recycled Composites Market Estimates And Forecasts, by Recycled Glass Fiber (rGF), 2021-2033 (USD Million)
Table 8 Recycled Composites Market Estimates And Forecasts, by Other Recycled Fibers, 2021-2033 (USD Million)
Table 9 North America Recycled Composites Market Estimates And Forecasts, 2021 – 2033 (USD Million)
Table 10 North America Recycled Composites Market Estimates And Forecasts, By End Use, 2021 – 2033 (USD Million)
Table 11 North America Recycled Composites Market Estimates And Forecasts, By Fiber Type, 2021 – 2033 (USD Million)
Table 12 U.S. Recycled Composites Market Estimates And Forecasts, 2021 – 2033 (USD Million)
Table 13 U.S. Recycled Composites Market Estimates And Forecasts, By End Use, 2021 – 2033 (USD Million)
Table 14 U.S. Recycled Composites Market Estimates And Forecasts, By Fiber Type, 2021 – 2033 (USD Million)
Table 15 Canada Recycled Composites Market Estimates And Forecasts, 2021 – 2033 (USD Million)
Table 16 Canada Recycled Composites Market Estimates And Forecasts, By End Use, 2021 – 2033 (USD Million)
Table 17 Canada Recycled Composites Market Estimates And Forecasts, By Fiber Type, 2021 – 2033 (USD Million)
Table 18 Mexico Recycled Composites Market Estimates And Forecasts, 2021 – 2033 (USD Million)
Table 19 Mexico Recycled Composites Market Estimates And Forecasts, By End Use, 2021 – 2033 (USD Million)
Table 20 Mexico Recycled Composites Market Estimates And Forecasts, By Fiber Type, 2021 – 2033 (USD Million)
Table 21 Europe Recycled Composites Market Estimates And Forecasts, 2021 – 2033 (USD Million)
Table 22 Europe Recycled Composites Market Estimates And Forecasts, By End Use, 2021 – 2033 (USD Million)
Table 23 Europe Recycled Composites Market Estimates And Forecasts, By Fiber Type, 2021 – 2033 (USD Million)
Table 24 Germany Recycled Composites Market Estimates And Forecasts, 2021 – 2033 (USD Million)
Table 25 Germany Recycled Composites Market Estimates And Forecasts, By End Use, 2021 – 2033 (USD Million)
Table 26 Germany Recycled Composites Market Estimates And Forecasts, By Fiber Type, 2021 – 2033 (USD Million)
Table 27 UK Recycled Composites Market Estimates And Forecasts, 2021 – 2033 (USD Million)
Table 28 UK Recycled Composites Market Estimates And Forecasts, By End Use, 2021 – 2033 (USD Million)
Table 29 UK Recycled Composites Market Estimates And Forecasts, By Fiber Type, 2021 – 2033 (USD Million)
Table 30 France Recycled Composites Market Estimates And Forecasts, 2021 – 2033 (USD Million)
Table 31 France Recycled Composites Market Estimates And Forecasts, By End Use, 2021 – 2033 (USD Million)
Table 32 France Recycled Composites Market Estimates And Forecasts, By Fiber Type, 2021 – 2033 (USD Million)
Table 33 Italy Recycled Composites Market Estimates And Forecasts, 2021 – 2033 (USD Million)
Table 34 Italy Recycled Composites Market Estimates And Forecasts, By End Use, 2021 – 2033 (USD Million)
Table 35 Italy Recycled Composites Market Estimates And Forecasts, By Fiber Type, 2021 – 2033 (USD Million)
Table 36 Spain Recycled Composites Market Estimates And Forecasts, 2021 – 2033 (USD Million)
Table 37 Spain Recycled Composites Market Estimates And Forecasts, By End Use, 2021 – 2033 (USD Million)
Table 38 Spain Recycled Composites Market Estimates And Forecasts, By Fiber Type, 2021 – 2033 (USD Million)
Table 39 Asia Pacific Recycled Composites Market Estimates And Forecasts, 2021 – 2033 (USD Million)
Table 40 Asia Pacific Recycled Composites Market Estimates And Forecasts, By End Use, 2021 – 2033 (USD Million)
Table 41 Asia Pacific Recycled Composites Market Estimates And Forecasts, By Fiber Type, 2021 – 2033 (USD Million)
Table 42 China Recycled Composites Market Estimates And Forecasts, 2021 – 2033 (USD Million)
Table 43 China Recycled Composites Market Estimates And Forecasts, By End Use, 2021 – 2033 (USD Million)
Table 44 China Recycled Composites Market Estimates And Forecasts, By Fiber Type, 2021 – 2033 (USD Million)
Table 45 India Recycled Composites Market Estimates And Forecasts, 2021 – 2033 (USD Million)
Table 46 India Recycled Composites Market Estimates And Forecasts, By End Use, 2021 – 2033 (USD Million)
Table 47 India Recycled Composites Market Estimates And Forecasts, By Fiber Type, 2021 – 2033 (USD Million)
Table 48 Japan Recycled Composites Market Estimates And Forecasts, 2021 – 2033 (USD Million)
Table 49 Japan Recycled Composites Market Estimates And Forecasts, By End Use, 2021 – 2033 (USD Million)
Table 50 Japan Recycled Composites Market Estimates And Forecasts, By Fiber Type, 2021 – 2033 (USD Million)
Table 51 Central & South America Recycled Composites Market Estimates And Forecasts, 2021 – 2033 (USD Million)
Table 52 Central & South America Recycled Composites Market Estimates And Forecasts, By End Use, 2021 – 2033 (USD Million)
Table 53 Central & South America Recycled Composites Market Estimates And Forecasts, By Fiber Type, 2021 – 2033 (USD Million)
Table 54 Middle East & Africa Recycled Composites Market Estimates And Forecasts, 2021 – 2033 (USD Million)
Table 55 Middle East & Africa Recycled Composites Market Estimates And Forecasts, By End Use, 2021 – 2033 (USD Million)
Table 56 Middle East & Africa Recycled Composites Market Estimates And Forecasts, By Fiber Type, 2021 – 2033 (USD Million)
List of Figures
Fig. 1 Information Procurement
Fig. 2 Primary Research Pattern
Fig. 3 Primary Research Process
Fig. 4 Market Research Approaches – Bottom-Up Approach
Fig. 5 Market Research Approaches – Top-Down Approach
Fig. 6 Market Research Approaches – Combined Approach
Fig. 7 Market Snapshot
Fig. 8 Segmental Outlook
Fig. 9 Competitive Outlook
Fig. 10 Recycled Composites Market – Value Chain Analysis
Fig. 11 Recycled Composites Market – Sales Channel Analysis
Fig. 12 Market Drivers Impact Analysis
Fig. 13 Market Restraint Impact Analysis
Fig. 14 Industry Analysis – PORTERS
Fig. 15 Industry Analysis – PESTEL by SWOT
Fig. 16 End Use: Key Takeaways
Fig. 17 End Use: Market Share, 2024 & 2033
Fig. 18 Fiber Type: Key Takeaways
Fig. 19 Fiber Type: Market Share, 2024 & 2033
Fig. 20 Region, 2024 & 2033 (USD Million)
Fig. 21 Regional Marketplace: Key Takeaways
Fig. 22 Kraljic Matrix
Fig. 23 Engagement Model
Fig. 24 Sourcing Best Practices
Fig. 25 Sourcing Best Practices
Fig. 26 Competition Categorization
Fig. 27 Company Market Positioning
Fig. 28 Strategy Mapping, 2024