精密農業化学品市場 - 製品(精密肥料、精密植物成長調整剤)、用途別(穀類・穀物、油糧種子・豆類、果物・野菜)、地域、セグメント別予測による市場規模、成長と動向分析レポート 2025-2033年
Precision Agriculture Chemicals Market Size, Share & Trends Analysis Report By Product (Precision Fertilizers, Precision Plant Growth Regulators), By Application (Cereals & Grains, Oilseeds & Pulses, Fruits & Vegetables), By Region, And Segment Forecasts, 2025 - 2033
| 出版 | Grand View Research |
| 出版年月 | 2025年12月 |
| ページ数 | 80 |
| 価格 | 記載以外のライセンスについてはお問合せください |
| シングルユーザ | USD 5,950 |
| 種別 | 英文調査報告書 |
| 商品番号 | SMR-14816 |

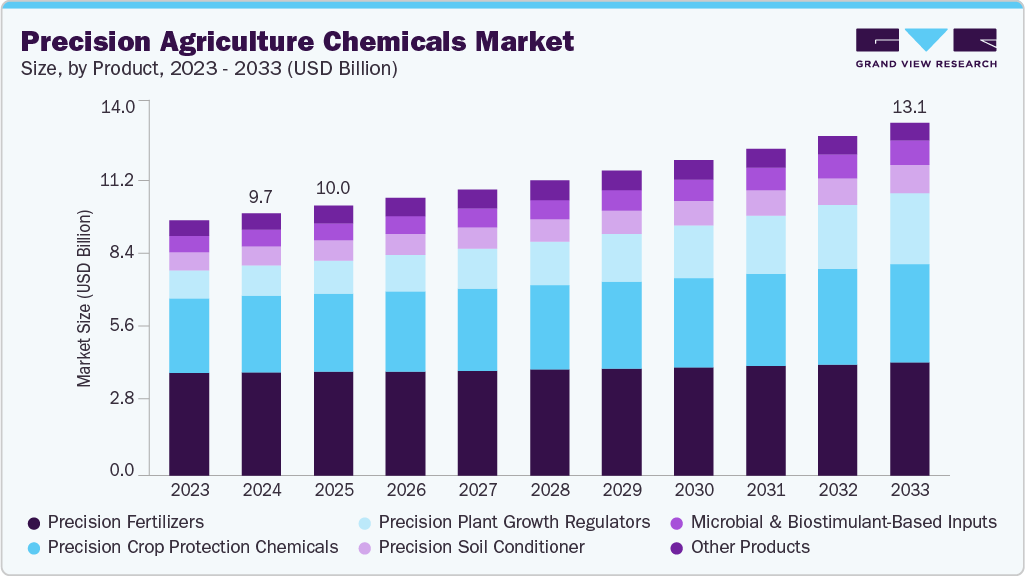
世界の精密農業化学品市場規模は、2024年には97億3,920万米ドルと推定され、2025年から2033年にかけて年平均成長率3.4%で成長し、2033年には131億980万米ドルに達すると予測されています。この業界は、世界的な食糧需要の高まりと耕作地の縮小を背景に、作物の生産性と資源効率を向上させるニーズの高まりによって牽引されています。
農家は、肥料、農薬、成長調整剤などの投入資材を、適切な量、適切な場所、適切な時期に施用することで、より効率的に使用する精密農法を導入するケースが増えています。この的確な施用は、過剰使用の削減、環境への影響の最小化、そして収量の安定化につながり、精密に配合された農薬は現代の高効率農業に不可欠な要素となっています。
もう一つの重要な推進力は、GPS誘導式農業機械、土壌センサー、衛星画像、可変施肥(VRA)システムといったデジタル農業技術の統合の進展です。これらの技術は、リアルタイムの圃場モニタリングとデータに基づく意思決定を可能にし、精密配合された農薬の有効性を高めます。デジタルインフラが農業現場に深く浸透するにつれ、制御放出型肥料やセンサー対応農薬など、スマート施肥システムに対応した農薬の需要は、先進国市場と新興国市場の両方で加速し続けています。
規制圧力と持続可能性目標も市場の成長を後押ししています。政府や国際機関は、土壌劣化、化学物質の流出、水質汚染を軽減するため、従来の農薬の使用に対してより厳しい規制を課しています。これにより、大規模農家と小規模農家の両方が、総投入量を削減しながら生産量を維持または向上させることができる精密農薬へと移行しています。さらに、輸出市場における持続可能で残留物のない農産物への需要の高まりも、高度な精密農薬投入の導入をさらに促進しています。
Precision Agriculture Chemicals Market Summary
The global precision agriculture chemicals market size was estimated at USD 9,739.2 million in 2024 and is projected to reach USD 13,109.8 million by 2033, growing at a CAGR of 3.4% from 2025 to 2033. The industry is driven by the growing need to improve crop productivity and resource efficiency amid rising global food demand and shrinking arable land.
Farmers are increasingly adopting precision farming practices to optimize input usage, such as fertilizers, pesticides, and growth regulators, by applying the right quantity at the right place and time. This targeted application reduces overuse, minimizes environmental impact, and improves yield consistency, making precision-formulated chemicals an essential component of modern, high-efficiency agriculture.
Another critical driver is the increasing integration of digital agriculture technologies such as GPS-guided machinery, soil sensors, satellite imagery, and variable rate application (VRA) systems. These technologies enable real-time field monitoring and data-driven decision-making, which in turn increases the effectiveness of precision-formulated chemicals. As digital infrastructure penetrates deeper into agricultural practices, the demand for chemicals compatible with smart application systems-such as controlled-release fertilizers and sensor-compatible crop protection products-continues to accelerate across developed and emerging markets.
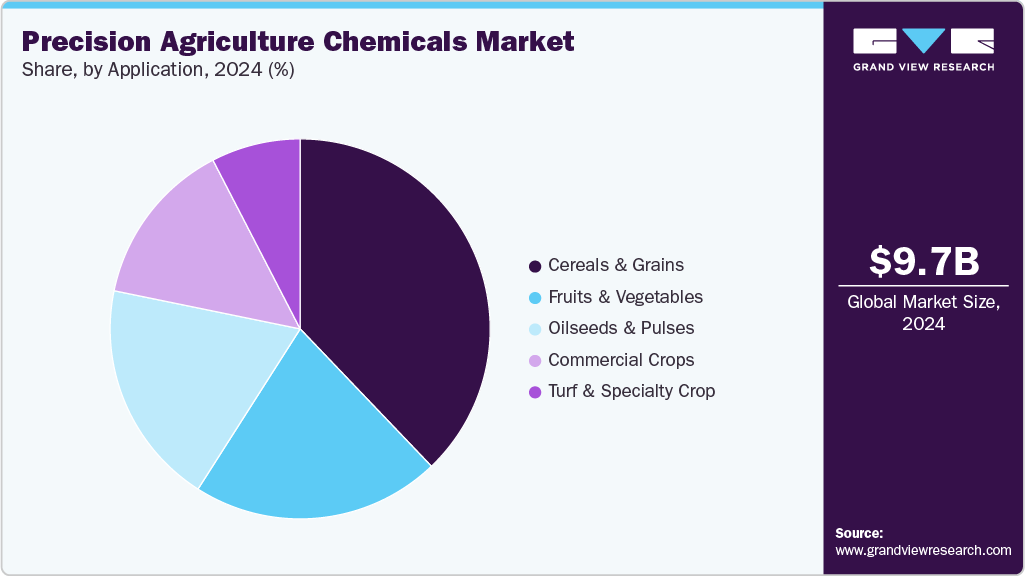
precision-agriculture-chemicals-market-share
Regulatory pressure and sustainability goals are also strengthening market growth. Governments and international bodies are imposing stricter regulations on conventional agrochemical use to reduce soil degradation, chemical runoff, and water contamination. This is pushing both large-scale and smallholder farmers toward precision agriculture chemicals that enable lower total input consumption while maintaining or improving output. Additionally, rising demand for sustainable and residue-free agricultural produce from export markets is further promoting the adoption of advanced precision chemical inputs.
Precision Agriculture Chemicals Market Report Scope
| Report Attribute | Details |
| Market size value in 2025 | USD 10,018.2 million |
| Revenue forecast in 2033 | USD 13,109.8 million |
| Growth rate | CAGR of 3.4% from 2025 to 2033 |
| Base year for estimation | 2024 |
| Historical data | 2018 – 2023 |
| Forecast period | 2025 – 2033 |
| Quantitative units | Volume in kilotons; revenue in USD million/billion, and CAGR from 2025 to 2033 |
| Report coverage | Volume & revenue forecast, competitive landscape, growth factors, and trends |
| Segments covered | Product, application, region |
| Regional scope | North America; Europe; Asia Pacific: Latin America; Middle East & Africa |
| Country scope | U.S.; Canada; Mexico; Germany; UK; France; Italy; Spain; China; India; Japan; South Korea; Brazil; Argentina; Saudi Arabia; South Africa |
| Key companies profiled | BASF SE; Dow; DuPont; SABIC; Evonik Industries AG; Huntsman Corporation; Covestro AG; Wacker Chemie AG; Eastman Chemical Company; Syngenta AG; Mitsubishi Chemical Corporation; LANXESS AG; Solvay S.A., Albemarle Corporation, AkzoNobel N.V. |
| Customization scope | Free report customization (equivalent up to 8 analyst’s working days) with purchase. Addition or alteration to country, regional, and segment scope. |
Global Precision Agriculture Chemicals Market Report Segmentation
This report forecasts volume & revenue growth at the global, regional and country levels and provides an analysis of the latest industry trends in each of the sub-segments from 2018 to 2033. For this study, Grand View Research has segmented the global precision agriculture chemicals market report based on product, application, and region:
- Product Outlook (Volume, Kilotons; Revenue, USD Million, 2018 – 2033)
- Precision Fertilizers
- Precision Crop Protection Chemicals
- Precision Plant Growth Regulators
- Precision Soil Conditioner
- Microbial & Biostimulant-Based Inputs
- Other Products
- Application Outlook (Volume, Kilotons; Revenue, USD Million, 2018 – 2033)
- Cereals & Grains
- Oilseeds & Pulses
- Fruits & Vegetables
- Commercial Crops
- Turf & Specialty Crop
- Regional Outlook (Volume, Kilotons; Revenue, USD Million, 2018 – 2033)
- North America
o U.S.
o Canada
o Mexico
- Europe
o Germany
o UK
o France
o Italy
o Spain
- Asia Pacific
o China
o India
o Japan
o South Korea
- Latin America
o Brazil
o Argentina
- Middle East & Africa
o Saudi Arabia
o South Africa
Table of Contents
Chapter 1. Methodology and Scope
1.1. Research Methodology
1.1.1. Market Segmentation
1.1.2. Market Definition
1.2. Research Scope & Assumptions
1.3. Information Procurement
1.3.1. Purchased Database
1.3.2. GVR’s Internal Database
1.3.3. Secondary Sources & Third-Party Perspectives
1.3.4. Primary Research
1.4. Information Analysis
1.4.1. Data Analysis Models
1.5. Market Formulation & Data Visualization
1.6. Data Validation & Publishing
1.7. List of Abbreviations
Chapter 2. Executive Summary
2.1. Market Snapshot, 2024 (USD Million)
2.2. Segmental Snapshot
2.3. Competitive Landscape Snapshot
Chapter 3. Global Precision Agriculture Chemicals Market Variables, Trends, and Scope
3.1. Market Lineage Outlook
3.2. Industry Value Chain Analysis
3.2.1. Raw Material Trends
3.2.2. Technology Trends
3.2.3. Sales Channel Analysis
3.3. Price Trend Analysis, 2018 – 2033 (USD/KG)
3.3.1. Factors Influencing Prices
3.4. Regulatory Framework
3.5. Market Dynamics
3.5.1. Market Driver Analysis
3.5.2. Market Restraint Analysis
3.5.3. Market Opportunity Analysis
3.5.4. Market Challenge Analysis
3.6. Business Environment Analysis
3.6.1. Porter’s Five Forces Analysis
3.6.2. PESTEL Analysis
Chapter 4. Global Precision Agriculture Chemicals Market: Product Estimates & Trend Analysis
4.1. Key Takeaways
4.2. Product Movement Analysis & Market Share, 2024 & 2033
4.2.1. Precision Fertilizers
4.2.1.1. Market estimates and forecasts, 2018 – 2033 (Kilotons) (USD Million)
4.2.2. Precision Crop Protection Chemicals
4.2.2.1. Market estimates and forecasts, 2018 – 2033 (Kilotons) (USD Million)
4.2.3. Precision Plant Growth Regulators
4.2.3.1. Market estimates and forecasts, 2018 – 2033 (Kilotons) (USD Million)
4.2.4. Precision Soil Conditioner
4.2.4.1. Market estimates and forecasts, 2018 – 2033 (Kilotons) (USD Million)
4.2.5. Microbial & Biostimulant-Based Inputs
4.2.5.1. Market estimates and forecasts, 2018 – 2033 (Kilotons) (USD Million)
4.2.6. Other Products
4.2.6.1. Market estimates and forecasts, 2018 – 2033 (Kilotons) (USD Million)
Chapter 5. Global Precision Agriculture Chemicals Market: Application Estimates & Trend Analysis
5.1. Key Takeaways
5.2. Application Movement Analysis & Market Share, 2024 & 2033
5.2.1. Cereals & Grains
5.2.1.1. Market estimates and forecasts, 2018 – 2033 (Kilotons) (USD Million)
5.2.2. Oilseeds & Pulses
5.2.2.1. Market estimates and forecasts, 2018 – 2033 (Kilotons) (USD Million)
5.2.3. Fruits & Vegetables
5.2.3.1. Market estimates and forecasts, 2018 – 2033 (Kilotons) (USD Million)
5.2.4. Commercial Crops
5.2.4.1. Market estimates and forecasts, 2018 – 2033 (Kilotons) (USD Million)
5.2.5. Turf & Specialty Crop
5.2.5.1. Market estimates and forecasts, 2018 – 2033 (Kilotons) (USD Million)
Chapter 6. Global Precision Agriculture Chemicals Market: Regional Estimates & Trend Analysis
6.1. Key Takeaways
6.2. Regional Movement Analysis & Market Share, 2024 & 2033
6.3. North America
6.3.1. North America Precision Agriculture Chemicals Market Estimates & Forecasts, 2018 – 2033 (Kilotons) (USD Million)
6.3.2. Market estimates and forecasts, By Product, 2018 – 2033 (Kilotons) (USD Million)
6.3.3. Market estimates and forecasts, By Application, 2018 – 2033 (Kilotons) (USD Million)
6.3.4. U.S.
6.3.4.1. U.S. Precision Agriculture Chemicals Market Estimates & Forecasts, 2018 – 2033 (Kilotons) (USD Million)
6.3.4.2. Market estimates and forecasts, By Product, 2018 – 2033 (Kilotons) (USD Million)
6.3.4.3. Market estimates and forecasts, By Application, 2018 – 2033 (Kilotons) (USD Million)
6.3.5. Canada
6.3.5.1. Canada Precision Agriculture Chemicals Market Estimates & Forecasts, 2018 – 2033 (Kilotons) (USD Million)
6.3.5.2. Market estimates and forecasts, By Product, 2018 – 2033 (Kilotons) (USD Million)
6.3.5.3. Market estimates and forecasts, By Application, 2018 – 2033 (Kilotons) (USD Million)
6.3.6. Mexico
6.3.6.1. Mexico Precision Agriculture Chemicals Market Estimates & Forecasts, 2018 – 2033 (Kilotons) (USD Million)
6.3.6.2. Market estimates and forecasts, By Product, 2018 – 2033 (Kilotons) (USD Million)
6.3.6.3. Market estimates and forecasts, By Application, 2018 – 2033 (Kilotons) (USD Million)
6.4. Europe
6.4.1. Europe Precision Agriculture Chemicals Market Estimates & Forecasts, 2018 – 2033 (Kilotons) (USD Million)
6.4.2. Market estimates and forecasts, By Product, 2018 – 2033 (Kilotons) (USD Million)
6.4.3. Market estimates and forecasts, By Application, 2018 – 2033 (Kilotons) (USD Million)
6.4.4. Germany
6.4.4.1. Germany Precision Agriculture Chemicals Market Estimates & Forecasts, 2018 – 2033 (Kilotons) (USD Million)
6.4.4.2. Market estimates and forecasts, By Product, 2018 – 2033 (Kilotons) (USD Million)
6.4.4.3. Market estimates and forecasts, By Application, 2018 – 2033 (Kilotons) (USD Million)
6.4.5. UK
6.4.5.1. UK Precision Agriculture Chemicals Market Estimates & Forecasts, 2018 – 2033 (Kilotons) (USD Million)
6.4.5.2. Market estimates and forecasts, By Product, 2018 – 2033 (Kilotons) (USD Million)
6.4.5.3. Market estimates and forecasts, By Application, 2018 – 2033 (Kilotons) (USD Million)
6.4.6. France
6.4.6.1. France Precision Agriculture Chemicals Market Estimates & Forecasts, 2018 – 2033 (Kilotons) (USD Million)
6.4.6.2. Market estimates and forecasts, By Product, 2018 – 2033 (Kilotons) (USD Million)
6.4.6.3. Market estimates and forecasts, By Application, 2018 – 2033 (Kilotons) (USD Million)
6.4.7. Italy
6.4.7.1. Italy Precision Agriculture Chemicals Market Estimates & Forecasts, 2018 – 2033 (Kilotons) (USD Million)
6.4.7.2. Market estimates and forecasts, By Product, 2018 – 2033 (Kilotons) (USD Million)
6.4.7.3. Market estimates and forecasts, By Application, 2018 – 2033 (Kilotons) (USD Million)
6.4.8. Spain
6.4.8.1. Spain Precision Agriculture Chemicals Market Estimates & Forecasts, 2018 – 2033 (Kilotons) (USD Million)
6.4.8.2. Market estimates and forecasts, By Product, 2018 – 2033 (Kilotons) (USD Million)
6.4.8.3. Market estimates and forecasts, By Application, 2018 – 2033 (Kilotons) (USD Million)
6.5. Asia Pacific
6.5.1. Asia Pacific Precision Agriculture Chemicals Market Estimates & Forecasts, 2018 – 2033 (Kilotons) (USD Million)
6.5.2. Market estimates and forecasts, By Product, 2018 – 2033 (Kilotons) (USD Million)
6.5.3. Market estimates and forecasts, By Application, 2018 – 2033 (Kilotons) (USD Million)
6.5.4. China
6.5.4.1. China Precision Agriculture Chemicals Market Estimates & Forecasts, 2018 – 2033 (Kilotons) (USD Million)
6.5.4.2. Market estimates and forecasts, By Product, 2018 – 2033 (Kilotons) (USD Million)
6.5.4.3. Market estimates and forecasts, By Application, 2018 – 2033 (Kilotons) (USD Million)
6.5.5. India
6.5.5.1. India Precision Agriculture Chemicals Market Estimates & Forecasts, 2018 – 2033 (Kilotons) (USD Million)
6.5.5.2. Market estimates and forecasts, By Product, 2018 – 2033 (Kilotons) (USD Million)
6.5.5.3. Market estimates and forecasts, By Application, 2018 – 2033 (Kilotons) (USD Million)
6.5.6. Japan
6.5.6.1. Japan Precision Agriculture Chemicals Market Estimates & Forecasts, 2018 – 2033 (Kilotons) (USD Million)
6.5.6.2. Market estimates and forecasts, By Product, 2018 – 2033 (Kilotons) (USD Million)
6.5.6.3. Market estimates and forecasts, By Application, 2018 – 2033 (Kilotons) (USD Million)
6.5.7. South Korea
6.5.7.1. South Korea Precision Agriculture Chemicals Market Estimates & Forecasts, 2018 – 2033 (Kilotons) (USD Million)
6.5.7.2. Market estimates and forecasts, By Product, 2018 – 2033 (Kilotons) (USD Million)
6.5.7.3. Market estimates and forecasts, By Application, 2018 – 2033 (Kilotons) (USD Million)
6.6. Latin America
6.6.1. Latin America Precision Agriculture Chemicals Market Estimates & Forecasts, 2018 – 2033 (Kilotons) (USD Million)
6.6.2. Market estimates and forecasts, By Product, 2018 – 2033 (Kilotons) (USD Million)
6.6.3. Market estimates and forecasts, By Application, 2018 – 2033 (Kilotons) (USD Million)
6.6.4. Brazil
6.6.4.1. Brazil Precision Agriculture Chemicals Market Estimates & Forecasts, 2018 – 2033 (Kilotons) (USD Million)
6.6.4.2. Market estimates and forecasts, By Product, 2018 – 2033 (Kilotons) (USD Million)
6.6.4.3. Market estimates and forecasts, By Application, 2018 – 2033 (Kilotons) (USD Million)
6.6.5. Argentina
6.6.5.1. Argentina Precision Agriculture Chemicals Market Estimates & Forecasts, 2018 – 2033 (Kilotons) (USD Million)
6.6.5.2. Market estimates and forecasts, By Product, 2018 – 2033 (Kilotons) (USD Million)
6.6.5.3. Market estimates and forecasts, By Application, 2018 – 2033 (Kilotons) (USD Million)
6.7. Middle East & Africa
6.7.1. Middle East & Africa Precision Agriculture Chemicals Market Estimates & Forecasts, 2018 – 2033 (Kilotons) (USD Million)
6.7.2. Market estimates and forecasts, By Product, 2018 – 2033 (Kilotons) (USD Million)
6.7.3. Market estimates and forecasts, By Application, 2018 – 2033 (Kilotons) (USD Million)
6.7.4. Saudi Arabia
6.7.4.1. Saudi Arabia Precision Agriculture Chemicals Market Estimates & Forecasts, 2018 – 2033 (Kilotons) (USD Million)
6.7.4.2. Market estimates and forecasts, By Product, 2018 – 2033 (Kilotons) (USD Million)
6.7.4.3. Market estimates and forecasts, By Application, 2018 – 2033 (Kilotons) (USD Million)
6.7.5. South Africa
6.7.5.1. South Africa Precision Agriculture Chemicals Market Estimates & Forecasts, 2018 – 2033 (Kilotons) (USD Million)
6.7.5.2. Market estimates and forecasts, By Product, 2018 – 2033 (Kilotons) (USD Million)
6.7.5.3. Market estimates and forecasts, By Application, 2018 – 2033 (Kilotons) (USD Million)
Chapter 7. Competitive Landscape
7.1. Key Global Players & Recent Developments & Their Impact on the Industry
7.2. Company/Competition Categorization
7.3. Company Market Position Analysis, 2024
7.4. Company Heat Map Analysis
7.5. Strategy Mapping
7.5.1. Expansions
7.5.2. Mergers & Acquisitions
7.5.3. Collaborations/Partnerships/Agreements
7.5.4. New Product Launches
7.5.5. Others
Chapter 8. Company Listing (Overview, Financial Product Benchmarking, Products Overview)
8.1. BASF SE
8.1.1. Company Overview
8.1.2. Financial Performance
8.1.3. Product Benchmarking
8.2. Dow
8.2.1. Company Overview
8.2.2. Financial Performance
8.2.3. Product Benchmarking
8.3. DuPont
8.3.1. Company Overview
8.3.2. Financial Performance
8.3.3. Product Benchmarking
8.4. SABIC
8.4.1. Company Overview
8.4.2. Financial Performance
8.4.3. Product Benchmarking
8.5. Evonik Industries AG
8.5.1. Company Overview
8.5.2. Financial Performance
8.5.3. Product Benchmarking
8.6. Huntsman Corporation
8.6.1. Company Overview
8.6.2. Financial Performance
8.6.3. Product Benchmarking
8.7. Covestro AG
8.7.1. Company Overview
8.7.2. Financial Performance
8.7.3. Product Benchmarking
8.8. Wacker Chemie AG
8.8.1. Company Overview
8.8.2. Financial Performance
8.8.3. Product Benchmarking
8.9. Eastman Chemical Company
8.9.1. Company Overview
8.9.2. Financial Performance
8.9.3. Product Benchmarking
8.10. Syngenta AG
8.10.1. Company Overview
8.10.2. Financial Performance
8.10.3. Product Benchmarking
8.11. Mitsubishi Chemical Corporation
8.11.1. Company Overview
8.11.2. Financial Performance
8.11.3. Product Benchmarking
8.12. LANXESS AG
8.12.1. Company Overview
8.12.2. Financial Performance
8.12.3. Product Benchmarking
8.13. Solvay S.A.
8.13.1. Company Overview
8.13.2. Financial Performance
8.13.3. Product Benchmarking
8.14. Albemarle Corporation
8.14.1. Company Overview
8.14.2. Financial Performance
8.14.3. Product Benchmarking
8.15. AkzoNobel N.V.
8.15.1. Company Overview
8.15.2. Financial Performance
8.15.3. Product Benchmarking
List of Tables
Table 1 Precision Agriculture Chemicals market estimates and forecasts, by product, 2018 – 2033 (Kilotons) (USD Million)
Table 2 Precision fertilizers precision agriculture chemicals market estimates and forecasts, 2018 – 2033 (Kilotons) (USD Million)
Table 3 Precision crop protection chemicals precision agriculture chemicals market estimates and forecasts, 2018 – 2033 (Kilotons) (USD Million)
Table 4 Precision plant growth regulators precision agriculture chemicals market estimates and forecasts, 2018 – 2033 (Kilotons) (USD Million)
Table 5 Precision soil conditioner chemicals precision agriculture chemicals market estimates and forecasts, 2018 – 2033 (Kilotons) (USD Million)
Table 6 Microbial & biostimulant-based inputs precision agriculture chemicals market estimates and forecasts, 2018 – 2033 (Kilotons) (USD Million)
Table 7 Other products precision agriculture chemicals market estimates and forecasts, 2018 – 2033 (Kilotons) (USD Million)
Table 8 Precision Agriculture Chemicals market estimates and forecasts, by application, 2018 – 2033 (Kilotons) (USD Million)
Table 9 Precision agriculture chemicals market estimates and forecasts, in cereals & grains, 2018 – 2033 (Kilotons) (USD Million)
Table 10 Precision agriculture chemicals market estimates and forecasts, in oilseeds & pulses, 2018 – 2033 (Kilotons) (USD Million)
Table 11 Precision agriculture chemicals market estimates and forecasts, in fruits & vegetables, 2018 – 2033 (Kilotons) (USD Million)
Table 12 Precision agriculture chemicals market estimates and forecasts, in commercial crops, 2018 – 2033 (Kilotons) (USD Million)
Table 13 Precision agriculture chemicals market estimates and forecasts, in turf & specialty crop, 2018 – 2033 (Kilotons) (USD Million)
Table 14 Precision Agriculture Chemicals market estimates and forecasts, by region, 2018 – 2033 (Kilotons) (USD Million)
Table 15 North America Precision Agriculture Chemicals market estimates and forecasts, 2018 – 2033 (Kilotons) (USD Million)
Table 16 North America Precision Agriculture Chemicals market estimates and forecasts, by Product, 2018 – 2033 (Kilotons) (USD Million)
Table 17 North America Precision Agriculture Chemicals market estimates and forecasts, by Application, 2018 – 2033 (Kilotons) (USD Million)
Table 18 U.S. Precision Agriculture Chemicals market estimates and forecasts, 2018 – 2033 (Kilotons) (USD Million)
Table 19 U.S. Precision Agriculture Chemicals market estimates and forecasts, by Product, 2018 – 2033 (Kilotons) (USD Million)
Table 20 U.S. Precision Agriculture Chemicals market estimates and forecasts, by Application, 2018 – 2033 (USD Million) (Kilotons)
Table 21 Canada Precision Agriculture Chemicals market estimates and forecasts, 2018 – 2033 (Kilotons) (USD Million)
Table 22 Canada Precision Agriculture Chemicals market estimates and forecasts, by Product, 2018 – 2033 (Kilotons) (USD Million)
Table 23 Canada Precision Agriculture Chemicals market estimates and forecasts, by Application, 2018 – 2033 (Kilotons) (USD Million)
Table 24 Mexico Precision Agriculture Chemicals market estimates and forecasts, 2018 – 2033 (Kilotons) (USD Million)
Table 25 Mexico Precision Agriculture Chemicals market estimates and forecasts, by Product, 2018 – 2033 (Kilotons) (USD Million)
Table 26 Mexico Precision Agriculture Chemicals market estimates and forecasts, by Application, 2018 – 2033 (Kilotons) (USD Million)
Table 27 Europe Precision Agriculture Chemicals market estimates and forecasts, 2018 – 2033 (Kilotons) (USD Million)
Table 28 Europe Precision Agriculture Chemicals market estimates and forecasts, by Product, 2018 – 2033 (Kilotons) (USD Million)
Table 29 Europe Precision Agriculture Chemicals market estimates and forecasts, by Application, 2018 – 2033 (Kilotons) (USD Million)
Table 30 Germany Precision Agriculture Chemicals market estimates and forecasts, 2018 – 2033 (Kilotons) (USD Million)
Table 31 Germany Precision Agriculture Chemicals market estimates and forecasts, by Product, 2018 – 2033 (Kilotons) (USD Million)
Table 32 Germany Precision Agriculture Chemicals market estimates and forecasts, by Application, 2018 – 2033 (Kilotons) (USD Million)
Table 33 UK Precision Agriculture Chemicals market estimates and forecasts, 2018 – 2033 (Kilotons) (USD Million)
Table 34 UK Precision Agriculture Chemicals market estimates and forecasts, by Product, 2018 – 2033 (Kilotons) (USD Million)
Table 35 UK Precision Agriculture Chemicals market estimates and forecasts, by Application, 2018 – 2033 (Kilotons) (USD Million)
Table 36 France Precision Agriculture Chemicals market estimates and forecasts, 2018 – 2033 (Kilotons) (USD Million)
Table 37 France Precision Agriculture Chemicals market estimates and forecasts, by Product, 2018 – 2033 (Kilotons) (USD Million)
Table 38 France Precision Agriculture Chemicals market estimates and forecasts, by Application, 2018 – 2033 (Kilotons) (USD Million)
Table 39 Italy Precision Agriculture Chemicals market estimates and forecasts, 2018 – 2033 (Kilotons) (USD Million)
Table 40 Italy Precision Agriculture Chemicals market estimates and forecasts, by Product, 2018 – 2033 (Kilotons) (USD Million)
Table 41 Italy Precision Agriculture Chemicals market estimates and forecasts, by Application, 2018 – 2033 (Kilotons) (USD Million)
Table 42 Spain Precision Agriculture Chemicals market estimates and forecasts, 2018 – 2033 (Kilotons) (USD Million)
Table 43 Spain Precision Agriculture Chemicals market estimates and forecasts, by Product, 2018 – 2033 (Kilotons) (USD Million)
Table 44 Spain Precision Agriculture Chemicals market estimates and forecasts, by Application, 2018 – 2033 (Kilotons) (USD Million)
Table 45 Asia Pacific Precision Agriculture Chemicals market estimates and forecasts, 2018 – 2033 (Kilotons) (USD Million)
Table 46 Asia Pacific Precision Agriculture Chemicals market estimates and forecasts, by Product, 2018 – 2033 (Kilotons) (USD Million)
Table 47 Asia Pacific Precision Agriculture Chemicals market estimates and forecasts, by Application, 2018 – 2033 (Kilotons) (USD Million)
Table 48 China Precision Agriculture Chemicals market estimates and forecasts, 2018 – 2033 (Kilotons) (USD Million)
Table 49 China Precision Agriculture Chemicals market estimates and forecasts, by Product, 2018 – 2033 (Kilotons) (USD Million)
Table 50 China Precision Agriculture Chemicals market estimates and forecasts, by Application, 2018 – 2033 (Kilotons) (USD Million)
Table 51 Japan Precision Agriculture Chemicals market estimates and forecasts, 2018 – 2033 (Kilotons) (USD Million)
Table 52 Japan Precision Agriculture Chemicals market estimates and forecasts, by Product, 2018 – 2033 (Kilotons) (USD Million)
Table 53 Japan Precision Agriculture Chemicals market estimates and forecasts, by Application, 2018 – 2033 (Kilotons) (USD Million)
Table 54 India Precision Agriculture Chemicals market estimates and forecasts, 2018 – 2033 (Kilotons) (USD Million)
Table 55 India Precision Agriculture Chemicals market estimates and forecasts, by Product, 2018 – 2033 (Kilotons) (USD Million)
Table 56 India Precision Agriculture Chemicals market estimates and forecasts, by Application, 2018 – 2033 (Kilotons) (USD Million)
Table 57 South Korea Precision Agriculture Chemicals market estimates and forecasts, 2018 – 2033 (Kilotons) (USD Million)
Table 58 South Korea Precision Agriculture Chemicals market estimates and forecasts, by Product, 2018 – 2033 (Kilotons) (USD Million)
Table 59 South Korea Precision Agriculture Chemicals market estimates and forecasts, by Application, 2018 – 2033 (Kilotons) (USD Million)
Table 60 Latin America Precision Agriculture Chemicals market estimates and forecasts, 2018 – 2033 (Kilotons) (USD Million)
Table 61 Latin America Precision Agriculture Chemicals market estimates and forecasts, by Product, 2018 – 2033 (Kilotons) (USD Million)
Table 62 Latin America Precision Agriculture Chemicals market estimates and forecasts, by Application, 2018 – 2033 (Kilotons) (USD Million)
Table 63 Brazil Precision Agriculture Chemicals market estimates and forecasts, 2018 – 2033 (Kilotons) (USD Million)
Table 64 Brazil Precision Agriculture Chemicals market estimates and forecasts, by Product, 2018 – 2033 (Kilotons) (USD Million)
Table 65 Brazil Precision Agriculture Chemicals market estimates and forecasts, by Application, 2018 – 2033 (Kilotons) (USD Million)
Table 66 Argentina Precision Agriculture Chemicals market estimates and forecasts, 2018 – 2033 (Kilotons) (USD Million)
Table 67 Argentina Precision Agriculture Chemicals market estimates and forecasts, by Product, 2018 – 2033 (Kilotons) (USD Million)
Table 68 Argentina Precision Agriculture Chemicals market estimates and forecasts, by Application, 2018 – 2033 (Kilotons) (USD Million)
Table 69 Middle East & Africa Precision Agriculture Chemicals market estimates and forecasts, 2018 – 2033 (Kilotons) (USD Million)
Table 70 Middle East & Africa Precision Agriculture Chemicals market estimates and forecasts, by Product, 2018 – 2033 (Kilotons) (USD Million)
Table 71 Middle East & Africa Precision Agriculture Chemicals market estimates and forecasts, by Application, 2018 – 2033 (Kilotons) (USD Million)
Table 72 Saudi Arabia Precision Agriculture Chemicals market estimates and forecasts, 2018 – 2033 (Kilotons) (USD Million)
Table 73 Saudi Arabia Precision Agriculture Chemicals market estimates and forecasts, by Product, 2018 – 2033 (Kilotons) (USD Million)
Table 74 Saudi Arabia Precision Agriculture Chemicals market estimates and forecasts, by Application, 2018 – 2033 (Kilotons) (USD Million)
Table 75 South Africa Precision Agriculture Chemicals market estimates and forecasts, 2018 – 2033 (Kilotons) (USD Million)
Table 76 South Africa Precision Agriculture Chemicals market estimates and forecasts, by Product, 2018 – 2033 (Kilotons) (USD Million)
Table 77 South Africa Precision Agriculture Chemicals market estimates and forecasts, by Application, 2018 – 2033 (Kilotons) (USD Million)
List of Figures
Fig. 1 Information Procurement
Fig. 2 Primary Research Pattern
Fig. 3 Primary Research Process
Fig. 4 Market Research Approaches – Bottom-Up Approach
Fig. 5 Market Research Approaches – Top-Down Approach
Fig. 6 Market Research Approaches – Combined Approach
Fig. 7 Precision Agriculture Chemicals Market- Market Snapshot
Fig. 8 Precision Agriculture Chemicals Market- Segment Snapshot (1/2)
Fig. 9 Precision Agriculture Chemicals Market- Segment Snapshot (2/2)
Fig. 10 Precision Agriculture Chemicals Market- Competitive Landscape Snapshot
Fig. 11 Precision Agriculture Chemicals Market: Value Chain Analysis
Fig. 12 Precision Agriculture Chemicals Market: Porter’s Five Force Analysis
Fig. 13 Precision Agriculture Chemicals Market: PESTEL Analysis
Fig. 14 Precision Agriculture Chemicals Market: Product Movement Analysis, 2024 & 2033
Fig. 15 Precision Agriculture Chemicals Market: Application Movement Analysis, 2024 & 2033
Fig. 16 Precision Agriculture Chemicals Market: Regional Movement Analysis, 2024 & 2033
Fig. 17 Precision Agriculture Chemicals Market: Company Positioning Analysis
Fig. 18 Precision Agriculture Chemicals Market: Strategy Mapping