有機ランキンサイクル(ORC)市場 - 用途(廃熱回収、バイオマス、地熱、太陽熱、石油・ガス、廃棄物エネルギー)、地域別(北米、ヨーロッパ、アジア太平洋、ラテンアメリカ、中東・アフリカ)、およびセグメント別予測による市場規模、成長と動向分析レポート 2026-2033年
Organic Rankine Cycle Market Size, Share & Trends Analysis Report By Application (Waste Heat Recovery, Biomass, Geothermal, Solar Thermal, Oil & Gas, Waste To Energy), By Region (North America, Europe, APAC, Latin America, MEA), And Segment Forecasts, 2026 - 2033
| 出版 | Grand View Research |
| 出版年月 | 2025年12月 |
| ページ数 | 120 |
| 価格 | 記載以外のライセンスについてはお問合せください |
| シングルユーザ | USD 5,950 |
| 種別 | 英文調査報告書 |
| 商品番号 | SMR-14566 |

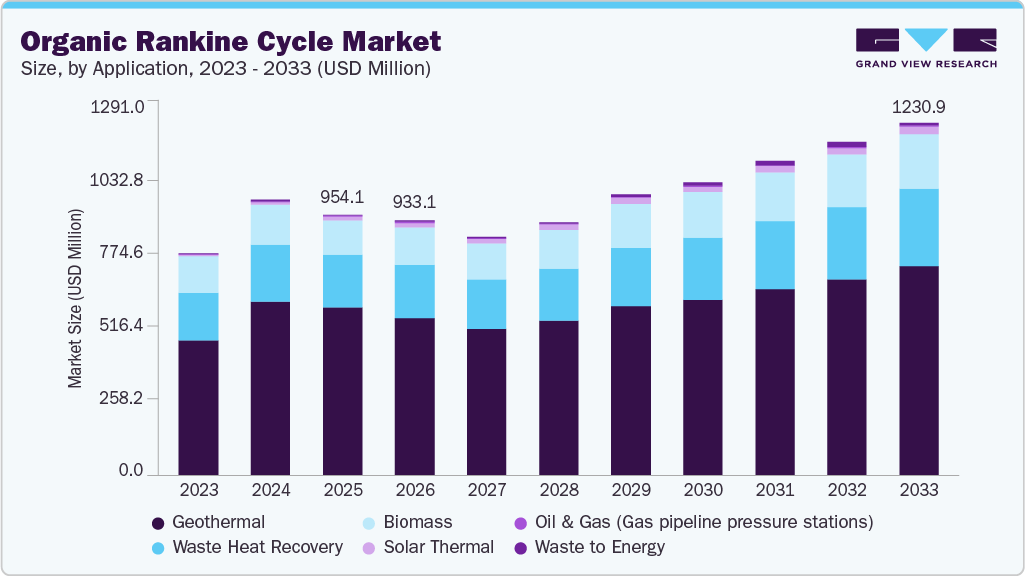
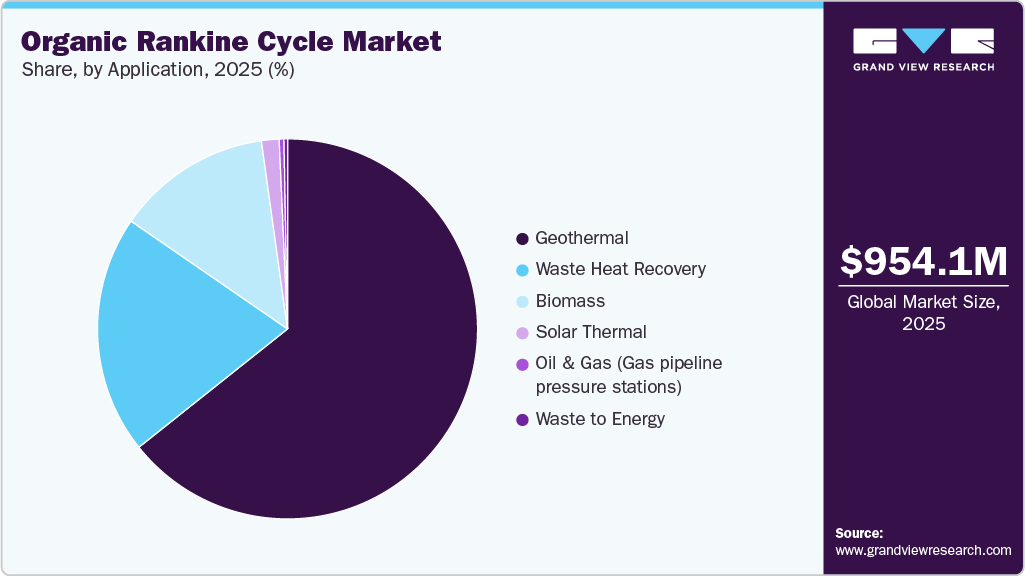
世界の有機ランキンサイクル(ORC)市場規模は、2025年に9億5,410万米ドルと評価され、2026年から2033年にかけて4.7%のCAGRで成長し、2033年には12億9,090万米ドルに達すると予測されています。ORCシステムは、有機作動流体を使用して低温から中温の熱源を電気に変換することで動作し、廃熱、バイオマス、地熱、および産業プロセスからの効率的な発電を可能にします。
タービン設計、熱交換器、作動流体の継続的な技術進歩と、廃熱回収ソリューションの採用増加は、市場拡大を促進する主な要因です。エネルギー効率、脱炭素化イニシアチブ、産業持続可能性プログラムに対する政府の支援の増加も、世界の有機ランキンサイクル市場全体の需要を強化しています。世界の有機ランキンサイクル市場は、特に未使用の熱エネルギーの回収を求める業界において、効率的で柔軟性が高く、低排出の発電技術に対する需要の高まりを背景に発展しています。産業事業者と公益企業は、エネルギー効率の向上、運用コストの削減、環境規制への適合を目的として、ORCシステムへの投資を増やしています。多様な熱源と温度範囲で動作可能なモジュール式でスケーラブルなORC技術の採用増加は、持続可能な発電を支える上で重要な役割を果たしています。システム効率、デジタル監視、再生可能エネルギーシステムと産業用エネルギーシステムとの統合の継続的な改善は、世界的に市場の勢いをさらに強化しています。
世界の有機ランキンサイクル(ORC)市場は、特に、本来は廃棄されるはずの低温から中温の熱源を活用したいと考えている産業や地域において、効率的で柔軟性が高く、排出量の少ない発電ソリューションに対する需要の高まりを背景に、成長を続けています。産業事業者や公共事業体は、廃熱回収、バイオマス、地熱、産業プロセスなどの用途において、エネルギー効率の向上、燃料消費量の削減、炭素排出量の削減を目的として、ORCシステムの導入をますます進めています。ORCシステムは、変動する熱入力に対して確実に動作し、非水系の作動流体を使用し、安定した出力を提供する能力を備えているため、分散型かつ継続的な発電に最適です。タービン効率、熱交換器設計、作動流体の最適化における継続的な進歩により、産業、商業、再生可能エネルギーの用途全体でこれらの技術の導入がさらに加速しています。
Organic Rankine Cycle Market Summary
The global organic rankine cycle market size was valued at USD 954.1 million in 2025 and is projected to reach USD 1,290.9 million by 2033, growing at a CAGR of 4.7% from 2026 to 2033. An ORC system operates by converting low- to medium-temperature heat sources into electricity using organic working fluids, enabling efficient power generation from waste heat, biomass, geothermal, and industrial processes.
Continuous technological advancements in turbine design, heat exchangers, and working fluids, along with the rising adoption of waste heat recovery solutions, are key factors fostering market expansion. Increasing government support for energy efficiency, decarbonization initiatives, and industrial sustainability programs is also strengthening demand across the global Organic Rankine Cycle market. The global Organic Rankine Cycle market is advancing on the back of rising demand for efficient, flexible, and low-emission power generation technologies, particularly in industries seeking to recover unused thermal energy. Industrial operators and utilities are increasingly investing in ORC systems to improve energy efficiency, reduce operating costs, and meet environmental regulations. The growing adoption of modular and scalable ORC technologies, capable of operating across diverse heat sources and temperature ranges, plays a critical role in supporting sustainable power generation. Ongoing improvements in system efficiency, digital monitoring, and integration with renewable and industrial energy systems further reinforce market momentum globally.
Drivers, Opportunities & Restraints
The global Organic Rankine Cycle (ORC) market continues to advance on the back of rising demand for efficient, flexible, and low-emission power generation solutions, particularly in industries and regions seeking to utilize low- to medium-temperature heat sources that would otherwise be wasted. Industrial operators and utilities are increasingly adopting ORC systems to improve energy efficiency, reduce fuel consumption, and lower carbon emissions across applications such as waste heat recovery, biomass, geothermal, and industrial processes. The ability of ORC systems to operate reliably across variable heat inputs, use non-water working fluids, and deliver stable power output makes them well-suited for decentralized and continuous power generation. Ongoing advancements in turbine efficiency, heat exchanger design, and working fluid optimization are further accelerating the adoption of these technologies across industrial, commercial, and renewable energy applications.
organic-rankine-cycle-market-share
Emerging opportunities stem from the expansion of industrial decarbonization initiatives, stricter energy-efficiency regulations, and growing investments in circular energy systems that prioritize heat recovery and resource optimization. The increasing deployment of modular and scalable ORC units enables cost-effective integration into small- and medium-scale facilities, remote locations, and distributed energy systems. Technological advancements in digital monitoring, predictive maintenance, and system automation are also enhancing operational reliability while reducing lifecycle costs. However, the market continues to face restraints, such as high initial capital investment, long payback periods in regions with low energy prices, and limited awareness among industrial users of the benefits of ORC performance. Additional challenges include site-specific feasibility constraints, variability in heat source availability, and technical complexities associated with integrating the system into existing industrial infrastructure.
Organic Rankine Cycle Market Report Scope
| Report Attribute | Details |
| Market Definition | The Organic Rankine Cycle (ORC) market represents the global revenue generated from systems that convert low- to medium-temperature heat into electricity using organic working fluids. It includes ORC turbines, heat exchangers, generators, control systems, and related components used across geothermal, waste heat recovery, biomass, and waste-to-energy applications. |
| Market size value in 2026 | USD 933.1 million |
| Revenue forecast in 2033 | USD 1,290.9 million |
| Growth rate | CAGR of 4.7% from 2026 to 2033 |
| Base year for estimation | 2025 |
| Historical data | 2021 – 2024 |
| Forecast period | 2026 – 2033 |
| Quantitative Units | Revenue in USD million/billion, capacity in MW, and CAGR from 2026 to 2033 |
| Report coverage | Revenue forecast, competitive landscape, growth factors, and trends |
| Segments covered | Application, region |
| Regional scope | North America; Europe; Asia Pacific; Latin America; Middle East & Africa |
| Country scope | U.S.; Canada; Germany; Turkey; Italy; China; Thailand; Japan |
| Key companies profiled | Turboden S.p.A.; Exergy International Srl; Ormat Technologies, Inc.; Zhejiang Kaishan Compressor Co., Ltd.; Enogia SAS; Calnetix Technologies, LLC; Triogen; Mitsubishi Heavy Industries, Ltd.; GE Vernova; MAN Energy Solutions |
| Customization scope | Free report customization (equivalent up to 8 analysts working days) with purchase. Addition or alteration to country, regional & segment scope. |
Global Organic Rankine Cycle Market Report Segmentation
This report forecasts revenue growth at global, regional, and country levels and provides an analysis of the latest industry trends in each of the sub-segments from 2021 to 2033. For the purpose of this study, Grand View Research has segmented the global organic rankine cycle market report on the basis of application and region:
- Application Outlook (Revenue, USD Million; Capacity, MW; 2021 – 2033)
- Waste Heat Recovery
o Petroleum refinery
o Chemical
o Glass
o Cement
o Metal Production and Casting (Iron & Steel)
- Biomass
- Geothermal
- Solar Thermal
- Oil & Gas (Gas pipeline pressure stations)
- Waste to Energy
- Regional Outlook (Revenue, USD Million; Capacity, MW; 2021 – 2033)
- North America
o U.S.
o Canada
- Europe
o Germany
o Turkey
o Italy
- Asia Pacific
o China
o Thailand
o Japan
- Latin America
- Middle East & Africa
Table of Contents
Chapter 1. Methodology and Scope
1.1. Market Segmentation & Scope
1.2. Market Definition
1.3. Information Procurement
1.3.1. Information Analysis
1.3.2. Market Formulation & Data Visualization
1.3.3. Data Validation & Publishing
1.4. Research Scope and Assumptions
1.4.1. List of Data Sources
Chapter 2. Executive Summary
2.1. Market Snapshot
2.2. Segmental Outlook
2.3. Competitive Outlook
Chapter 3. Market Variables, Trends, and Scope
3.1. Market Lineage Outlook
3.2. Penetration & Growth Prospect Mapping
3.3. Value Chain Analysis
3.4. Regulatory Framework
3.4.1. Standards & Compliance
3.4.2. Regulatory Impact Analysis
3.5. Market Dynamics
3.5.1. Market Driver Analysis
3.5.2. Market Restraint Analysis
3.5.3. Market Opportunities
3.5.4. Market Challenges
3.6. Porter’s Five Forces Analysis
3.6.1. Bargaining Power of Suppliers
3.6.2. Bargaining Power of Buyers
3.6.3. Threat of Substitution
3.6.4. Threat of New Entrants
3.6.5. Competitive Rivalry
3.7. PESTLE Analysis
3.7.1. Political
3.7.2. Economic
3.7.3. Social Landscape
3.7.4. Technology
3.7.5. Environmental
3.7.6. Legal
Chapter 4. Organic Rankine Cycle Market: Application Estimates & Trend Analysis
4.1. Organic Rankine Cycle Market: Application Movement Analysis, 2025 & 2033
4.2. Waste Heat Recovery
4.2.1. Market estimates and forecasts, 2021 – 2033 (USD Million, MW)
4.2.1.1. Petroleum refinery
4.2.1.1.1. Market estimates and forecasts, 2021 – 2033 (USD Million, MW)
4.2.1.2. Chemical
4.2.1.2.1. Market estimates and forecasts, 2021 – 2033 (USD Million, MW)
4.2.1.3. Glass
4.2.1.3.1. Market estimates and forecasts, 2021 – 2033 (USD Million, MW)
4.2.1.4. Cement
4.2.1.4.1. Market estimates and forecasts, 2021 – 2033 (USD Million, MW)
4.2.1.5. Metal Production and Casting (Iron & Steel)
4.2.1.5.1. Market estimates and forecasts, 2021 – 2033 (USD Million, MW)
4.3. Biomass
4.3.1. Market estimates and forecasts, 2021 – 2033 (USD Million, MW)
4.4. Geothermal
4.4.1. Market estimates and forecasts, 2021 – 2033 (USD Million, MW)
4.5. Solar Thermal
4.5.1. Market estimates and forecasts, 2021 – 2033 (USD Million, MW)
4.6. Oil & Gas (Gas pipeline pressure stations)
4.6.1. Market estimates and forecasts, 2021 – 2033 (USD Million, MW)
4.7. Waste to Energy
4.7.1. Market estimates and forecasts, 2021 – 2033 (USD Million, MW)
Chapter 5. Organic Rankine Cycle Market: Regional Estimates & Trend Analysis
5.1. Regional Analysis, 2025 & 2033
5.2. North America
5.2.1. Market estimates and forecasts, 2021 – 2033 (USD Million, MW)
5.2.2. Market estimates and forecasts, by application, 2021 – 2033 (USD Million, MW)
5.2.3. U.S.
5.2.3.1. Market estimates and forecasts, 2021 – 2033 (USD Million, MW)
5.2.3.2. Market estimates and forecasts, by application, 2021 – 2033 (USD Million, MW)
5.2.4. Canada
5.2.4.1. Market estimates and forecasts, 2021 – 2033 (USD Million, MW)
5.2.4.2. Market estimates and forecasts, by application, 2021 – 2033 (USD Million, MW)
5.2.5. Mexico
5.2.5.1. Market estimates and forecasts, 2021 – 2033 (USD Million, MW)
5.2.5.2. Market estimates and forecasts, by application, 2021 – 2033 (USD Million, MW)
5.3. Europe
5.3.1. Market estimates and forecasts, 2021 – 2033 (USD Million, MW)
5.3.2. Market estimates and forecasts, by application, 2021 – 2033 (USD Million, MW)
5.3.3. Germany
5.3.3.1. Market estimates and forecasts, 2021 – 2033 (USD Million, MW)
5.3.3.2. Market estimates and forecasts, by application, 2021 – 2033 (USD Million, MW)
5.3.4. UK
5.3.4.1. Market estimates and forecasts, 2021 – 2033 (USD Million, MW)
5.3.4.2. Market estimates and forecasts, by application, 2021 – 2033 (USD Million, MW)
5.3.5. France
5.3.5.1. Market estimates and forecasts, 2021 – 2033 (USD Million, MW)
5.3.5.2. Market estimates and forecasts, by application, 2021 – 2033 (USD Million, MW)
5.4. Asia Pacific
5.4.1. Market estimates and forecasts, 2021 – 2033 (USD Million, MW)
5.4.2. Market estimates and forecasts, by application, 2021 – 2033 (USD Million, MW)
5.4.3. China
5.4.3.1. Market estimates and forecasts, 2021 – 2033 (USD Million, MW)
5.4.3.2. Market estimates and forecasts, by application, 2021 – 2033 (USD Million, MW)
5.4.4. India
5.4.4.1. Market estimates and forecasts, 2021 – 2033 (USD Million, MW)
5.4.4.2. Market estimates and forecasts, by application, 2021 – 2033 (USD Million, MW)
5.4.5. Japan
5.4.5.1. Market estimates and forecasts, 2021 – 2033 (USD Million, MW)
5.4.5.2. Market estimates and forecasts, by application, 2021 – 2033 (USD Million, MW)
5.4.6. South Korea
5.4.6.1. Market estimates and forecasts, 2021 – 2033 (USD Million, MW)
5.4.6.2. Market estimates and forecasts, by application, 2021 – 2033 (USD Million, MW)
5.5. Latin America
5.5.1. Market estimates and forecasts, 2021 – 2033 (USD Million, MW)
5.5.2. Market estimates and forecasts, by application, 2021 – 2033 (USD Million, MW)
5.5.3. Brazil
5.5.3.1. Market estimates and forecasts, 2021 – 2033 (USD Million, MW)
5.5.3.2. Market estimates and forecasts, by application, 2021 – 2033 (USD Million, MW)
5.6. Middle East & Africa
5.6.1. Market estimates and forecasts, 2021 – 2033 (USD Million, MW)
5.6.2. Market estimates and forecasts, by application, 2021 – 2033 (USD Million, MW)
5.6.3. Saudi Arabia
5.6.3.1. Market estimates and forecasts, 2021 – 2033 (USD Million, MW)
5.6.3.2. Market estimates and forecasts, by application, 2021 – 2033 (USD Million, MW)
5.6.4. UAE
5.6.4.1. Market estimates and forecasts, 2021 – 2033 (USD Million, MW)
5.6.4.2. Market estimates and forecasts, by application, 2021 – 2033 (USD Million, MW)
Chapter 6. Competitive Landscape
6.1. Recent Developments By Key Market Participants
6.2. Company Categorization
6.3. List of Key Component Suppliers & Channel Partners
6.4. Company Market Share & Positioning Analysis, 2025
6.5. Heat Map Analysis
6.6. Vendor Landscape
6.6.1. List of Raw Material Suppliers
6.6.2. List of Distributors/Traders
6.6.3. List of Other Prominent Manufacturers
6.7. List of Prospective End Users
6.8. Strategy Mapping
6.9. Company Profiles/Listing
6.9.1. Turboden S.p.A.
6.9.1.1. Company Overview
6.9.1.2. Financial Performance
6.9.1.3. Product Benchmarking
6.9.2. Exergy International Srl
6.9.2.1. Company Overview
6.9.2.2. Financial Performance
6.9.2.3. Product Benchmarking
6.9.3. Ormat Technologies, Inc.
6.9.3.1. Company Overview
6.9.3.2. Financial Performance
6.9.3.3. Product Benchmarking
6.9.4. Zhejiang Kaishan Compressor Co., Ltd.
6.9.4.1. Company Overview
6.9.4.2. Financial Performance
6.9.4.3. Product Benchmarking
6.9.5. Enogia SAS
6.9.5.1. Company Overview
6.9.5.2. Financial Performance
6.9.5.3. Product Benchmarking
6.9.6. Calnetix Technologies, LLC
6.9.6.1. Company Overview
6.9.6.2. Financial Performance
6.9.6.3. Product Benchmarking
6.9.7. Triogen
6.9.7.1. Company Overview
6.9.7.2. Financial Performance
6.9.7.3. Product Benchmarking
6.9.8. Mitsubishi Heavy Industries, Ltd.
6.9.8.1. Company Overview
6.9.8.2. Financial Performance
6.9.8.3. Product Benchmarking
6.9.9. GE Vernova
6.9.9.1. Company Overview
6.9.9.2. Financial Performance
6.9.9.3. Product Benchmarking
6.9.10. MAN Energy Solutions
6.9.10.1. Company Overview
6.9.10.2. Financial Performance
6.9.10.3. Product Benchmarking
List of Tables
Table 1 Organic Rankine Cycle market estimates & forecasts, 2021 – 2033 (USD Million, MW)
Table 2 Organic Rankine Cycle market estimates & forecasts, in Waste Heat Recovery, 2021 – 2033 (USD Million, MW)
Table 3 Organic Rankine Cycle market estimates & forecasts, in Petroleum refinery, 2021 – 2033 (USD Million, MW)
Table 4 Organic Rankine Cycle market estimates & forecasts, in Chemical, 2021 – 2033 (USD Million, MW)
Table 5 Organic Rankine Cycle market estimates & forecasts, in Glass, 2021 – 2033 (USD Million, MW)
Table 6 Organic Rankine Cycle market estimates & forecasts, in Cement, 2021 – 2033 (USD Million, MW)
Table 7 Organic Rankine Cycle market estimates & forecasts, in Metal Production and Casting (Iron & Steel), 2021 – 2033 (USD Million, MW)
Table 8 Organic Rankine Cycle market estimates & forecasts, in Biomass, 2021 – 2033 (USD Million, MW)
Table 9 Organic Rankine Cycle market estimates & forecasts, in Geothermal, 2021 – 2033 (USD Million, MW)
Table 10 Organic Rankine Cycle market estimates & forecasts, in Solar Thermal, 2021 – 2033 (USD Million, MW)
Table 11 Organic Rankine Cycle market estimates & forecasts, in Oil & Gas (Gas pipeline pressure stations), 2021 – 2033 (USD Million, MW)
Table 12 Organic Rankine Cycle market estimates & forecasts, in Waste to Energy, 2021 – 2033 (USD Million, MW)
Table 13 North America Organic Rankine Cycle market estimates & forecast, 2021 – 2033 (USD Million, MW)
Table 14 North America Organic Rankine Cycle market estimates & forecasts by application, 2021 – 2033 (USD Million, MW)
Table 15 U.S. Organic Rankine Cycle market estimates & forecasts, 2021 – 2033 (USD Million, MW)
Table 16 U.S. Organic Rankine Cycle market estimates & forecasts by application, 2021 – 2033 (USD Million, MW)
Table 17 Canada Organic Rankine Cycle market estimates & forecasts, 2021 – 2033 (USD Million, MW)
Table 18 Canada Organic Rankine Cycle market estimates & forecasts by application, 2021 – 2033 (USD Million, MW)
Table 19 Europe Organic Rankine Cycle market estimates & forecasts, 2021 – 2033 (USD Million, MW)
Table 20 Europe Organic Rankine Cycle market estimates & forecasts by application, 2021 – 2033 (USD Million, MW)
Table 21 Germany Organic Rankine Cycle market estimates & forecasts, 2021 – 2033 (USD Million, MW)
Table 22 Germany Organic Rankine Cycle market estimates & forecasts by application, 2021 – 2033 (USD Million, MW)
Table 23 Turkey Organic Rankine Cycle market estimates & forecasts, 2021 – 2033 (USD Million, MW)
Table 24 Turkey Organic Rankine Cycle market estimates & forecasts by application, 2021 – 2033 (USD Million, MW)
Table 25 Italy Organic Rankine Cycle market estimates & forecast, 2021 – 2033 (USD Million, MW)
Table 26 Italy Organic Rankine Cycle market estimates & forecasts by application, 2021 – 2033 (USD Million, MW)
Table 27 Asia Pacific Organic Rankine Cycle market estimates & forecast, 2021 – 2033 (USD Million, MW)
Table 28 Asia Pacific Organic Rankine Cycle market estimates & forecasts by application, 2021 – 2033 (USD Million, MW)
Table 29 China Organic Rankine Cycle market estimates & forecast, 2021 – 2033 (USD Million, MW)
Table 30 China Organic Rankine Cycle market estimates & forecasts by application, 2021 – 2033 (USD Million, MW)
Table 31 Japan Organic Rankine Cycle market estimates & forecast, 2021 – 2033 (USD Million, MW)
Table 32 Japan Organic Rankine Cycle market estimates & forecasts by application, 2021 – 2033 (USD Million, MW)
Table 33 Thailand Organic Rankine Cycle market estimates & forecast, 2021 – 2033 (USD Million, MW)
Table 34 Thailand Organic Rankine Cycle market estimates & forecasts by application, 2021 – 2033 (USD Million, MW)
Table 35 Latin America Organic Rankine Cycle market estimates & forecasts, 2021 – 2033 (USD Million, MW)
Table 36 Latin America Organic Rankine Cycle market estimates & forecasts by application, 2021 – 2033 (USD Million, MW)
Table 37 Middle East & Africa Organic Rankine Cycle market estimates & forecast, 2021 – 2033 (USD Million, MW)
Table 38 Middle East & Africa Organic Rankine Cycle market estimates & forecasts by application, 2021 – 2033 (USD Million, MW)
Table 39 Saudi Arabia Organic Rankine Cycle market estimates & forecasts, 2021 – 2033 (USD Million, MW)
Table 40 Saudi Arabia Organic Rankine Cycle market estimates & forecasts by application, 2021 – 2033 (USD Million, MW)
List of Figures
Fig. 1 Market segmentation
Fig. 2 Information procurement
Fig. 3 Data analysis models
Fig. 4 Market formulation and validation
Fig. 5 Data validating & publishing
Fig. 6 Market snapshot
Fig. 7 Segmental outlook – Application
Fig. 8 Competitive Outlook
Fig. 9 Organic Rankine Cycle market outlook, 2021 – 2033 (USD Million, MW)
Fig. 10 Value chain analysis
Fig. 11 Market dynamics
Fig. 12 Porter’s Analysis
Fig. 13 PESTEL Analysis
Fig. 14 Organic Rankine Cycle market, by application: Key takeaways
Fig. 15 Organic Rankine Cycle market, by application: Market share, 2025 & 2033
Fig. 16 Organic Rankine Cycle market: Regional analysis, 2025 & 2033
Fig. 17 Organic Rankine Cycle market, by region: Key takeaways