Masterbatch Market Size, Share & Trends Analysis Report By Type (White, Black, Color, Additive, Filler, Biodegradable), By Carrier Polymer (Polypropylene, Polyethylene Terephthalate, Polyethylene, Polyvinyl Chloride, Biodegradable Plastics), By End-use, By Region, And Segment Forecasts, 2026 - 2033
マスターバッチ市場 - タイプ別(白色、黒色、着色、添加剤、充填剤、生分解性)、キャリアポリマー別(ポリプロピレン、ポリエチレンテレフタレート、ポリエチレン、ポリ塩化ビニル、生分解性プラスチック)、用途別、地域、セグメント別予測による市場規模、成長と動向分析レポート 2026-2033年
| 出版 | Grand View Research |
| 出版年月 | 2026年02月 |
| ページ数 | 135 |
| 価格 | 記載以外のライセンスについてはお問合せください |
| シングルユーザ | USD 5,950 |
| 種別 | 英文調査報告書 |
| 商品番号 | SMR-17034 |

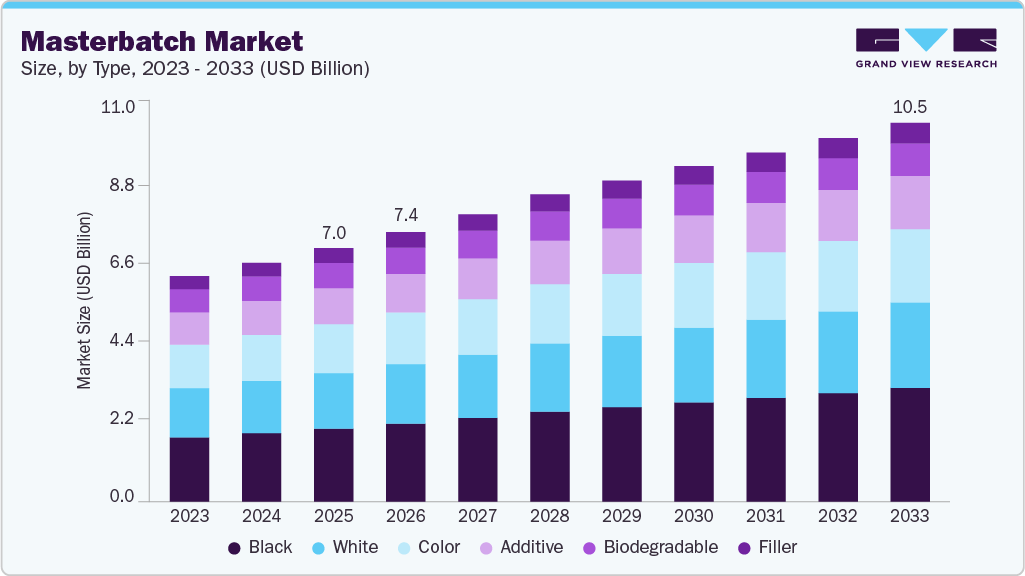
世界のマスターバッチ市場規模は、2025年には70億800万米ドルと推定され、2026年から2033年にかけて年平均成長率(CAGR)5.0%で成長し、2033年には104億7,620万米ドルに達すると予測されています。食品、飲料、パーソナルケア、家庭用品など、幅広い分野での軟質および硬質プラスチック包装の消費拡大が、着色、UV安定化、機能強化に使用されるマスターバッチの需要を牽引しています。
主要市場動向と洞察
- アジア太平洋地域は、2025年に30.7%という最大の収益シェアを獲得し、マスターバッチ市場を牽引しました。
- 中国のマスターバッチ業界は、2026年から2033年にかけて年平均成長率(CAGR)5.0%で最も高い成長が見込まれています。
- 種類別に見ると、黒色マスターバッチが2026年から2033年にかけて7.3%という最も高いCAGRで収益成長を遂げると予測されています。
- キャリアポリマー別に見ると、ポリプロピレン(PP)セグメントが2025年に26.8%という最大の収益シェアを占めました。
ブランドオーナーは、製品の差別化、店頭での魅力向上、そして賞味期限の延長にますます注力しており、これが大量包装用途における高性能着色剤および添加剤マスターバッチの採用を促進しています。自動車および建設分野における軽量で耐久性のあるプラスチック部品の使用増加は、耐熱性、難燃性、耐候性といった性能向上を目的としたマスターバッチの需要を加速させています。メーカーが規制要件やサステナビリティ要件を満たすために、コスト効率が高く高強度なポリマーソリューションへと移行するにつれ、マスターバッチは材料性能と加工効率の向上において重要な役割を果たしています。
規制圧力の高まりとブランドレベルでのサステナビリティへの取り組みは、循環型経済の目標を支援するバイオベース、リサイクル可能、および添加剤マスターバッチに大きなビジネスチャンスをもたらしています。カーボンブラック代替品、生分解性キャリア樹脂、リサイクルポリマーと互換性のあるマスターバッチなどのソリューションを提供するメーカーは、コンバーターが環境負荷とコンプライアンスリスクを低減しながら性能を維持できる材料をますます求めるようになる中で、競争優位性を獲得できます。
Masterbatch Market Summary
The global masterbatchasterbatch market size was estimated at USD 7,008.0 million in 2025 and is projected to reach USD 10,476.2 million by 2033, growing at a CAGR of 5.0% from 2026 to 2033. Growing consumption of flexible and rigid plastic packaging across food, beverages, personal care, and household products is driving demand for masterbatches used for coloring, UV stabilization, and functional enhancement.
Key Market Trends & Insights
- Asia Pacific dominated the masterbatch market with the largest revenue share of 30.7% in 2025.
- The China masterbatch industry is expected to grow at the fastest CAGR of 5.0% from 2026 to 2033.
- By type, the black segment is expected to grow at the fastest CAGR of 7.3% from 2026 to 2033 in terms of revenue.
- By carrier polymer, the polypropylene (PP) segment held the largest revenue share of 26.8% in 2025.
Market Size & Forecast
- 2025 Market Size: USD 7,008.0 Million
- 2033 Projected Market Size: USD 10,476.2 Million
- CAGR (2026-2033): 5.0%
- Asia Pacific: Largest Market in 2025
Brand owners are increasingly focusing on product differentiation, shelf appeal, and extended shelf life, which boosts the adoption of high-performance color and additive masterbatches in mass-volume packaging applications. The increasing use of lightweight, durable plastic components in automotive and construction sectors is accelerating masterbatch demand for performance enhancement, including heat resistance, flame retardancy, and weather stability. As manufacturers shift toward cost-efficient and high-strength polymer solutions to meet regulatory and sustainability requirements, masterbatches play a critical role in improving material performance and processing efficiency.
Rising regulatory pressure and brand-level sustainability commitments are creating strong opportunities for bio-based, recyclable, and additive masterbatches that support circular economy goals. Manufacturers offering solutions such as carbon-black alternatives, biodegradable carrier resins, and masterbatches compatible with recycled polymers can gain a competitive advantage, as converters increasingly seek materials that maintain performance while reducing environmental impact and compliance risks.
Type Insights
The black segment dominated the global industry with the largest revenue share of 28.8% in 2025. The widespread use of carbon black masterbatches in packaging, automotive, and construction plastics drives segment dominance due to their superior UV resistance, electrical conductivity, and cost-effectiveness. Consistent demand from pipes, films, and molded components requiring durability and long service life reinforces the strong market position of black masterbatches.
The white segment is expected to grow significantly with a CAGR of 7.1% during the forecast period. Rising demand for high-opacity, brightness, and cost-efficient pigmentation in flexible packaging, consumer goods, and agricultural films is driving the growth of white masterbatches. Increased use of titanium dioxide–based solutions to enhance aesthetics, UV protection, and material performance across high-volume plastic applications continues to support strong adoption.
End-use Insights
The packaging segment dominated the industry with the largest revenue share of 27.2% in 2025. The high-volume use of plastics in flexible and rigid packaging across food, beverages, and consumer goods drives dominant demand for masterbatches used for coloration, protection, and functional enhancement. Continuous focus on shelf appeal, product differentiation, and extended shelf life sustains strong masterbatch consumption in packaging applications.

masterbatch-market-share
Automotive & Transportation is expected to grow significantly with a CAGR of 7.0% during the forecast period. Increasing adoption of lightweight plastic components to improve fuel efficiency and meet emission regulations is driving growth in automotive and transportation applications. Masterbatches enabling heat resistance, UV stability, and aesthetic consistency are increasingly used in interior and exterior vehicle components, supporting sustained market expansion.
Key Masterbatch Company Insights
Key players such as Schulman, Inc., Ampacet Corporation, Cabot Corporation, and Clariant AG dominate the masterbatch market through strong global manufacturing footprints, broad color and additive portfolios, and continuous innovation in high-performance and sustainable masterbatch solutions.
- Schulman, Inc. is a leading player in the masterbatch market, recognized for its comprehensive portfolio of color and additive masterbatches serving packaging, automotive, consumer goods, and industrial applications. The company leverages strong formulation expertise, global manufacturing capabilities, and customer-centric customization to deliver consistent product performance and long-term value across high-volume and specialty plastic applications.
- Ampacet Corporation is a prominent masterbatch manufacturer with a strong focus on color, special effects, and functional additive solutions for the plastics industry. The company’s competitive strength lies in its advanced R&D capabilities, broad global presence, and ability to develop application-specific masterbatches that support product differentiation, processing efficiency, and sustainability objectives across diverse end-use markets.
Key Masterbatch Companies:
The following key companies have been profiled for this study on the masterbatch market.
- Schulman, Inc.
- Ampacet Corporation
- Cabot Corporation
- Clariant AG
- Global Colors Group
- Hubron International Ltd.
- Penn Color, Inc.
- Plastiblends India Ltd.
- Tosaf Group
- PolyOne Corporation
Recent Developments
- In January 2024, Hubron International Ltd. and Black Swan Graphene Inc. entered a commercial agreement to expedite the use of Black Swan’s graphene products. Hubron, a specialist in plastic masterbatch and conductive compounds, incorporates graphene to improve functionality in masterbatch solutions. This collaboration aims to integrate graphene into various sectors such as automotive, construction, and packaging, leveraging Hubron’s market reach and expertise in masterbatch production.
Masterbatch Market Report Scope
| Report Attribute | Details |
| Market size value in 2026 | USD 7,451.9 million |
| Revenue forecast in 2033 | USD 10,476.2 million |
| Growth rate | CAGR of 5.0% from 2026 to 2033 |
| Base year for estimation | 2025 |
| Historical data | 2018 – 2024 |
| Forecast period | 2026 – 2033 |
| Quantitative units | Volume in kilotons, revenue in USD million/billion, and CAGR from 2026 to 2033 |
| Report coverage | Revenue forecast, volume forecast, company ranking, competitive landscape, growth factors, and trends |
| Segments covered | Type, carrier polymers, end-use, region |
| Regional scope | North America; Europe; Asia Pacific; Middle East & Africa; Latin America |
| Country scope | U.S.; Canada; Mexico; Germany; UK; France; Italy; Spain; China; India; Japan; Southeast Asia; Brazil; Argentina |
| Key companies profiled | Schulman, Inc.; Ampacet Corporation; Cabot Corporation; Clariant AG; Global Colors Group; Hubron International Ltd.; Penn Color; Plastiblends India Ltd.; Tosaf Group PolyOne Corporation |
| Customization scope | Free report customization (equivalent up to 8 analysts’ working days) with purchase. Addition or alteration to country, regional & segment scope. |
Global Masterbatch Market Report Segmentation
This report forecasts volume & revenue growth at global, regional, and country levels and provides an analysis of the latest industry trends in each of the sub-segments from 2018 to 2033. For this study, Grand View Research has segmented the global masterbatch market report based on type, carrier polymer, end-use, and region:
- Type Outlook (Volume, Kilotons; Revenue, USD Million, 2018 – 2033)
- White
- Black
- Color
- Additive
- Filler
- Biodegradable
- Carrier Polymer Outlook (Volume, Kilotons; Revenue, USD Million, 2018 – 2033)
- Polypropylene (PP)
- Polyethylene (PE)
- Polyvinyl Chloride (PVC)
- Polyethylene Terephthalate (PET)
- Biodegradable Plastics
- End-use Outlook (Volume, Kilotons; Revenue, USD Million, 2018 – 2033)
- Packaging
- Building & Construction
- Consumer Goods
- Automotive & Transportation
- Agriculture
- Other End Users
- Regional Outlook (Volume, Kilotons; Revenue, USD Million, 2018 – 2033)
- North America
- U.S.
- Canada
- Mexico
- Europe
- Germany
- UK
- France
- Italy
- Spain
- Asia Pacific
- China
- India
- Japan
- Southeast Asia
- Malaysia
- Thailand
- Vietnam
- Singapore
- Indonesia
- Philippines
- Rest of Southeast Asia
- Latin America
- Brazil
- Argentina
- Middle East & Africa
- North America
Table of Contents
Chapter 1. Methodology and Scope
1.1. Research Methodology
1.2. Research Scope & Assumption
1.3. Information Procurement
1.3.1. Purchased Database
1.3.2. GVR’s Internal Database
1.3.3. Secondary Type & Third-Party Perspectives
1.3.4. Primary Research
1.4. Information Analysis
1.4.1. Data Analysis Models
1.5. Market Estimation & Data Visualization
1.6. List of Data Types
Chapter 2. Executive Summary
2.1. Market Outlook, 2025 (USD Million)
2.2. Segmental Outlook
2.3. Competitive Insights
Chapter 3. Masterbatch Market Variables, Trends & Scope
3.1. Market Lineage/Ancillary Market Outlook
3.2. Industry Value Chain Analysis
3.2.1. Sales Channel Analysis
3.2.2. Manufacturing Trends/Technological Advancements
3.2.3. Raw Type Trends
3.3. Price Trend Analysis, 2018 – 2033 (USD/KG)
3.3.1. Key Factors Influencing Prices
3.4. Regulatory Framework
3.4.1. Analyst Perspective
3.4.2. Regulations & Standards
3.5. Market Dynamics
3.5.1. Market Driver Analysis
3.5.2. Market Restraint Analysis
3.5.3. Industry Opportunities
3.5.4. Industry Challenges
3.6. Other Business Carrier Polymers Tools Analysis: Masterbatch Market
3.6.1. Porter’s Five Forces Analysis
3.6.1.1. Bargaining Power of Suppliers
3.6.1.2. Bargaining Power of Buyers
3.6.1.3. Threat of Substitution
3.6.1.4. Threat of New Entrants
3.6.1.5. Competitive Rivalry
3.6.2. PESTLE Analysis
3.6.2.1. Political Landscape
3.6.2.2. Economic Landscape
3.6.2.3. Social Landscape
3.6.2.4. Technological Landscape
3.6.2.5. Environmental Landscape
3.6.2.6. Legal Landscape
Chapter 4. Masterbatch Market: Type Estimates & Trend Analysis
4.1. Key Takeaways
4.2. Type Movement Analysis & Market Share, 2025 & 2033
4.3. Global Masterbatch Market by Type, 2018 – 2033 (Kilotons) (USD Million)
4.4. White
4.4.1. White Masterbatch Market Estimates and Forecasts, 2018 – 2033 (Kilotons)
4.5. Black
4.5.1. Black Masterbatch Market Estimates and Forecasts, 2018 – 2033 (Kilotons) (USD Million)
4.6. Color
4.6.1. Color Masterbatch Market Estimates and Forecasts, 2018 – 2033 (Kilotons)
4.7. Additive
4.7.1. Additive Masterbatch Market Estimates and Forecasts, 2018 – 2033 (Kilotons)
4.8. Filler
4.8.1. Filler Masterbatch Market Estimates and Forecasts, 2018 – 2033 (Kilotons)
4.9. Biodegradable
4.9.1. Biodegradable Masterbatch Market Estimates and Forecasts, 2018 – 2033 (Kilotons)
Chapter 5. Masterbatch Market: Carrier Polymer Estimates & Trend Analysis
5.1. Key Takeaways
5.2. Carrier Polymer Movement Analysis & Market Share, 2025 & 2033
5.3. Global Masterbatch Market by Carrier Polymer, 2018 – 2033 (Kilotons) (USD Million)
5.4. Polypropylene (PP)
5.4.1. Polypropylene (PP) Masterbatch Market Estimates and Forecasts, 2018 – 2033 (Kilotons)
5.5. Polyethylene (PE)
5.5.1. Polyethylene (PE) Masterbatch Market Estimates and Forecasts, 2018 – 2033 (Kilotons)
5.6. Polyvinyl Chloride (PVC)
5.6.1. Polyvinyl Chloride (PVC) Masterbatch Market Estimates and Forecasts, 2018 – 2033 (Kilotons)
5.7. Polyethylene Terephthalate (PET)
5.7.1. Polyethylene Terephthalate (PET) Masterbatch Market Estimates and Forecasts, 2018 – 2033 (Kilotons)
5.8. Biodegradable Plastics
5.8.1. Biodegradable Plastics Masterbatch Market Estimates and Forecasts, 2018 – 2033 (Kilo Tons)
Chapter 6. Masterbatch Market: End Use Estimates & Trend Analysis
6.1. Key Takeaways
6.2. Carrier Polymer Movement Analysis & Market Share, 2025 & 2033
6.3. Global Masterbatch Market by Carrier Polymer, 2018 – 2033 (Kilotons) (USD Million)
6.4. Packaging
6.4.1. Masterbatch Market Estimates and Forecasts, for Packaging, 2018 – 2033 (Kilotons)
6.5. Building & Construction
6.5.1. Masterbatch Market Estimates and Forecasts, for Building & Construction, 2018 – 2033 (Kilotons)
6.6. Consumer Goods
6.6.1. Masterbatch Market Estimates and Forecasts, for Consumer Goods, 2018 – 2033 (Kilotons)
6.7. Automotive & Transportation
6.7.1. Masterbatch Market Estimates and Forecasts, for Automotive & Transportation, 2018 – 2033 (Kilotons)
6.8. Agriculture
6.8.1. Masterbatch Market Estimates and Forecasts, for Agriculture, 2018 – 2033 (Kilo Tons)
6.9. Other End Users
6.9.1. Masterbatch Market Estimates and Forecasts, for Others, 2018 – 2033 (Kilo Tons)
Chapter 7. Masterbatch Market: Regional Estimates & Trend Analysis
7.1. Key Takeaways
7.2. Regional Market Share Analysis, 2025 & 2033
7.3. North America
7.3.1. North America Masterbatch Market Estimates and Forecasts, 2018 – 2033 (Kilotons) (USD Million)
7.3.2. North America Masterbatch Market Estimates and Forecasts, By Type, 2018 – 2033 (Kilotons) (USD Million)
7.3.3. North America Masterbatch Market Estimates and Forecasts, By Carrier Polymer, 2018 – 2033 (Kilotons) (USD Million)
7.3.4. North America Masterbatch Market Estimates and Forecasts, By End Use, 2018 – 2033 (Kilotons) (USD Million)
7.3.5. U.S.
7.3.5.1. U.S. Masterbatch Market Estimates and Forecasts, 2018 – 2033 (Kilotons) (USD Million)
7.3.5.2. U.S. Masterbatch Market Estimates and Forecasts, By Type, 2018 – 2033 (Kilotons) (USD Million)
7.3.5.3. U.S. Masterbatch Market Estimates and Forecasts, By Carrier Polymer, 2018 – 2033 (Kilotons) (USD Million)
7.3.5.4. U.S. Masterbatch Market Estimates and Forecasts, By End Use, 2018 – 2033 (Kilotons) (USD Million)
7.3.6. Canada
7.3.6.1. Canada Masterbatch Market Estimates and Forecasts, 2018 – 2033 (Kilotons) (USD Million)
7.3.6.2. Canada Masterbatch Market Estimates and Forecasts, By Type, 2018 – 2033 (Kilotons) (USD Million)
7.3.6.3. Canada Masterbatch Market Estimates and Forecasts, By Carrier Polymer, 2018 – 2033 (Kilotons) (USD Million)
7.3.6.4. Canada Masterbatch Market Estimates and Forecasts, By End Use, 2018 – 2033 (Kilotons) (USD Million)
7.3.7. Mexico
7.3.7.1. Mexico Masterbatch Market Estimates and Forecasts, 2018 – 2033 (Kilotons) (USD Million)
7.3.7.2. Mexico Masterbatch Market Estimates and Forecasts, By Type, 2018 – 2033 (Kilotons) (USD Million)
7.3.7.3. Mexico Masterbatch Market Estimates and Forecasts, By Carrier Polymer, 2018 – 2033 (Kilotons) (USD Million)
7.3.7.4. Mexico Masterbatch Market Estimates and Forecasts, By End Use, 2018 – 2033 (Kilotons) (USD Million)
7.4. Europe
7.4.1. Europe Masterbatch Market Estimates and Forecasts, 2018 – 2033 (Kilotons) (USD Million)
7.4.2. Europe Masterbatch Market Estimates and Forecasts, Type, 2018 – 2033 (Kilotons) (USD Million)
7.4.3. Europe Masterbatch Market Estimates and Forecasts, Carrier Polymer, 2018 – 2033 (Kilotons) (USD Million)
7.4.4. Europe Masterbatch Market Estimates and Forecasts, End Use, 2018 – 2033 (Kilotons) (USD Million)
7.4.5. Germany
7.4.5.1. Germany Masterbatch Market Estimates and Forecasts, 2018 – 2033 (Kilotons) (USD Million)
7.4.5.2. Germany Masterbatch Market Estimates and Forecasts, By Type, 2018 – 2033 (Kilotons) (USD Million)
7.4.5.3. Germany Masterbatch Market Estimates and Forecasts, By Carrier Polymer, 2018 – 2033 (Kilotons) (USD Million)
7.4.5.4. Germany Masterbatch Market Estimates and Forecasts, By End Use, 2018 – 2033 (Kilotons) (USD Million)
7.4.6. UK
7.4.6.1. UK Masterbatch Market Estimates and Forecasts, 2018 – 2033 (Kilotons) (USD Million)
7.4.6.2. UK Masterbatch Market Estimates and Forecasts, By Type, 2018 – 2033 (Kilotons) (USD Million)
7.4.6.3. UK Masterbatch Market Estimates and Forecasts, By Carrier Polymer, 2018 – 2033 (Kilotons) (USD Million)
7.4.6.4. UK Masterbatch Market Estimates and Forecasts, By End Use, 2018 – 2033 (Kilotons) (USD Million)
7.4.7. France
7.4.7.1. France Masterbatch Market Estimates and Forecasts, 2018 – 2033 (Kilotons) (USD Million)
7.4.7.2. France Masterbatch Market Estimates and Forecasts, By Type, 2018 – 2033 (Kilotons) (USD Million)
7.4.7.3. France Masterbatch Market Estimates and Forecasts, By Carrier Polymer, 2018 – 2033 (Kilotons) (USD Million)
7.4.7.4. France Masterbatch Market Estimates and Forecasts, By End Use, 2018 – 2033 (Kilotons) (USD Million)
7.4.8. Italy
7.4.8.1. Italy Masterbatch Market Estimates and Forecasts, 2018 – 2033 (Kilotons) (USD Million)
7.4.8.2. Italy Masterbatch Market Estimates and Forecasts, By Type, 2018 – 2033 (Kilotons) (USD Million)
7.4.8.3. Italy Masterbatch Market Estimates and Forecasts, By Carrier Polymer, 2018 – 2033 (Kilotons) (USD Million)
7.4.8.4. Italy Masterbatch Market Estimates and Forecasts, By End use, 2018 – 2033 (Kilotons) (USD Million)
7.4.9. Spain
7.4.9.1. Spain Masterbatch Market Estimates and Forecasts, 2018 – 2033 (Kilotons) (USD Million)
7.4.9.2. Spain Masterbatch Market Estimates and Forecasts, By Type, 2018 – 2033 (Kilotons) (USD Million)
7.4.9.3. Spain Masterbatch Market Estimates and Forecasts, By Carrier Polymer, 2018 – 2033 (Kilotons) (USD Million)
7.4.9.4. Spain Masterbatch Market Estimates and Forecasts, By End Use, 2018 – 2033 (Kilotons) (USD Million)
7.5. Asia Pacific
7.5.1. Asia Pacific Masterbatch Market Estimates and Forecasts, 2018 – 2033 (Kilotons) (USD Million)
7.5.2. Asia Pacific Masterbatch Market Estimates and Forecasts, By Type, 2018 – 2033 (Kilotons) (USD Million)
7.5.3. Asia Pacific Masterbatch Market Estimates and Forecasts, By Carrier Polymer, 2018 – 2033 (Kilotons) (USD Million)
7.5.4. Asia Pacific Masterbatch Market Estimates and Forecasts, By End Use, 2018 – 2033 (Kilotons) (USD Million)
7.5.5. China
7.5.5.1. China Masterbatch Market Estimates and Forecasts, 2018 – 2033 (Kilotons) (USD Million)
7.5.5.2. China Masterbatch Market Estimates and Forecasts, By Type, 2018 – 2033 (Kilotons) (USD Million)
7.5.5.3. China Masterbatch Market Estimates and Forecasts, By Carrier Polymer, 2018 – 2033 (Kilotons) (USD Million)
7.5.5.4. China Masterbatch Market Estimates and Forecasts, By End Use, 2018 – 2033 (Kilotons) (USD Million)
7.5.6. India
7.5.6.1. India Masterbatch Market Estimates and Forecasts, 2018 – 2033 (Kilotons) (USD Million)
7.5.6.2. India Masterbatch Market Estimates and Forecasts, By Type, 2018 – 2033 (Kilotons) (USD Million)
7.5.6.3. India Masterbatch Market Estimates and Forecasts, By Carrier Polymer, 2018 – 2033 (Kilotons) (USD Million)
7.5.6.4. India Masterbatch Market Estimates and Forecasts, By End Use, 2018 – 2033 (Kilotons) (USD Million)
7.5.7. Japan
7.5.7.1. Japan Masterbatch Market Estimates and Forecasts, 2018 – 2033 (Kilotons) (USD Million)
7.5.7.2. Japan Masterbatch Market Estimates and Forecasts, By Type, 2018 – 2033 (Kilotons) (USD Million)
7.5.7.3. Japan Masterbatch Market Estimates and Forecasts, By Carrier Polymer, 2018 – 2033 (Kilotons) (USD Million)
7.5.7.4. Japan Masterbatch Market Estimates and Forecasts, By End Use, 2018 – 2033 (Kilotons) (USD Million)
7.5.8. Southeast Asia
7.5.8.1. Southeast Asia Masterbatch Market Estimates and Forecasts, 2018 – 2033 (Kilotons) (USD Million)
7.5.8.2. Southeast Asia Masterbatch Market Estimates and Forecasts, By Type, 2018 – 2033 (Kilotons) (USD Million)
7.5.8.3. Southeast Asia Masterbatch Market Estimates and Forecasts, By Carrier Polymer, 2018 – 2033 (Kilotons) (USD Million)
7.5.8.4. Southeast Asia Masterbatch Market Estimates and Forecasts, By End Use, 2018 – 2033 (Kilotons) (USD Million)
7.5.8.5. Malaysia
7.5.8.5.1. Malaysia Masterbatch Market Estimates and Forecasts, 2018 – 2033 (Kilotons) (USD Million)
7.5.8.5.2. Malaysia Masterbatch Market Estimates and Forecasts, By Type, 2018 – 2033 (Kilotons) (USD Million)
7.5.8.5.3. Malaysia Masterbatch Market Estimates and Forecasts, By Carrier Polymer, 2018 – 2033 (Kilotons) (USD Million)
7.5.8.5.4. Malaysia Masterbatch Market Estimates and Forecasts, By End Use, 2018 – 2033 (Kilotons) (USD Million)
7.5.8.6. Thailand
7.5.8.6.1. Thailand Masterbatch Market Estimates and Forecasts, 2018 – 2033 (Kilotons) (USD Million)
7.5.8.6.2. Thailand Masterbatch Market Estimates and Forecasts, By Type, 2018 – 2033 (Kilotons) (USD Million)
7.5.8.6.3. Thailand Masterbatch Market Estimates and Forecasts, By Carrier Polymer, 2018 – 2033 (Kilotons) (USD Million)
7.5.8.6.4. Thailand Masterbatch Market Estimates and Forecasts, By End Use, 2018 – 2033 (Kilotons) (USD Million)
7.5.8.7. Vietnam
7.5.8.7.1. Vietnam Masterbatch Market Estimates and Forecasts, 2018 – 2033 (Kilotons) (USD Million)
7.5.8.7.2. Vietnam Masterbatch Market Estimates and Forecasts, By Type, 2018 – 2033 (Kilotons) (USD Million)
7.5.8.7.3. Vietnam Masterbatch Market Estimates and Forecasts, By Carrier Polymer, 2018 – 2033 (Kilotons) (USD Million)
7.5.8.7.4. Vietnam Masterbatch Market Estimates and Forecasts, By End Use, 2018 – 2033 (Kilotons) (USD Million)
7.5.8.8. Singapore
7.5.8.8.1. Singapore Masterbatch Market Estimates and Forecasts, 2018 – 2033 (Kilotons) (USD Million)
7.5.8.8.2. Singapore Masterbatch Market Estimates and Forecasts, By Type, 2018 – 2033 (Kilotons) (USD Million)
7.5.8.8.3. Singapore Masterbatch Market Estimates and Forecasts, By Carrier Polymer, 2018 – 2033 (Kilotons) (USD Million)
7.5.8.8.4. Singapore Masterbatch Market Estimates and Forecasts, By End Use, 2018 – 2033 (Kilotons) (USD Million)
7.5.8.9. Indonesia
7.5.8.9.1. Indonesia Masterbatch Market Estimates and Forecasts, 2018 – 2033 (Kilotons) (USD Million)
7.5.8.9.2. Indonesia Masterbatch Market Estimates and Forecasts, By Type, 2018 – 2033 (Kilotons) (USD Million)
7.5.8.9.3. Indonesia Masterbatch Market Estimates and Forecasts, By Carrier Polymer, 2018 – 2033 (Kilotons) (USD Million)
7.5.8.9.4. Indonesia Masterbatch Market Estimates and Forecasts, By End Use, 2018 – 2033 (Kilotons) (USD Million)
7.5.8.10. Philippines
7.5.8.10.1. Philippines Masterbatch Market Estimates and Forecasts, 2018 – 2033 (Kilotons) (USD Million)
7.5.8.10.2. Philippines Masterbatch Market Estimates and Forecasts, By Type, 2018 – 2033 (Kilotons) (USD Million)
7.5.8.10.3. Philippines Masterbatch Market Estimates and Forecasts, By Carrier Polymer, 2018 – 2033 (Kilotons) (USD Million)
7.5.8.10.4. Philippines Masterbatch Market Estimates and Forecasts, By End Use, 2018 – 2033 (Kilotons) (USD Million)
7.6. Middle East & Africa
7.6.1. Middle East & Africa Masterbatch Market Estimates and Forecasts, 2018 – 2033 (Kilotons) (USD Million)
7.6.2. Middle East & Africa Masterbatch Market Estimates and Forecasts, By Type, 2018 – 2033 (Kilotons) (USD Million)
7.6.3. Middle East & Africa Masterbatch Market Estimates and Forecasts, By Carrier Polymer, 2018 – 2033 (Kilotons) (USD Million)
7.6.4. Middle East & Africa Masterbatch Market Estimates and Forecasts, By End Use, 2018 – 2033 (Kilotons) (USD Million)
7.7. Latin America
7.7.1. Latin America Masterbatch Market Estimates and Forecasts, 2018 – 2033 (Kilotons) (USD Million)
7.7.2. Latin America Masterbatch Market Estimates and Forecasts, By Type, 2018 – 2033 (Kilotons) (USD Million)
7.7.3. Latin America Masterbatch Market Estimates and Forecasts, By Carrier Polymer, 2018 – 2033 (Kilotons) (USD Million)
7.7.4. Latin America Masterbatch Market Estimates and Forecasts, By End Use, 2018 – 2033 (Kilotons) (USD Million)
7.7.5. Brazil
7.7.5.1. Brazil Masterbatch Market Estimates and Forecasts, 2018 – 2033 (Kilotons) (USD Million)
7.7.5.2. Brazil Masterbatch Market Estimates and Forecasts, By Type, 2018 – 2033 (Kilotons) (USD Million)
7.7.5.3. Brazil Masterbatch Market Estimates and Forecasts, By Carrier Polymer, 2018 – 2033 (Kilotons) (USD Million)
7.7.5.4. Brazil Masterbatch Market Estimates and Forecasts, By End Use, 2018 – 2033 (Kilotons) (USD Million)
7.7.6. Argentina
7.7.6.1. Argentina Masterbatch Market Estimates and Forecasts, 2018 – 2033 (Kilotons) (USD Million)
7.7.6.2. Argentina Masterbatch Market Estimates and Forecasts, By Type, 2018 – 2033 (Kilotons) (USD Million)
7.7.6.3. Argentina Masterbatch Market Estimates and Forecasts, By Carrier Polymer, 2018 – 2033 (Kilotons) (USD Million)
7.7.6.4. Argentina Masterbatch Market Estimates and Forecasts, By End Use, 2018 – 2033 (Kilotons) (USD Million)
Chapter 8. Competitive Landscape
8.1. Key Players, their Recent Developments, and their Impact on Industry
8.2. Competition Categorization
8.3. Company Market Position Analysis
8.4. Company Heat Map Analysis
8.5. Strategy Mapping, 2025
8.6. Company Listing
8.6.1. Schulman, Inc.
8.6.1.1. Company Overview
8.6.1.2. Financial Performance
8.6.1.3. Product Benchmarking
8.6.2. Ampacet Corporation
8.6.2.1. Company Overview
8.6.2.2. Financial Performance
8.6.2.3. Product Benchmarking
8.6.3. Cabot Corporation
8.6.3.1. Company Overview
8.6.3.2. Financial Performance
8.6.3.3. Product Benchmarking
8.6.4. Clariant AG
8.6.4.1. Company Overview
8.6.4.2. Financial Performance
8.6.4.3. Product Benchmarking
8.6.5. Global Colors Group
8.6.5.1. Company Overview
8.6.5.2. Financial Performance
8.6.5.3. Product Benchmarking
8.6.6. Hubron International Ltd.
8.6.6.1. Company Overview
8.6.6.2. Financial Performance
8.6.6.3. Product Benchmarking
8.6.7. Penn Color, Inc.
8.6.7.1. Company Overview
8.6.7.2. Financial Performance
8.6.7.3. Product Benchmarking
8.6.8. Plastiblends India Ltd.
8.6.8.1. Company Overview
8.6.8.2. Financial Performance
8.6.8.3. Product Benchmarking
8.6.9. PolyOne Corporation
8.6.9.1. Company Overview
8.6.9.2. Financial Performance
8.6.9.3. Product Benchmarking
8.6.10. Tosaf Group
8.6.10.1. Company Overview
8.6.10.2. Financial Performance
8.6.10.3. Product Benchmarkin
List of Tables
Table 1 Masterbatch Market Estimates and Forecasts, by Type, 2018 – 2033 (Kilotons) (USD Million)
Table 2 White Masterbatch Market Estimates and Forecasts, 2018 – 2033 (Kilotons) (USD Million)
Table 3 Black Market Estimates and Forecasts, 2018 – 2033 (Kilotons) (USD Million)
Table 4 Color Market Estimates and Forecasts, 2018 – 2033 (Kilotons) (USD Million)
Table 5 Additive Market Estimates and Forecasts, 2018 – 2033 (Kilotons) (USD Million)
Table 6 Filler Market Estimates and Forecasts, 2018 – 2033 (Kilotons) (USD Million)
Table 7 Biodegradable Market Estimates and Forecasts, 2018 – 2033 (Kilotons) (USD Million)
Table 8 Masterbatch Market Estimates and Forecasts, by Carrier Polymer, 2018- 2033 (Kilotons) (USD Million)
Table 9 Polypropylene (PP) Masterbatch Market Estimates and Forecasts, 2018 – 2033 (Kilotons) (USD Million)
Table 10 Polyethylene (PE) Masterbatch Market Estimates and Forecasts, 2018 – 2033 (Kilotons) (USD Million)
Table 11 Polyvinyl Chloride (PVC) Masterbatch Market Estimates and Forecasts, 2018 – 2033 (Kilotons) (USD Million)
Table 12 Polyethylene Terephthalate (PET) Masterbatch Market Estimates and Forecasts, 2018 – 2033 (Kilotons) (USD Million)
Table 13 Biodegradable Plastics Masterbatch Market Estimates and Forecasts, 2018 – 2033 (Kilotons) (USD Million)
Table 14 Masterbatch Market Estimates and Forecasts, by End Use, 2018 – 2033 (Kilotons) (USD Million)
Table 15 Masterbatch Market Estimates and Forecasts, In Packaging, 2018 – 2033 (Kilotons) (USD Million)
Table 16 Masterbatch Market Estimates and Forecasts, In Building & Construction, 2018 – 2033 (Kilotons) (USD Million)
Table 17 Masterbatch Market Estimates and Forecasts, In Consumer Goods, 2018 – 2033 (Kilotons) (USD Million)
Table 18 Masterbatch Market Estimates and Forecasts, In Automotive & Transportation, 2018 – 2033 (Kilotons) (USD Million)
Table 19 Masterbatch Market Estimates and Forecasts, In Agriculture, 2018 – 2033 (Kilotons) (USD Million)
Table 20 Masterbatch Market Estimates and Forecasts, In Others, 2018 – 2033 (Kilotons) (USD Million)
Table 21 Masterbatch Market Estimates and Forecasts, by region, 2018 – 2033 (Kilotons) (USD Million)
Table 22 North America Masterbatch Market Estimates and Forecasts, 2018 – 2033 (Kilotons) (USD Million)
Table 23 North America Masterbatch Market Estimates and Forecasts, By Type, 2018 – 2033 (Kilotons) (USD Million)
Table 24 North America Masterbatch Market Estimates and Forecasts, By Carrier Polymer, 2018 – 2033 (Kilotons) (USD Million)
Table 25 North America Masterbatch Market Estimates and Forecasts, By End Use, 2018 – 2033 (Kilotons) (USD Million)
Table 26 U.S. Masterbatch Market Estimates and Forecasts, 2018 – 2033 (Kilotons) (USD Million)
Table 27 U.S. Masterbatch Market Estimates and Forecasts, By Type, 2018 – 2033 (Kilotons) (USD Million)
Table 28 U.S. Masterbatch Market Estimates and Forecasts, By Carrier Polymer, 2018 – 2033 (Kilotons) (USD Million)
Table 29 U.S. Masterbatch Market Estimates and Forecasts, By End Use, 2018 – 2033 (Kilotons) (USD Million)
Table 30 Canada Masterbatch Market Estimates and Forecasts, 2018 – 2033 (Kilotons) (USD Million)
Table 31 Canada Masterbatch Market Estimates and Forecasts, By Type, 2018 – 2033 (Kilotons) (USD Million)
Table 32 Canada Masterbatch Market Estimates and Forecasts, By Carrier Polymer, 2018 – 2033 (Kilotons) (USD Million)
Table 33 Canada Masterbatch Market Estimates and Forecasts, By End Use, 2018 – 2033 (Kilotons) (USD Million)
Table 34 Mexico Masterbatch Market Estimates and Forecasts, 2018 – 2033 (Kilotons) (USD Million)
Table 35 Mexico Masterbatch Market Estimates and Forecasts, By Type, 2018 – 2033 (Kilotons) (USD Million)
Table 36 Mexico Masterbatch Market Estimates and Forecasts, By Carrier Polymer, 2018 – 2033 (USD Million) (Kilotons)
Table 37 Mexico Masterbatch Market Estimates and Forecasts, By End Use, 2018 – 2033 (Kilotons) (USD Million)
Table 38 Europe Masterbatch Market Estimates and Forecasts, 2018 – 2033 (Kilotons) (USD Million)
Table 39 Europe Masterbatch Market Estimates and Forecasts, By Type, 2018 – 2033 (Kilotons) (USD Million)
Table 40 Europe Masterbatch Market Estimates and Forecasts, By Carrier Polymer, 2018 – 2033 (Kilotons) (USD Million)
Table 41 Europe Masterbatch Market Estimates and Forecasts, By End Use, 2018 – 2033 (Kilotons) (USD Million)
Table 42 Germany Masterbatch Market Estimates and Forecasts, 2018 – 2033 (Kilotons) (USD Million)
Table 43 Germany Masterbatch Market Estimates and Forecasts, By Type, 2018 – 2033 (Kilotons) (USD Million)
Table 44 Germany Masterbatch Market Estimates and Forecasts, By Carrier Polymer, 2018 – 2033 (Kilotons) (USD Million)
Table 45 Germany Masterbatch Market Estimates and Forecasts, By End Use, 2018 – 2033 (Kilotons) (USD Million)
Table 46 UK Masterbatch Market Estimates and Forecasts, 2018 – 2033 (Kilotons) (USD Million)
Table 47 UK Masterbatch Market Estimates and Forecasts, By Type, 2018 – 2033 (Kilotons) (USD Million)
Table 48 UK Masterbatch Market Estimates and Forecasts, By Carrier Polymer, 2018 – 2033 (Kilotons) (USD Million)
Table 49 UK Masterbatch Market Estimates and Forecasts, By End Use, 2018 – 2033 (Kilotons) (USD Million)
Table 50 France Masterbatch Market Estimates and Forecasts, 2018 – 2033 (Kilotons) (USD Million)
Table 51 France Masterbatch Market Estimates and Forecasts, By Type, 2018 – 2033 (Kilotons) (USD Million)
Table 52 France Masterbatch Market Estimates and Forecasts, By Carrier Polymer, 2018 – 2033 (Kilotons) (USD Million)
Table 53 France Masterbatch Market Estimates and Forecasts, By End Use, 2018 – 2033 (Kilotons) (USD Million)
Table 54 Italy Masterbatch Market Estimates and Forecasts, 2018 – 2033 (Kilotons) (USD Million)
Table 55 Italy Masterbatch Market Estimates and Forecasts, By Type, 2018 – 2033 (Kilotons) (USD Million)
Table 56 Italy Masterbatch Market Estimates and Forecasts, By Carrier Polymer, 2018 – 2033 (Kilotons) (USD Million)
Table 57 Italy Masterbatch Market Estimates and Forecasts, By End Use, 2018 – 2033 (Kilotons) (USD Million)
Table 58 Spain Masterbatch Market Estimates and Forecasts, 2018 – 2033 (Kilotons) (USD Million)
Table 59 Spain Masterbatch Market Estimates and Forecasts, By Type, 2018 – 2033 (Kilotons) (USD Million)
Table 60 Spain Masterbatch Market Estimates and Forecasts, By Carrier Polymer, 2018 – 2033 (Kilotons) (USD Million)
Table 61 Spain Masterbatch Market Estimates and Forecasts, By End Use, 2018 – 2033 (Kilotons) (USD Million)
Table 62 Asia Pacific Masterbatch Market Estimates and Forecasts, 2018 – 2033 (Kilotons) (USD Million)
Table 63 Asia Pacific Masterbatch Market Estimates and Forecasts, By Type, 2018 – 2033 (Kilotons) (USD Million)
Table 64 Asia Pacific Masterbatch Market Estimates and Forecasts, By Carrier Polymer, 2018 – 2033 (Kilotons) (USD Million)
Table 65 Asia Pacific Masterbatch Market Estimates and Forecasts, By End Use, 2018 – 2033 (Kilotons) (USD Million)
Table 66 China Masterbatch Market Estimates and Forecasts, 2018 – 2033 (Kilotons) (USD Million)
Table 67 China Masterbatch Market Estimates and Forecasts, By Type, 2018 – 2033 (Kilotons) (USD Million)
Table 68 China Masterbatch Market Estimates and Forecasts, By Carrier Polymer, 2018 – 2033 (Kilotons) (USD Million)
Table 69 China Masterbatch Market Estimates and Forecasts, By End Use, 2018 – 2033 (Kilotons) (USD Million)
Table 70 India Masterbatch Market Estimates and Forecasts, 2018 – 2033 (Kilotons) (USD Million)
Table 71 India Masterbatch Market Estimates and Forecasts, By Type, 2018 – 2033 (Kilotons) (USD Million)
Table 72 India Masterbatch Market Estimates and Forecasts, By Carrier Polymer, 2018 – 2033 (Kilotons) (USD Million)
Table 73 India Masterbatch Market Estimates and Forecasts, By End Use, 2018 – 2033 (Kilotons) (USD Million)
Table 74 Japan Masterbatch Market Estimates and Forecasts, 2018 – 2033 (Kilotons) (USD Million)
Table 75 Japan Masterbatch Market Estimates and Forecasts, By Type, 2018 – 2033 (Kilotons) (USD Million)
Table 76 Japan Masterbatch Market Estimates and Forecasts, By Carrier Polymer, 2018 – 2033 (Kilotons) (USD Million)
Table 77 Japan Masterbatch Market Estimates and Forecasts, By End Use, 2018 – 2033 (Kilotons) (USD Million)
Table 78 Southeast Asia Masterbatch Market Estimates and Forecasts, 2018 – 2033 (Kilotons) (USD Million)
Table 79 Southeast Asia Masterbatch Market Estimates and Forecasts, By Type, 2018 – 2033 (Kilotons) (USD Million)
Table 80 Southeast Asia Masterbatch Market Estimates and Forecasts, By Carrier Polymer, 2018 – 2033 (Kilotons) (USD Million)
Table 81 Southeast Asia Masterbatch Market Estimates and Forecasts, By End Use, 2018 – 2033 (Kilotons) (USD Million)
Table 82 Malaysia Masterbatch Market Estimates and Forecasts, 2018 – 2033 (Kilotons) (USD Million)
Table 83 Malaysia Masterbatch Market Estimates and Forecasts, By Type, 2018 – 2033 (Kilotons) (USD Million)
Table 84 Malaysia Masterbatch Market Estimates and Forecasts, By Carrier Polymer, 2018 – 2033 (Kilotons) (USD Million)
Table 85 Malaysia Masterbatch Market Estimates and Forecasts, By End Use, 2018 – 2033 (Kilotons) (USD Million)
Table 86 Thailand Masterbatch Market Estimates and Forecasts, 2018 – 2033 (Kilotons) (USD Million)
Table 87 Thailand Masterbatch Market Estimates and Forecasts, By Type, 2018 – 2033 (Kilotons) (USD Million)
Table 88 Thailand Masterbatch Market Estimates and Forecasts, By Carrier Polymer, 2018 – 2033 (Kilotons) (USD Million)
Table 89 Thailand Masterbatch Market Estimates and Forecasts, By End Use, 2018 – 2033 (Kilotons) (USD Million)
Table 90 Vietnam Masterbatch Market Estimates and Forecasts, 2018 – 2033 (Kilotons) (USD Million)
Table 91 Vietnam Masterbatch Market Estimates and Forecasts, By Type, 2018 – 2033 (Kilotons) (USD Million)
Table 92 Vietnam Masterbatch Market Estimates and Forecasts, By Carrier Polymer, 2018 – 2033 (Kilotons) (USD Million)
Table 93 Vietnam Masterbatch Market Estimates and Forecasts, By End Use, 2018 – 2033 (Kilotons) (USD Million)
Table 94 Singapore Masterbatch Market Estimates and Forecasts, 2018 – 2033 (Kilotons) (USD Million)
Table 95 Singapore Masterbatch Market Estimates and Forecasts, By Type, 2018 – 2033 (Kilotons) (USD Million)
Table 96 Singapore Masterbatch Market Estimates and Forecasts, By Carrier Polymer, 2018 – 2033 (Kilotons) (USD Million)
Table 97 Singapore Masterbatch Market Estimates and Forecasts, By End Use, 2018 – 2033 (Kilotons) (USD Million)
Table 98 Indonesia Masterbatch Market Estimates and Forecasts, 2018 – 2033 (Kilotons) (USD Million)
Table 99 Indonesia Masterbatch Market Estimates and Forecasts, By Type, 2018 – 2033 (Kilotons) (USD Million)
Table 100 Indonesia Masterbatch Market Estimates and Forecasts, By Carrier Polymer, 2018 – 2033 (Kilotons) (USD Million)
Table 101 Indonesia Masterbatch Market Estimates and Forecasts, By End Use, 2018 – 2033 (Kilotons) (USD Million)
Table 102 Philippines Masterbatch Market Estimates and Forecasts, 2018 – 2033 (Kilotons) (USD Million)
Table 103 Philippines Masterbatch Market Estimates and Forecasts, By Type, 2018 – 2033 (Kilotons) (USD Million)
Table 104 Philippines Masterbatch Market Estimates and Forecasts, By Carrier Polymer, 2018 – 2033 (Kilotons) (USD Million)
Table 105 Philippines Masterbatch Market Estimates and Forecasts, By End Use, 2018 – 2033 (Kilotons) (USD Million)
Table 106 Middle East & Africa Masterbatch Market Estimates and Forecasts, 2018 – 2033 (Kilotons) (USD Million)
Table 107 Middle East & Africa Masterbatch Market Estimates and Forecasts, By Type, 2018 – 2033 (Kilotons) (USD Million)
Table 108 Middle East & Africa Masterbatch Market Estimates and Forecasts, By Carrier Polymer, 2018 – 2033 (Kilotons) (USD Million)
Table 109 Middle East & Africa Masterbatch Market Estimates and Forecasts, By End Use, 2018 – 2033 (Kilotons) (USD Million)
Table 110 Latin America Masterbatch Market Estimates and Forecasts, 2018 – 2033 (Kilotons) (USD Million)
Table 111 Latin America Masterbatch Market Estimates and Forecasts, By Carrier Polymer, 2018 – 2033 (Kilotons) (USD Million)
Table 112 Latin America Masterbatch Market Estimates and Forecasts, By Type, 2018 – 2033 (Kilotons) (USD Million)
Table 113 Latin America Masterbatch Market Estimates and Forecasts, By End Use, 2018 – 2033 (Kilotons) (USD Million)
Table 114 Brazil Masterbatch Market Estimates and Forecasts, 2018 – 2033 (Kilotons) (USD Million)
Table 115 Brazil Masterbatch Market Estimates and Forecasts, By Type, 2018 – 2033 (Kilotons) (USD Million)
Table 116 Brazil Masterbatch Market Estimates and Forecasts, By Carrier Polymer, 2018 – 2033 (Kilotons) (USD Million)
Table 117 Brazil Masterbatch Market Estimates and Forecasts, By End Use, 2018 – 2033 (Kilotons) (USD Million)
Table 118 Argentina Masterbatch Market Estimates and Forecasts, 2018 – 2033 (Kilotons) (USD Million)
Table 119 Argentina Masterbatch Market Estimates and Forecasts, By Type, 2018 – 2033 (Kilotons) (USD Million)
Table 120 Argentina Masterbatch Market Estimates and Forecasts, By Carrier Polymer, 2018 – 2033 (Kilotons) (USD Million)
Table 121 Argentina Masterbatch Market Estimates and Forecasts, By End Use, 2018 – 2033 (Kilotons) (USD Million)
List of Figures
Fig. 1 Information Procurement
Fig. 2 Primary Research Pattern
Fig. 3 Primary Research Process
Fig. 4 Market Research Approaches – Bottom-Up Approach
Fig. 5 Market Research Approaches – Top-Down Approach
Fig. 6 Market Research Approaches – Combined Approach
Fig. 7 Market Snapshot
Fig. 8 Segmental Outlook
Fig. 9 Competitive Outlook
Fig. 10 Masterbatch Market – Value Chain Analysis
Fig. 11 Masterbatch Market – Sales Channel Analysis
Fig. 12 Market Drivers Impact Analysis
Fig. 13 Market Restraint Impact Analysis
Fig. 14 Industry Analysis – PORTERS
Fig. 15 Industry Analysis – PESTEL
Fig. 16 Type: Key Takeaways
Fig. 17 Type: Market Share, 2025 & 2033
Fig. 18 Carrier Polymer: Key Takeaways
Fig. 19 Carrier Polymer: Market Share, 2025 & 2033
Fig. 20 End Use: Key Takeaways
Fig. 21 End Use: Market Share, 2025 & 2033
Fig. 22 Region, 2025 & 2033, (Kilotons) (USD Million)
Fig. 23 Regional Marketplace: Key Takeaways
Fig. 24 Competition Categorization
Fig. 25 Company Market Positioning
Fig. 26 Strategy Mapping, 2025