IT Services Market Size, Share & Trends Analysis Report By Approach (Reactive IT Services, Proactive IT Services), By Type, By Application, By Technology, By Deployment, By Enterprise Size, By End Use, By Region, And Segment Forecasts, 2026 - 2033
ITサービス市場 - アプローチ(リアクティブITサービス、プロアクティブITサービス)、タイプ別、用途別、テクノロジー別、導入形態別、企業規模別、エンドユーザー別、地域、セグメント別予測による市場規模、成長と動向分析レポート 2026-2033年
| 出版 | Grand View Research |
| 出版年月 | 2026年02月 |
| ページ数 | 120 |
| 価格 | 記載以外のライセンスについてはお問合せください |
| シングルユーザ | USD 4,950 |
| 種別 | 英文調査報告書 |
| 商品番号 | SMR-16763 |

世界のITサービス市場規模は、2025年には1兆6522億7000万米ドルと推定され、2033年には3兆2997億8000万米ドルに達するとGrand View Researchでは予測しており、2026年から2033年にかけて年平均成長率(CAGR)8.9%で成長すると見込まれています。この市場の成長は、クラウド導入の加速、サイバーセキュリティおよびデータ保護サービスへの需要の高まり、人工知能と自動化の統合の進展、データ分析およびビッグデータプラットフォームの利用拡大、そして業界全体におけるIoTおよびコネクテッドデバイスエコシステムの展開拡大によるものです。
主要市場動向と洞察
- 北米は、2025年までに世界のITサービス市場において35.0%を超える収益シェアを占め、大きなシェアを維持すると予測されています。
- 米国のITサービス市場は北米市場を牽引し、2025年には最大の収益シェアを獲得しました。
- アプローチ別に見ると、リアクティブITサービス分野が市場をリードし、2025年には51.0%を超える最大の収益シェアを獲得しました。
- タイプ別に見ると、運用・保守分野が市場をリードし、2025年には64%を超える最大の収益シェアを獲得しました。
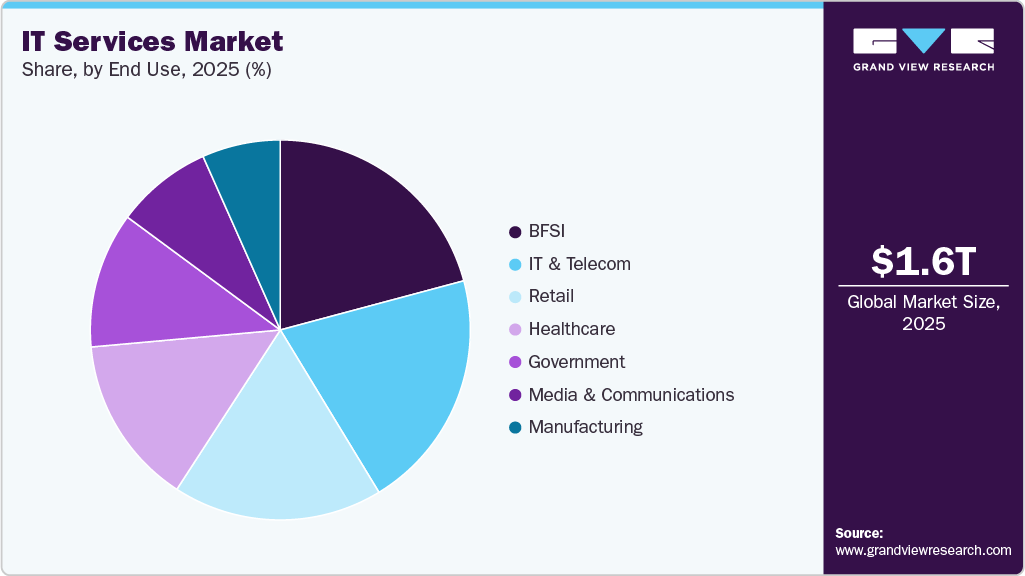
- エンドユーザー別に見ると、小売分野は2026年から2033年にかけて年平均成長率(CAGR)10.7%で最も高い成長率を示すと予測されています。
ITサービス業界は、俊敏性、拡張性、コスト効率の向上を目指すクラウド移行の加速と全社的なデジタルトランスフォーメーションの取り組みによって大きく牽引されています。サイバー脅威の増大と厳格なデータ保護要件により、企業はマネージドセキュリティサービス、リスク管理、コンプライアンス重視のITソリューションへの投資を拡大せざるを得なくなっています。企業は、業務効率の向上、意思決定の最適化、長期的なITコストの削減のために、人工知能、機械学習、自動化を急速に導入しています。データ分析とビッグデータプラットフォームの重要性の高まりは、リアルタイムのインサイト、予測機能、顧客体験の向上を実現する高度なITサービスへの需要を高めています。さらに、業界全体でIoTとコネクテッドデバイスの普及が進むにつれ、統合されたITインフラストラクチャ、ネットワーク管理、エンドツーエンドのサービスサポートの必要性が高まっています。
リモートワークやハイブリッドワークモデルへの移行の加速は、安全なコラボレーション、従業員のモビリティ、拡張性の高いデジタルインフラストラクチャをサポートするITソリューションへの需要を高めています。企業は、業務の柔軟性と事業継続性を確保するために、ワークロードをクラウドプラットフォームに移行するケースが増えており、クラウド管理および最適化サービスへの依存度が高まっています。サイバー脅威の増大とデータ保護に関する懸念の高まりを受け、企業は高度なITサービスを通じてサイバーセキュリティ体制の強化を迫られています。人材の変革、クラウド導入、そしてセキュリティ要件の融合により、企業は外部ITサービスプロバイダーへの依存度を大幅に高めています。結果として、これらの要因はITサービス市場の強力な成長促進要因となっています。
本レポートは、世界、地域、国レベルでの収益成長を予測し、2021年から2033年までの各サブセグメントにおける最新の業界動向を分析しています。本調査において、Grand View Researchは、アプローチ、タイプ、アプリケーション、テクノロジー、展開、企業規模、エンドユーザー、地域に基づいて、世界のITサービス市場レポートをセグメント化しました。
IT Services Market Summary
The global IT services market size was estimated at USD 1,652.27 billion in 2025 and is projected to reach USD 3,299.78 billion by 2033, growing at a CAGR of 8.9% from 2026 to 2033. The market is growing due to accelerated cloud adoption, rising demand for cybersecurity and data protection services, increasing integration of artificial intelligence and automation, expanding use of data analytics and big data platforms, and growing deployment of IoT and connected device ecosystems across industries.
it-services-market-size
Key Market Trends & Insights
- North America is expected to hold a significant share of the global IT services market, with a revenue share of over 35.0% by 2025.
- The IT services market in the U.S. led the North America market and held the largest revenue share in 2025.
- By approach, reactive IT services segment led the market and held the largest revenue share of over 51.0% in 2025.
- By Type, operations & maintenance segment led the market and held the largest revenue share of over 64% in 2025.
- By end use, retail segment is expected to grow at the fastest CAGR of 10.7% from 2026 to 2033.
Market Size & Forecast
- 2025 Market Size: USD 1,652.27 Billion
- 2033 Projected Market Size: USD 3,299.78 Billion
- CAGR (2026-2033): 8.9%
- North America: Largest market in 2025
The IT services industry is being strongly driven by accelerated cloud migration and enterprise-wide digital transformation initiatives aimed at improving agility, scalability, and cost efficiency. Growing cyber threats and stringent data protection requirements are pushing organizations to increase investments in managed security services, risk management, and compliance-driven IT solutions. Enterprises are rapidly adopting artificial intelligence, machine learning, and automation to enhance operational efficiency, optimize decision-making, and reduce long-term IT costs. The rising importance of data analytics and big data platforms is driving demand for advanced IT services that enable real-time insights, predictive capabilities, and improved customer experiences. Moreover, the expanding adoption of IoT and connected devices across industries is increasing the need for integrated IT infrastructure, network management, and end-to-end service support.
The accelerating shift toward remote and hybrid work models is driving demand for IT solutions that support secure collaboration, workforce mobility, and scalable digital infrastructure. Organizations are increasingly migrating workloads to cloud platforms to enable operational flexibility and business continuity, thereby increasing reliance on cloud management and optimization services. Rising cyber threats and growing concerns around data protection are compelling enterprises to strengthen their cybersecurity posture through advanced IT services. This convergence of workforce transformation, cloud adoption, and security requirements is significantly increasing enterprise dependence on external IT service providers. As a result, these factors are acting as a strong growth driver for the IT services market.
The steady rise in IT spending, driven by widespread adoption of software-as-a-service and cloud-based solutions, is accelerating demand for comprehensive IT services. Businesses are leveraging these services to improve operational efficiency while minimizing capital investment in on-premise infrastructure. The shift toward managed and outsourced IT models enables organizations to focus on strategic priorities rather than infrastructure maintenance. IT services are increasingly embedded across business functions, from administrative operations to complex enterprise-wide processes. This expanding role of IT services is expected to sustain robust market growth over the forecast period.
Approach Insights
The reactive IT services segment dominated the market with a share of over 51.0% in 2025, driven by the increasing complexity of IT infrastructures and the difficulty of preventing all system failures in real time. Rising costs associated with downtime and service disruptions have compelled organizations to invest in rapid-response IT solutions to protect productivity and revenue. The growing adoption of cloud-based environments has further accelerated demand by enabling advanced monitoring, alerting, and incident management capabilities. As enterprises prioritize business continuity and risk mitigation, reactive IT services remain a critical component of overall IT operations.
The proactive IT services segment is expected to grow at the fastest CAGR over the forecast period, owing to the rising complexity of IT environments, increasing cybersecurity threats, and the growing need for predictive monitoring and preventive maintenance. Organizations are increasingly adopting proactive services to identify and resolve potential issues before they result in downtime, data loss, or security breaches. These services also support improved IT performance, resource optimization, and greater operational agility. As businesses focus on resilience, compliance, and enhanced customer experience, proactive IT services are becoming a strategic investment for long-term digital stability.
Type Insights
The operations & maintenance segment dominated the IT services market with the largest revenue share in 2025, driven by the growing shift toward cloud-based operations that deliver scalability and cost efficiency. Increased adoption of automation technologies such as robotic process automation (RPA), artificial intelligence, and machine learning has significantly improved operational efficiency and resource utilization. Organizations are also leveraging advanced data analytics to monitor IT system performance, proactively identify issues, and minimize service disruptions. Rising cybersecurity risks have further accelerated investments in robust security and monitoring solutions within operations and maintenance services. Together, these factors continue to reinforce the segment’s leadership as enterprises prioritize resilient, optimized, and continuously available IT environments.
The design & implementation segment is expected to grow at a significant CAGR over the forecast period, supported by rapid technological advancements and rising demand for user-centric digital solutions. Enterprises increasingly rely on IT service providers to design, deploy, and integrate complex IT systems within compressed timelines. The need for faster go-to-market strategies and seamless digital experiences has positioned service providers as strategic partners rather than transactional vendors. As organizations navigate increasingly complex technology ecosystems, demand for specialized design and implementation expertise continues to expand, driving sustained market growth.
Application Insights
The application management segment accounted for the largest revenue share in 2025, as enterprises focus on improving application performance, reliability, and lifecycle value. Application management services enable businesses to optimize performance, reduce the total cost of ownership, and strengthen security across critical applications. Continuous monitoring, maintenance, and optimization help organizations maximize return on application investments while ensuring operational continuity. Additionally, robust application management practices support regulatory compliance and mitigate security vulnerabilities. As applications remain central to digital operations, demand for comprehensive application management services continues to remain strong.
The data management segment is projected to register the fastest CAGR over the forecast period, driven by the exponential growth of data volumes and the need for data-driven decision-making. Enterprises are increasingly adopting cloud-based data management solutions due to their scalability, flexibility, and cost efficiency. Growth opportunities are particularly strong in areas such as big data management, advanced analytics, data governance, and cloud-native data platforms. As organizations seek competitive advantage through actionable insights, demand for sophisticated data management services is expected to accelerate further.
Technology Insights
The AI & machine learning segment dominated the market in 2025, supported by widespread data availability and declining computing costs that make AI solutions more accessible. AI-driven technologies enable enterprises to enhance personalization, automate operations, and improve decision-making through predictive insights. Growing demand for automation across customer service, fraud detection, and predictive maintenance continues to fuel adoption. Increased investment activity further reflects rising confidence in AI-led innovation across industries. As organizations prioritize intelligent automation, AI and ML remain central to IT services growth.
The big data analytics segment is anticipated to grow at a significant CAGR from 2026 to 2033, driven by the rising need for real-time and edge-based analytics. Edge computing enables faster processing by bringing computation closer to data sources, creating new opportunities for analytics-driven IT services. Enterprises increasingly demand real-time insights to respond quickly to market changes and operational challenges. In addition, cloud-based big data analytics solutions continue to gain traction due to their scalability and cost advantages. These trends collectively present strong growth prospects for analytics-focused IT service providers.
Deployment Insights
The cloud segment led the market with the largest revenue share in 2025, as enterprises increasingly adopt cloud-based solutions for disaster recovery, business continuity, and advanced analytics. The growing availability of cloud infrastructure, combined with declining cloud costs, has further accelerated adoption. Enterprises are also embracing hybrid and multi-cloud strategies to enhance flexibility and reduce vendor dependency. Rising demand for cloud-managed services, security solutions, and analytics platforms continues to strengthen the segment. As scalability and efficiency remain top priorities, cloud deployment remains the preferred choice for IT services.
The on-premises segment is expected to grow at a notable CAGR over the forecast period, supported by enterprises seeking greater control, customization, and perceived security. On-premises solutions allow organizations to tailor infrastructure to specific operational and regulatory requirements. Many businesses prefer this model for sensitive workloads where data sovereignty and control are critical. While cloud adoption continues to rise, on-premises deployment remains relevant for organizations prioritizing security, compliance, and infrastructure ownership.
Enterprise Size Insights
The SME segment dominated the market with the largest revenue share in 2025, driven by increasing access to affordable cloud-based IT services. Cloud solutions allow SMEs to adopt advanced technologies without significant upfront infrastructure investments. The growing use of mobile technologies has further enabled SMEs to enhance customer engagement, inventory tracking, and sales management. As digital tools become more accessible, SMEs continue to leverage IT services to improve efficiency and competitiveness.
The large enterprises segment is expected to grow at a significant CAGR, supported by rising IT complexity and large-scale digital transformation initiatives. Large organizations possess the financial capacity and technical resources required to invest in advanced IT services, including cloud, AI, and cybersecurity. Increasing focus on agility, operational efficiency, and customer experience is driving sustained demand from this segment. As a result, large enterprises remain key drivers of innovation and long-term growth in the IT services market.
End Use Insights
The IT & telecom segment dominated the IT services market with the largest revenue share in 2025, supported by strong and sustained investments in digital infrastructure. Telecom operators are increasingly adopting cloud computing, virtualization, and advanced digital technologies to modernize networks and service delivery models. Rising demand for managed services, system integration, and network optimization solutions is further expanding the sector’s contribution to the market. In addition, the convergence of IT and telecom technologies is driving the need for specialized IT services tailored to complex, hybrid network environments. As operators continue to integrate emerging technologies, the IT & telecom segment remains well positioned for sustained growth within the global IT services market.
The retail segment is projected to register the fastest CAGR over the forecast period, driven by the rapid expansion of e-commerce and the widespread adoption of omnichannel retail strategies. Retailers are increasingly investinaccelerating the adoption of IT services across the sector. Solutions such as customer relationship management (CRM) platforms support data-driven engagement and personalized marketing, while advanced inventory management systems enhance visibility and reduce stockout risks. As retailers prioritize efficiency, agility, and customer satisfaction, demand for specialized and scalable IT services tailored to retail-specific requirements continues to surge.
Key IT Services Company Insights
The IT services market features several key players who shape its landscape. Amazon Web Services, Inc. offers comprehensive cloud computing solutions. Microsoft provides cloud, AI, and cybersecurity services through Azure. IBM Corporation specializes in enterprise IT services, including AI and blockchain. Meanwhile, Cisco Systems, Inc. focuses on networking and cybersecurity, helping organizations build secure IT infrastructures. These companies play a significant role in shaping the IT services industry.
- IBM Corporation is a technology firm delivering a comprehensive portfolio of IT services spanning cloud computing, data analytics, artificial intelligence, and consulting. The company provides infrastructure, hosting, and digital transformation services with strong expertise in AI, automation, blockchain, and cybersecurity. IBM supports a wide range of industries, including automotive, banking, healthcare, and retail, by enabling application modernization and operational efficiency. Through its consulting-led approach, IBM helps enterprises adopt advanced technologies to improve agility, resilience, and long-term business performance.
- Microsoft is an IT services provider, with its offerings largely driven by the Azure cloud platform. Microsoft Azure delivers scalable cloud computing, AI, data analytics, and cybersecurity solutions that support enterprise digital transformation initiatives. The company also complements its cloud services with productivity solutions such as Microsoft 365 and digital entertainment platforms, including Xbox. By emphasizing security, scalability, and continuous innovation, Microsoft remains a key competitor and growth driver within the global IT services market.
Key IT Services Companies:
The following key companies have been profiled for this study on the IT services market
- Amazon Web Services, Inc.
- Avaya
- Cisco Systems, Inc.
- DXC Technology Company
- Fortinet, Inc.
- Hewlett Packard Enterprise Development LP
- Huawei Technologies Co., Ltd.
- IBM Corporation
- Juniper Networks, Inc.
- Microsoft
- Broadcom (Symantec Corporation)
- Oracle
Recent Development
- In November 2025, Amdocs entered into a strategic IT services agreement with Fidium to modernize Fidium’s IT operations and accelerate its digital transformation initiatives. Under the agreement, Amdocs will act as a preferred technology and services partner, leveraging its FiberONE platform and advanced automation capabilities to simplify and consolidate Fidium’s IT environment. The engagement is designed to improve operational efficiency, enhance scalability, reduce complexity, and support faster innovation across Fidium’s digital and network operations. This partnership reflects a broader trend in the IT services market, where telecom operators increasingly rely on specialized service providers to enable agile, cost-effective, and customer-centric digital transformation strategies.
- In December 2025, Cognizant entered into a five-year IT services agreement with ERIKS to manage and modernize ERIKS’ operational IT services across its business. As part of this engagement, Cognizant will oversee day-to-day IT operations while driving the transformation of ERIKS’ technology landscape to improve efficiency and resilience. The partnership is aimed at enabling ERIKS to streamline IT processes, enhance scalability, and strengthen its digital capabilities while allowing greater focus on core industrial operations. This agreement underscores the growing reliance of industrial enterprises on long-term IT services partnerships to support digital transformation and sustained operational excellence.
- In March 2025, DXC Technology partnered with Parfois to enhance customer experience through a data-driven IT services engagement. Under this partnership, DXC Technology supports Parfois’ Data Intelligence strategy by enabling advanced analytics, real-time insights, and AI-based customer behavior analysis. The collaboration allows Parfois to centralize customer data, improve decision-making, and deliver more personalized and consistent shopping experiences across channels. This instance highlights how IT services providers are increasingly helping retail brands leverage data platforms to strengthen customer engagement and competitive positioning.
- In March 2025, Amazon Web Services collaborated with enterprises and developers by introducing multi-agent collaboration capabilities within Amazon Bedrock, enabling the orchestration of multiple specialized AI agents for complex workflows. This enhancement allows organizations to design scalable, coordinated agent systems that improve automation efficiency, task execution, and decision-making. The update reinforces Amazon Web Services’s strategy to accelerate enterprise adoption of advanced generative AI solutions.
IT Services Market Report Scope
| Report Attribute | Details |
| Market size value in 2026 | USD 1,814.69 billion |
| Revenue forecast in 2033 | USD 3,299.78 billion |
| Growth Rate | CAGR of 8.9% from 2026 to 2033 |
| Actual data | 2021 – 2025 |
| Forecast period | 2026- 2033 |
| Quantitative units | Revenue in USD billion/million and CAGR from 2026 to 2033 |
| Report coverage | Revenue forecast, company ranking, competitive landscape, growth factors, and trends |
| Segments covered | Approach, type, application, technology, deployment, enterprise size, end use, region |
| Regional scope | North America; Europe; Asia Pacific; Latin America; MEA |
| Country scope | U.S.; Canada; Mexico; Germany; UK; France; China; India; Japan; Australia; South Korea; Brazil; UAE; South Africa; KSA |
| Key companies profiled | Amazon Web Services, Inc.; Avaya; Cisco Systems, Inc.; DXC Technology Company; Fortinet, Inc.; Hewlett Packard Enterprise Development LP; Huawei Technologies Co., Ltd.; IBM Corporation; Juniper Networks, Inc.; Microsoft, Broadcom (Symantec Corporation), Oracle |
| Customization scope | Free report customization (equivalent up to 8 analysts working days) with purchase. Addition or alteration to country, regional & segment scope. |
Global IT Services Market Report Segmentation
This report forecasts revenue growth at global, regional, and country levels and provides an analysis of the latest industry trends in each of the sub-segments from 2021 to 2033. For this study, Grand View Research has segmented the global IT services market report based on approach, type, application, technology, deployment, enterprise size, end use, and region.
- Approach Outlook (Revenue, USD Million, 2021 – 2033)
- Reactive IT Services
- Proactive IT Services
- Type Outlook (Revenue, USD Million, 2021 – 2033)
- Design & Implementation
- Operations & Maintenance
- Application Outlook (Revenue, USD Million, 2021 – 2033)
- Systems & Network Management
- Data Management
- Application Management
- Security & Compliance Management
- Others
- Technology Outlook (Revenue, USD Million, 2021 – 2033)
- AI & Machine Learning
- Big Data Analytics
- Threat Intelligence
- Others
- Deployment Outlook (Revenue, USD Million, 2021 – 2033)
- On-premises
- Cloud
- Enterprise Size Outlook (Revenue, USD Million, 2021 – 2033)
- Small and Medium Enterprises (SMEs)
- Large Enterprises
- End Use Outlook (Revenue, USD Million, 2021 – 2033)
- BFSI
- Government
- Healthcare
- Manufacturing
- Media & Communications
- Retail
- IT & Telecom
- Others
- Regional Outlook (Revenue, USD Million, 2021 – 2033)
- North America
- U.S.
- Canada
- Mexico
- Europe
- UK
- Germany
- France
- Asia Pacific
- China
- Japan
- India
- Australia
- South Korea
- Latin America
- Brazil
- Middle East and Africa (MEA)
- KSA
- UAE
- South Africa
- North America
Table of Contents
Chapter 1. Methodology and Scope
1.1. Market Segmentation and Scope
1.2. Market Definition
1.3. Information Procurement
1.3.1. Purchased Database
1.3.2. GVR’s Internal Database
1.3.3. Secondary Sources and Third-Party Perspectives
1.3.4. Primary Research
1.4. Information Analysis
1.4.1. Data Analysis Models
1.5. Market Formulation and Data Visualization
1.6. Data Validation and Publishing
Chapter 2. Executive Summary
2.1. Market Snapshot
2.2. Segment Snapshot
2.3. Competitive Landscape Snapshot
Chapter 3. IT Services Market Variables, Trends and Scope
3.1. Market Lineage Outlook
3.2. Market Dynamics
3.2.1. Market Driver Analysis
3.2.2. Market Restraint Analysis
3.2.3. Industry Challenge
3.3. Industry Analysis Tools
3.3.1. PORTER’s Analysis
3.3.1.1. Bargaining power of the suppliers
3.3.1.2. Bargaining power of the buyers
3.3.1.3. Threats of substitution
3.3.1.4. Threats from new entrants
3.3.1.5. Competitive rivalry
3.3.2. PESTEL Analysis
3.3.2.1. Political landscape
3.3.2.2. Economic and Social landscape
3.3.2.3. Technological landscape
3.3.2.4. Environmental landscape
3.3.2.5. Legal landscape
Chapter 4. IT Services Market: Approach Estimates and Trend Analysis
4.1. IT Services Market, By Approach: Key Takeaways
4.2. Approach Movement Analysis and Market Share, 2025 and 2033
4.3. Market Estimates and Forecasts, By Approach, 2021 – 2033 (USD Million)
4.3.1. Reactive IT Services
4.3.1.1. Market Revenue Estimates and Forecasts, 2021 – 2033 (USD Million)
4.3.2. Proactive IT Services
4.3.2.1. Market Revenue Estimates and Forecasts, 2021 – 2033(USD Million)
Chapter 5. IT Services Market: Type Estimates and Trend Analysis
5.1. IT Services Market, By Type: Key Takeaways
5.2. Type Movement Analysis and Market Share, 2025 and 2033
5.3. Market Estimates and Forecasts, By Type, 2021 – 2033 (USD Million)
5.3.1. Design & Implementation
5.3.1.1. Market Revenue Estimates and Forecasts, 2021 – 2033 (USD Million)
5.3.2. Operations & Maintenance
5.3.2.1. Market Revenue Estimates and Forecasts, 2021 – 2033 (USD Million)
Chapter 6. IT Services Market: Application Estimates and Trend Analysis
6.1. IT Services Market, By Application: Key Takeaways
6.2. Application Movement Analysis and Market Share, 2025 and 2033
6.3. Market Estimates and Forecasts, By Application, 2021 – 2033 (USD Million)
6.3.1. Systems & Network Management
6.3.1.1. Market Revenue Estimates and Forecasts, 2021 – 2033 (USD Million)
6.3.2. Data Management
6.3.2.1. Market Revenue Estimates and Forecasts, 2021 – 2033 (USD Million)
6.3.3. Application Management
6.3.3.1. Market Revenue Estimates and Forecasts, 2021 – 2033 (USD Million)
6.3.4. Security & Compliance Management
6.3.4.1. Market Revenue Estimates and Forecasts, 2021 – 2033 (USD Million)
6.3.5. Others
6.3.5.1. Market Revenue Estimates and Forecasts, 2021 – 2033 (USD Million)
Chapter 7. IT Services Market: Technology Estimates and Trend Analysis
7.1. IT Services Market, By Technology: Key Takeaways
7.2. Technology Movement Analysis and Market Share, 2025 and 2033
7.3. Market Estimates and Forecasts, By Technology, 2021 – 2033 (USD Million)
7.3.1. AI & Machine Learning
7.3.1.1. Market Revenue Estimates and Forecasts, 2021 – 2033 (USD Million)
7.3.2. Big Data Analytics
7.3.2.1. Market Revenue Estimates and Forecasts, 2021 – 2033 (USD Million)
7.3.3. Threat Intelligence
7.3.3.1. Market Revenue Estimates and Forecasts, 2021 – 2033 (USD Million)
7.3.4. Others
7.3.4.1. Market Revenue Estimates and Forecasts, 2021 – 2033 (USD Million)
Chapter 8. IT Services Market: Deployment Estimates and Trend Analysis
8.1. IT Services Market, By Deployment: Key Takeaways
8.2. Deployment Movement Analysis and Market Share, 2025 and 2033
8.3. Market Estimates and Forecasts, By Deployment, 2021 – 2033 (USD Million)
8.3.1. Cloud
8.3.1.1. Market Revenue Estimates and Forecasts, 2021 – 2033 (USD Million)
8.3.2. On-premises
8.3.2.1. Market Revenue Estimates and Forecasts, 2021 – 2033 (USD Million)
Chapter 9. IT Services Market: Enterprise Size Estimates and Trend Analysis
9.1. IT Services Market, By Enterprise Size: Key Takeaways
9.2. Enterprise Size Movement Analysis and Market Share, 2025 and 2033
9.3. Market Estimates and Forecasts, By Enterprise Size, 2021 – 2033 (USD Million)
9.3.1. Small and Medium Enterprises (SMEs)
9.3.1.1. Market Revenue Estimates and Forecasts, 2021 – 2033 (USD Million)
9.3.2. Large Enterprises
9.3.2.1. Market Revenue Estimates and Forecasts, 2021 – 2033 (USD Million)
Chapter 10. IT Services Market: End Use Estimates and Trend Analysis
10.1. IT Services Market, By End Use: Key Takeaways
10.2. End Use Movement Analysis and Market Share, 2025 and 2033
10.3. Market Estimates and Forecasts, By End Use, 2021 – 2033 (USD Million)
10.3.1. BFSI
10.3.1.1. Market Revenue Estimates and Forecasts, 2021 – 2033 (USD Million)
10.3.2. Government
10.3.2.1. Market Revenue Estimates and Forecasts, 2021 – 2033 (USD Million)
10.3.3. Healthcare
10.3.3.1. Market Revenue Estimates and Forecasts, 2021 – 2033 (USD Million)
10.3.4. Manufacturing
10.3.4.1. Market Revenue Estimates and Forecasts, 2021 – 2033 (USD Million)
10.3.5. Media & Communications
10.3.5.1. Market Revenue Estimates and Forecasts, 2021 – 2033 (USD Million)
10.3.6. Retail
10.3.6.1. Market Revenue Estimates and Forecasts, 2021 – 2033 (USD Million)
10.3.7. IT & Telecom
10.3.7.1. Market Revenue Estimates and Forecasts, 2021 – 2033 (USD Million)
10.3.8. Others
10.3.8.1. Market Revenue Estimates and Forecasts, 2021 – 2033 (USD Million)
Chapter 11. IT Services Market: Regional Estimates and Trend Analysis
11.1. IT Services Market: Regional Outlook
11.2. Regional Marketplaces: Key Takeaways
11.3. Market Estimates and Forecasts, by Region, 2021 – 2033 (USD Million)
11.3.1. North America
11.3.2. North America IT Services Market Estimates and Forecasts, 2021 – 2033 (USD Million)
11.3.3. North America IT Services Market Estimates and Forecasts, by Approach, 2021 – 2033 (USD Million)
11.3.4. North America IT Services Market Estimates and Forecasts, by Type, 2021 – 2033 (USD Million)
11.3.5. North America IT Services Market Estimates and Forecasts, by Application, 2021 – 2033 (USD Million)
11.3.6. North America IT Services Market Estimates and Forecasts, by Technology, 2021 – 2033 (USD Million)
11.3.7. North America IT Services Market Estimates and Forecasts, by Deployment, 2021 – 2033 (USD Million)
11.3.8. North America IT Services Market Estimates and Forecasts, by Enterprise Size, 2021 – 2033 (USD Million)
11.3.9. North America IT Services Market Estimates and Forecasts, by End Use, 2021 – 2033 (USD Million)
11.3.10. U.S.
11.3.10.1. U.S. IT Services Market Estimates and Forecasts, 2021 – 2033 (USD Million)
11.3.10.2. U.S. IT Services Market Estimates and Forecasts, by Approach, 2021 – 2033 (USD Million)
11.3.10.3. U.S. IT Services Market Estimates and Forecasts, by Type, 2021 – 2033 (USD Million)
11.3.10.4. U.S. IT Services Market Estimates and Forecasts, by Application, 2021 – 2033 (USD Million)
11.3.10.5. U.S. IT Services Market Estimates and Forecasts, by Technology, 2021 – 2033 (USD Million)
11.3.10.6. U.S. IT Services Market Estimates and Forecasts, by Deployment, 2021 – 2033 (USD Million)
11.3.10.7. U.S. IT Services Market Estimates and Forecasts, by Enterprise Size, 2021 – 2033 (USD Million)
11.3.10.8. U.S. IT Services Market Estimates and Forecasts, by End Use, 2021 – 2033 (USD Million)
11.3.11. Canada
11.3.11.1. Canada IT Services Market Estimates and Forecasts, 2021 – 2033 (USD Million)
11.3.11.2. Canada IT Services Market Estimates and Forecasts, by Approach, 2021 – 2033 (USD Million)
11.3.11.3. Canada IT Services Market Estimates and Forecasts, by Type, 2021 – 2033 (USD Million)
11.3.11.4. Canada IT Services Market Estimates and Forecasts, by Application, 2021 – 2033 (USD Million)
11.3.11.5. Canada IT Services Market Estimates and Forecasts, by Technology, 2021 – 2033 (USD Million)
11.3.11.6. Canada IT Services Market Estimates and Forecasts, by Deployment, 2021 – 2033 (USD Million)
11.3.11.7. Canada IT Services Market Estimates and Forecasts, by Enterprise Size, 2021 – 2033 (USD Million)
11.3.11.8. Canada IT Services Market Estimates and Forecasts, by End Use, 2021 – 2033 (USD Million)
11.3.12. Mexico
11.3.12.1. Mexico IT Services Market Estimates and Forecasts, 2021 – 2033 (USD Million)
11.3.12.2. Mexico IT Services Market Estimates and Forecasts, by Approach, 2021 – 2033 (USD Million)
11.3.12.3. Mexico IT Services Market Estimates and Forecasts, by Type, 2021 – 2033 (USD Million)
11.3.12.4. Mexico IT Services Market Estimates and Forecasts, by Application, 2021 – 2033 (USD Million)
11.3.12.5. Mexico IT Services Market Estimates and Forecasts, by Technology, 2021 – 2033 (USD Million)
11.3.12.6. Mexico IT Services Market Estimates and Forecasts, by Deployment, 2021 – 2033 (USD Million)
11.3.12.7. Mexico IT Services Market Estimates and Forecasts, by Enterprise Size, 2021 – 2033 (USD Million)
11.3.12.8. Mexico IT Services Market Estimates and Forecasts, by End Use, 2021 – 2033 (USD Million)
11.4. Europe
11.4.1. Europe IT Services Market Estimates and Forecasts, 2021 – 2033 (USD Million)
11.4.2. Europe IT Services Market Estimates and Forecasts, by Approach, 2021 – 2033 (USD Million)
11.4.3. Europe IT Services Market Estimates and Forecasts, by Type, 2021 – 2033 (USD Million)
11.4.4. Europe IT Services Market Estimates and Forecasts, by Application, 2021 – 2033 (USD Million)
11.4.5. Europe IT Services Market Estimates and Forecasts, by Technology, 2021 – 2033 (USD Million)
11.4.6. Europe IT Services Market Estimates and Forecasts, by Deployment, 2021 – 2033 (USD Million)
11.4.7. Europe IT Services Market Estimates and Forecasts, by Enterprise Size, 2021 – 2033 (USD Million)
11.4.8. Europe IT Services Market Estimates and Forecasts, by End Use, 2021 – 2033 (USD Million)
11.4.9. UK
11.4.9.1. UK IT Services Market Estimates and Forecasts, 2021 – 2033 (USD Million)
11.4.9.2. UK IT Services Market Estimates and Forecasts, by Approach, 2021 – 2033 (USD Million)
11.4.9.3. UK IT Services Market Estimates and Forecasts, by Type, 2021 – 2033 (USD Million)
11.4.9.4. UK IT Services Market Estimates and Forecasts, by Application, 2021 – 2033 (USD Million)
11.4.9.5. UK IT Services Market Estimates and Forecasts, by Technology, 2021 – 2033 (USD Million)
11.4.9.6. UK IT Services Market Estimates and Forecasts, by Deployment, 2021 – 2033 (USD Million)
11.4.9.7. UK IT Services Market Estimates and Forecasts, by Enterprise Size, 2021 – 2033 (USD Million)
11.4.9.8. UK IT Services Market Estimates and Forecasts, by End Use, 2021 – 2033 (USD Million)
11.4.10. Germany
11.4.10.1. Germany IT Services Market Estimates and Forecasts, 2021 – 2033 (USD Million)
11.4.10.2. Germany IT Services Market Estimates and Forecasts, by Approach, 2021 – 2033 (USD Million)
11.4.10.3. Germany IT Services Market Estimates and Forecasts, by Type, 2021 – 2033 (USD Million)
11.4.10.4. Germany IT Services Market Estimates and Forecasts, by Application, 2021 – 2033 (USD Million)
11.4.10.5. Germany IT Services Market Estimates and Forecasts, by Technology, 2021 – 2033 (USD Million)
11.4.10.6. Germany IT Services Market Estimates and Forecasts, by Deployment, 2021 – 2033 (USD Million)
11.4.10.7. Germany IT Services Market Estimates and Forecasts, by Enterprise Size, 2021 – 2033 (USD Million)
11.4.10.8. Germany IT Services Market Estimates and Forecasts, by End Use, 2021 – 2033 (USD Million)
11.4.11. France
11.4.11.1. France IT Services Market Estimates and Forecasts, 2021 – 2033 (USD Million)
11.4.11.2. France IT Services Market Estimates and Forecasts, by Approach, 2021 – 2033 (USD Million)
11.4.11.3. France IT Services Market Estimates and Forecasts, by Type, 2021 – 2033 (USD Million)
11.4.11.4. France IT Services Market Estimates and Forecasts, by Application, 2021 – 2033 (USD Million)
11.4.11.5. France IT Services Market Estimates and Forecasts, by Technology, 2021 – 2033 (USD Million)
11.4.11.6. France IT Services Market Estimates and Forecasts, by Deployment, 2021 – 2033 (USD Million)
11.4.11.7. France IT Services Market Estimates and Forecasts, by Enterprise Size, 2021 – 2033 (USD Million)
11.4.11.8. France IT Services Market Estimates and Forecasts, by End Use, 2021 – 2033 (USD Million)
11.5. Asia Pacific
11.5.1. Asia Pacific IT Services Market Estimates and Forecasts, 2021 – 2033 (USD Million)
11.5.2. Asia Pacific IT Services Market Estimates and Forecasts, by Approach, 2021 – 2033 (USD Million)
11.5.3. Asia Pacific IT Services Market Estimates and Forecasts, by Type, 2021 – 2033 (USD Million)
11.5.4. Asia Pacific IT Services Market Estimates and Forecasts, by Application, 2021 – 2033 (USD Million)
11.5.5. Asia Pacific IT Services Market Estimates and Forecasts, by Technology, 2021 – 2033 (USD Million)
11.5.6. Asia Pacific IT Services Market Estimates and Forecasts, by Deployment, 2021 – 2033 (USD Million)
11.5.7. Asia Pacific IT Services Market Estimates and Forecasts, by Enterprise Size, 2021 – 2033 (USD Million)
11.5.8. Asia Pacific IT Services Market Estimates and Forecasts, by End Use, 2021 – 2033 (USD Million)
11.5.9. China
11.5.9.1. China IT Services Market Estimates and Forecasts, 2021 – 2033 (USD Million)
11.5.9.2. China IT Services Market Estimates and Forecasts, by Approach, 2021 – 2033 (USD Million)
11.5.9.3. China IT Services Market Estimates and Forecasts, by Type, 2021 – 2033 (USD Million)
11.5.9.4. China IT Services Market Estimates and Forecasts, by Application, 2021 – 2033 (USD Million)
11.5.9.5. China IT Services Market Estimates and Forecasts, by Technology, 2021 – 2033 (USD Million)
11.5.9.6. China IT Services Market Estimates and Forecasts, by Deployment, 2021 – 2033 (USD Million)
11.5.9.7. China IT Services Market Estimates and Forecasts, by Enterprise Size, 2021 – 2033 (USD Million)
11.5.9.8. China IT Services Market Estimates and Forecasts, by End Use, 2021 – 2033 (USD Million)
11.5.10. Japan
11.5.10.1. Japan IT Services Market Estimates and Forecasts, 2021 – 2033 (USD Million)
11.5.10.2. Japan IT Services Market Estimates and Forecasts, by Approach, 2021 – 2033 (USD Million)
11.5.10.3. Japan IT Services Market Estimates and Forecasts, by Type, 2021 – 2033 (USD Million)
11.5.10.4. Japan IT Services Market Estimates and Forecasts, by Application, 2021 – 2033 (USD Million)
11.5.10.5. Japan IT Services Market Estimates and Forecasts, by Technology, 2021 – 2033 (USD Million)
11.5.10.6. Japan IT Services Market Estimates and Forecasts, by Deployment, 2021 – 2033 (USD Million)
11.5.10.7. Japan IT Services Market Estimates and Forecasts, by Enterprise Size, 2021 – 2033 (USD Million)
11.5.10.8. Japan IT Services Market Estimates and Forecasts, by End Use, 2021 – 2033 (USD Million)
11.5.11. India
11.5.11.1. India IT Services Market Estimates and Forecasts, 2021 – 2033 (USD Million)
11.5.11.2. India IT Services Market Estimates and Forecasts, by Approach, 2021 – 2033 (USD Million)
11.5.11.3. India IT Services Market Estimates and Forecasts, by Type, 2021 – 2033 (USD Million)
11.5.11.4. India IT Services Market Estimates and Forecasts, by Application, 2021 – 2033 (USD Million)
11.5.11.5. India IT Services Market Estimates and Forecasts, by Technology, 2021 – 2033 (USD Million)
11.5.11.6. India IT Services Market Estimates and Forecasts, by Deployment, 2021 – 2033 (USD Million)
11.5.11.7. India IT Services Market Estimates and Forecasts, by Enterprise Size, 2021 – 2033 (USD Million)
11.5.11.8. India IT Services Market Estimates and Forecasts, by End Use, 2021 – 2033 (USD Million)
11.5.12. Australia
11.5.12.1. Australia IT Services Market Estimates and Forecasts, 2021 – 2033 (USD Million)
11.5.12.2. Australia IT Services Market Estimates and Forecasts, by Approach, 2021 – 2033 (USD Million)
11.5.12.3. Australia IT Services Market Estimates and Forecasts, by Type, 2021 – 2033 (USD Million)
11.5.12.4. Australia IT Services Market Estimates and Forecasts, by Application, 2021 – 2033 (USD Million)
11.5.12.5. Australia IT Services Market Estimates and Forecasts, by Technology, 2021 – 2033 (USD Million)
11.5.12.6. Australia IT Services Market Estimates and Forecasts, by Deployment, 2021 – 2033 (USD Million)
11.5.12.7. Australia IT Services Market Estimates and Forecasts, by Enterprise Size, 2021 – 2033 (USD Million)
11.5.12.8. Australia IT Services Market Estimates and Forecasts, by End Use, 2021 – 2033 (USD Million)
11.5.13. South Korea
11.5.13.1. South Korea IT Services Market Estimates and Forecasts, 2021 – 2033 (USD Million)
11.5.13.2. South Korea IT Services Market Estimates and Forecasts, by Approach, 2021 – 2033 (USD Million)
11.5.13.3. South Korea IT Services Market Estimates and Forecasts, by Type, 2021 – 2033 (USD Million)
11.5.13.4. South Korea IT Services Market Estimates and Forecasts, by Application, 2021 – 2033 (USD Million)
11.5.13.5. South Korea IT Services Market Estimates and Forecasts, by Technology, 2021 – 2033 (USD Million)
11.5.13.6. South Korea IT Services Market Estimates and Forecasts, by Deployment, 2021 – 2033 (USD Million)
11.5.13.7. South Korea IT Services Market Estimates and Forecasts, by Enterprise Size, 2021 – 2033 (USD Million)
11.5.13.8. South Korea IT Services Market Estimates and Forecasts, by End Use, 2021 – 2033 (USD Million)
11.6. Latin America
11.6.1. Latin America IT Services Market Estimates and Forecasts, 2021 – 2033 (USD Million)
11.6.2. Latin America IT Services Market Estimates and Forecasts, by Approach, 2021 – 2033 (USD Million)
11.6.3. Latin America IT Services Market Estimates and Forecasts, by Type, 2021 – 2033 (USD Million)
11.6.4. Latin America IT Services Market Estimates and Forecasts, by Application, 2021 – 2033 (USD Million)
11.6.5. Latin America IT Services Market Estimates and Forecasts, by Technology, 2021 – 2033 (USD Million)
11.6.6. Latin America IT Services Market Estimates and Forecasts, by Deployment, 2021 – 2033 (USD Million)
11.6.7. Latin America IT Services Market Estimates and Forecasts, by Enterprise Size, 2021 – 2033 (USD Million)
11.6.8. Latin America IT Services Market Estimates and Forecasts, by End Use, 2021 – 2033 (USD Million)
11.6.9. Brazil
11.6.9.1. Brazil IT Services Market Estimates and Forecasts, 2021 – 2033 (USD Million)
11.6.9.2. Brazil IT Services Market Estimates and Forecasts, by Approach, 2021 – 2033 (USD Million)
11.6.9.3. Brazil IT Services Market Estimates and Forecasts, by Type, 2021 – 2033 (USD Million)
11.6.9.4. Brazil IT Services Market Estimates and Forecasts, by Application, 2021 – 2033 (USD Million)
11.6.9.5. Brazil IT Services Market Estimates and Forecasts, by Technology, 2021 – 2033 (USD Million)
11.6.9.6. Brazil IT Services Market Estimates and Forecasts, by Deployment, 2021 – 2033 (USD Million)
11.6.9.7. Brazil IT Services Market Estimates and Forecasts, by Enterprise Size, 2021 – 2033 (USD Million)
11.6.9.8. Brazil IT Services Market Estimates and Forecasts, by End Use, 2021 – 2033 (USD Million)
11.7. Middle East and Africa
11.7.1. Middle East and Africa IT Services Market Estimates and Forecasts, 2021 – 2033 (USD Million)
11.7.2. Middle East and Africa IT Services Market Estimates and Forecasts, by Approach, 2021 – 2033 (USD Million)
11.7.3. Middle East and Africa IT Services Market Estimates and Forecasts, by Type, 2021 – 2033 (USD Million)
11.7.4. Middle East and Africa IT Services Market Estimates and Forecasts, by Application, 2021 – 2033 (USD Million)
11.7.5. Middle East and Africa IT Services Market Estimates and Forecasts, by Technology, 2021 – 2033 (USD Million)
11.7.6. Middle East and Africa IT Services Market Estimates and Forecasts, by Deployment, 2021 – 2033 (USD Million)
11.7.7. Middle East and Africa IT Services Market Estimates and Forecasts, by Enterprise Size, 2021 – 2033 (USD Million)
11.7.8. Middle East and Africa IT Services Market Estimates and Forecasts, by End Use, 2021 – 2033 (USD Million)
11.7.9. UAE
11.7.9.1. UAE IT Services Market Estimates and Forecasts, 2021 – 2033 (USD Million)
11.7.9.2. UAE IT Services Market Estimates and Forecasts, by Approach, 2021 – 2033 (USD Million)
11.7.9.3. UAE IT Services Market Estimates and Forecasts, by Type, 2021 – 2033 (USD Million)
11.7.9.4. UAE IT Services Market Estimates and Forecasts, by Application, 2021 – 2033 (USD Million)
11.7.9.5. UAE IT Services Market Estimates and Forecasts, by Technology, 2021 – 2033 (USD Million)
11.7.9.6. UAE IT Services Market Estimates and Forecasts, by Deployment, 2021 – 2033 (USD Million)
11.7.9.7. UAE IT Services Market Estimates and Forecasts, by Enterprise Size, 2021 – 2033 (USD Million)
11.7.9.8. UAE IT Services Market Estimates and Forecasts, by End Use, 2021 – 2033 (USD Million)
11.7.10. South Africa
11.7.10.1. South Africa IT Services Market Estimates and Forecasts, 2021 – 2033 (USD Million)
11.7.10.2. South Africa IT Services Market Estimates and Forecasts, by Approach, 2021 – 2033 (USD Million)
11.7.10.3. South Africa IT Services Market Estimates and Forecasts, by Type, 2021 – 2033 (USD Million)
11.7.10.4. South Africa IT Services Market Estimates and Forecasts, by Application, 2021 – 2033 (USD Million)
11.7.10.5. South Africa IT Services Market Estimates and Forecasts, by Technology, 2021 – 2033 (USD Million)
11.7.10.6. South Africa IT Services Market Estimates and Forecasts, by Deployment, 2021 – 2033 (USD Million)
11.7.10.7. South Africa IT Services Market Estimates and Forecasts, by Enterprise Size, 2021 – 2033 (USD Million)
11.7.10.8. South Africa IT Services Market Estimates and Forecasts, by End Use, 2021 – 2033 (USD Million)
11.7.11. KSA
11.7.11.1. KSA IT Services Market Estimates and Forecasts, 2021 – 2033 (USD Million)
11.7.11.2. KSA IT Services Market Estimates and Forecasts, by Approach, 2021 – 2033 (USD Million)
11.7.11.3. KSA IT Services Market Estimates and Forecasts, by Type, 2021 – 2033 (USD Million)
11.7.11.4. KSA IT Services Market Estimates and Forecasts, by Application, 2021 – 2033 (USD Million)
11.7.11.5. KSA IT Services Market Estimates and Forecasts, by Technology, 2021 – 2033 (USD Million)
11.7.11.6. KSA IT Services Market Estimates and Forecasts, by Deployment, 2021 – 2033 (USD Million)
11.7.11.7. KSA IT Services Market Estimates and Forecasts, by Enterprise Size, 2021 – 2033 (USD Million)
11.7.11.8. KSA IT Services Market Estimates and Forecasts, by End Use, 2021 – 2033 (USD Million)
Chapter 12. Competitive Landscape
12.1. Company Categorization
12.2. Company Market Positioning
12.3. Company Heat Map Analysis
12.4. Company Profiles/Listing
12.4.1. Amazon Web Services, Inc.
12.4.1.1. Company Overview
12.4.1.2. Financial Performance
12.4.1.3. Approach Portfolio
12.4.1.4. Recent Developments/ Strategic Initiatives
12.4.2. Avaya
12.4.2.1. Company Overview
12.4.2.2. Financial Performance
12.4.2.3. Approach Portfolio
12.4.2.4. Recent Developments/ Strategic Initiatives
12.4.3. Cisco Systems, Inc.
12.4.3.1. Company Overview
12.4.3.2. Financial Performance
12.4.3.3. Approach Portfolio
12.4.3.4. Recent Developments/ Strategic Initiatives
12.4.4. DXC Technology Company
12.4.4.1. Company Overview
12.4.4.2. Financial Performance
12.4.4.3. Approach Portfolio
12.4.4.4. Recent Developments/ Strategic Initiatives
12.4.5. Fortinet, Inc.
12.4.5.1. Company Overview
12.4.5.2. Financial Performance
12.4.5.3. Approach Portfolio
12.4.5.4. Recent Developments/ Strategic Initiatives
12.4.6. Hewlett Packard Enterprise Development LP
12.4.6.1. Company Overview
12.4.6.2. Financial Performance
12.4.6.3. Approach Portfolio
12.4.6.4. Recent Developments/ Strategic Initiatives
12.4.7. Huawei Technologies Co., Ltd.
12.4.7.1. Company Overview
12.4.7.2. Financial Performance
12.4.7.3. Approach Portfolio
12.4.7.4. Recent Developments/ Strategic Initiatives
12.4.8. IBM Corporation
12.4.8.1. Company Overview
12.4.8.2. Financial Performance
12.4.8.3. Approach Portfolio
12.4.8.4. Recent Developments/ Strategic Initiatives
12.4.9. Juniper Networks, Inc.
12.4.9.1. Company Overview
12.4.9.2. Financial Performance
12.4.9.3. Approach Portfolio
12.4.9.4. Recent Developments/ Strategic Initiatives
12.4.10. Microsoft
12.4.10.1. Company Overview
12.4.10.2. Financial Performance
12.4.10.3. Approach Portfolio
12.4.10.4. Recent Developments/ Strategic Initiatives
12.4.11. Broadcom (Symantec Corporation)
12.4.11.1. Company Overview
12.4.11.2. Financial Performance
12.4.11.3. Approach Portfolio
12.4.11.4. Recent Developments/ Strategic Initiatives
12.4.12. Oracle
12.4.12.1. Company Overview
12.4.12.2. Financial Performance
12.4.12.3. Approach Portfolio
12.4.12.4. Recent Developments/ Strategic Initiatives
List of Tables
Table 1 Global IT services market: Key market driver analysis
Table 2 Global IT services market: Key market restraint analysis
Table 3 Global IT services market estimates and forecast, by approach (USD Million)
Table 4 Global IT services market estimates and forecast, by type (USD Million)
Table 5 Global IT services market estimates and forecast, by application (USD Million)
Table 6 Global IT services market estimates and forecast, by technology (USD Million)
Table 7 Global IT services market estimates and forecast, by deployment (USD Million)
Table 8 Global IT services market estimates and forecast, by enterprise size (USD Million)
Table 9 Global IT services market estimates and forecast, by end use (USD Million)
Table 10 Global IT services market estimates and forecast, by region (USD Million)
Table 11 North America IT services market estimates and forecast, by country, 2021 – 2033 (USD Million)
Table 12 North America IT services market estimates and forecast, by approach, 2021 – 2033 (USD Million)
Table 13 North America IT services market estimates and forecast, by type, 2021 – 2033 (USD Million)
Table 14 North America IT services market estimates and forecast, by application, 2021 – 2033 (USD Million)
Table 15 North America IT services market estimates and forecast, by technology, 2021 – 2033 (USD Million)
Table 16 North America IT services market estimates and forecast, by deployment, 2021 – 2033 (USD Million)
Table 17 North America IT services market estimates and forecast, by enterprise size, 2021 – 2033 (USD Million)
Table 18 North America IT services market estimates and forecast, by end use, 2021 – 2033 (USD Million)
Table 19 U.S. IT services market estimates and forecast, 2021 – 2033 (USD Million)
Table 20 U.S. IT services market estimates and forecast, by approach, 2021 – 2033 (USD Million)
Table 21 U.S. IT services market estimates and forecast, by type, 2021 – 2033 (USD Million)
Table 22 U.S. IT services market estimates and forecast, by application, 2021 – 2033 (USD Million)
Table 23 U.S. IT services market estimates and forecast, by technology, 2021 – 2033 (USD Million)
Table 24 U.S. IT services market estimates and forecast, by deployment, 2021 – 2033 (USD Million)
Table 25 U.S. IT services market estimates and forecast, by enterprise size, 2021 – 2033 (USD Million)
Table 26 U.S. IT services market estimates and forecast, by end use, 2021 – 2033 (USD Million)
Table 27 Canada IT services market estimates and forecast, 2021 – 2033 (USD Million)
Table 28 Canada IT services market estimates and forecast, by approach, 2021 – 2033 (USD Million)
Table 29 Canada IT services market estimates and forecast, by type, 2021 – 2033 (USD Million)
Table 30 Canada IT services market estimates and forecast, by application, 2021 – 2033 (USD Million)
Table 31 Canada IT services market estimates and forecast, by technology, 2021 – 2033 (USD Million)
Table 32 Canada IT services market estimates and forecast, by deployment, 2021 – 2033 (USD Million)
Table 33 Canada IT services market estimates and forecast, by enterprise size, 2021 – 2033 (USD Million)
Table 34 Canada IT services market estimates and forecast, by end use, 2021 – 2033 (USD Million)
Table 35 Mexico IT services market estimates and forecast, 2021 – 2033 (USD Million)
Table 36 Mexico IT services market estimates and forecast, by approach, 2021 – 2033 (USD Million)
Table 37 Mexico IT services market estimates and forecast, by type, 2021 – 2033 (USD Million)
Table 38 Mexico IT services market estimates and forecast, by application, 2021 – 2033 (USD Million)
Table 39 Mexico IT services market estimates and forecast, by technology, 2021 – 2033 (USD Million)
Table 40 Mexico IT services market estimates and forecast, by deployment, 2021 – 2033 (USD Million)
Table 41 Mexico IT services market estimates and forecast, by enterprise size, 2021 – 2033 (USD Million)
Table 42 Mexico IT services market estimates and forecast, by end use, 2021 – 2033 (USD Million)
Table 43 Europe IT services market estimates and forecast, by country, 2021 – 2033 (USD Million)
Table 44 Europe IT services market estimates and forecast, by approach, 2021 – 2033 (USD Million)
Table 45 Europe IT services market estimates and forecast, by type, 2021 – 2033 (USD Million)
Table 46 Europe IT services market estimates and forecast, by application, 2021 – 2033 (USD Million)
Table 47 Europe IT services market estimates and forecast, by technology, 2021 – 2033 (USD Million)
Table 48 Europe IT services market estimates and forecast, by deployment, 2021 – 2033 (USD Million)
Table 49 Europe IT services market estimates and forecast, by enterprise size, 2021 – 2033 (USD Million)
Table 50 Europe IT services market estimates and forecast, by end use, 2021 – 2033 (USD Million)
Table 51 UK IT services market estimates and forecast, 2021 – 2033 (USD Million)
Table 52 UK IT services market estimates and forecast, by approach, 2021 – 2033 (USD Million)
Table 53 UK IT services market estimates and forecast, by type, 2021 – 2033 (USD Million)
Table 54 UK IT services market estimates and forecast, by application, 2021 – 2033 (USD Million)
Table 55 UK IT services market estimates and forecast, by technology, 2021 – 2033 (USD Million)
Table 56 UK IT services market estimates and forecast, by deployment, 2021 – 2033 (USD Million)
Table 57 UK IT services market estimates and forecast, by enterprise size, 2021 – 2033 (USD Million)
Table 58 UK IT services market estimates and forecast, by end use, 2021 – 2033 (USD Million)
Table 59 Germany IT services market estimates and forecast, 2021 – 2033 (USD Million)
Table 60 Germany IT services market estimates and forecast, by approach, 2021 – 2033 (USD Million)
Table 61 Germany IT services market estimates and forecast, by type, 2021 – 2033 (USD Million)
Table 62 Germany IT services market estimates and forecast, by application, 2021 – 2033 (USD Million)
Table 63 Germany IT services market estimates and forecast, by technology, 2021 – 2033 (USD Million)
Table 64 Germany IT services market estimates and forecast, by deployment, 2021 – 2033 (USD Million)
Table 65 Germany IT services market estimates and forecast, by enterprise size, 2021 – 2033 (USD Million)
Table 66 Germany IT services market estimates and forecast, by end use, 2021 – 2033 (USD Million)
Table 67 France IT services market estimates and forecast, 2021 – 2033 (USD Million)
Table 68 France IT services market estimates and forecast, by approach, 2021 – 2033 (USD Million)
Table 69 France IT services market estimates and forecast, by type, 2021 – 2033 (USD Million)
Table 70 France IT services market estimates and forecast, by application, 2021 – 2033 (USD Million)
Table 71 France IT services market estimates and forecast, by technology, 2021 – 2033 (USD Million)
Table 72 France IT services market estimates and forecast, by deployment, 2021 – 2033 (USD Million)
Table 73 France IT services market estimates and forecast, by enterprise size, 2021 – 2033 (USD Million)
Table 74 France IT services market estimates and forecast, by end use, 2021 – 2033 (USD Million)
Table 75 Asia Pacific IT services market estimates and forecast, by country, 2021 – 2033 (USD Million)
Table 76 Asia Pacific IT services market estimates and forecast, by approach, 2021 – 2033 (USD Million)
Table 77 Asia Pacific IT services market estimates and forecast, by type, 2021 – 2033 (USD Million)
Table 78 Asia Pacific IT services market estimates and forecast, by application, 2021 – 2033 (USD Million)
Table 79 Asia Pacific IT services market estimates and forecast, by technology, 2021 – 2033 (USD Million)
Table 80 Asia Pacific IT services market estimates and forecast, by deployment, 2021 – 2033 (USD Million)
Table 81 Asia Pacific IT services market estimates and forecast, by enterprise size, 2021 – 2033 (USD Million)
Table 82 Asia Pacific IT services market estimates and forecast, by end use, 2021 – 2033 (USD Million)
Table 83 China IT services market estimates and forecast, 2021 – 2033 (USD Million)
Table 84 China IT services market estimates and forecast, by approach, 2021 – 2033 (USD Million)
Table 85 China IT services market estimates and forecast, by type, 2021 – 2033 (USD Million)
Table 86 China IT services market estimates and forecast, by application, 2021 – 2033 (USD Million)
Table 87 China IT services market estimates and forecast, by technology, 2021 – 2033 (USD Million)
Table 88 China IT services market estimates and forecast, by deployment, 2021 – 2033 (USD Million)
Table 89 China IT services market estimates and forecast, by enterprise size, 2021 – 2033 (USD Million)
Table 90 China IT services market estimates and forecast, by end use, 2021 – 2033 (USD Million)
Table 91 India IT services market estimates and forecast, 2021 – 2033 (USD Million)
Table 92 India IT services market estimates and forecast, by approach, 2021 – 2033 (USD Million)
Table 93 India IT services market estimates and forecast, by type, 2021 – 2033 (USD Million)
Table 94 India IT services market estimates and forecast, by application, 2021 – 2033 (USD Million)
Table 95 India IT services market estimates and forecast, by technology, 2021 – 2033 (USD Million)
Table 96 India IT services market estimates and forecast, by deployment, 2021 – 2033 (USD Million)
Table 97 India IT services market estimates and forecast, by enterprise size, 2021 – 2033 (USD Million)
Table 98 India IT services market estimates and forecast, by end use, 2021 – 2033 (USD Million)
Table 99 Japan IT services market estimates and forecast, 2021 – 2033 (USD Million)
Table 100 Japan IT services market estimates and forecast, by approach, 2021 – 2033 (USD Million)
Table 101 Japan IT services market estimates and forecast, by type, 2021 – 2033 (USD Million)
Table 102 Japan IT services market estimates and forecast, by application, 2021 – 2033 (USD Million)
Table 103 Japan IT services market estimates and forecast, by technology, 2021 – 2033 (USD Million)
Table 104 Japan IT services market estimates and forecast, by deployment, 2021 – 2033 (USD Million)
Table 105 Japan IT services market estimates and forecast, by enterprise size, 2021 – 2033 (USD Million)
Table 106 Japan IT services market estimates and forecast, by end use, 2021 – 2033 (USD Million)
Table 107 Australia IT services market estimates and forecast, 2021 – 2033 (USD Million)
Table 108 Australia IT services market estimates and forecast, by approach, 2021 – 2033 (USD Million)
Table 109 Australia IT services market estimates and forecast, by type, 2021 – 2033 (USD Million)
Table 110 Australia IT services market estimates and forecast, by application, 2021 – 2033 (USD Million)
Table 111 Australia IT services market estimates and forecast, by technology, 2021 – 2033 (USD Million)
Table 112 Australia IT services market estimates and forecast, by deployment, 2021 – 2033 (USD Million)
Table 113 Australia IT services market estimates and forecast, by enterprise size, 2021 – 2033 (USD Million)
Table 114 Australia IT services market estimates and forecast, by end use, 2021 – 2033 (USD Million)
Table 115 South Korea IT services market estimates and forecast, 2021 – 2033 (USD Million)
Table 116 South Korea IT services market estimates and forecast, by approach, 2021 – 2033 (USD Million)
Table 117 South Korea IT services market estimates and forecast, by type, 2021 – 2033 (USD Million)
Table 118 South Korea IT services market estimates and forecast, by application, 2021 – 2033 (USD Million)
Table 119 South Korea IT services market estimates and forecast, by technology, 2021 – 2033 (USD Million)
Table 120 South Korea IT services market estimates and forecast, by deployment, 2021 – 2033 (USD Million)
Table 121 South Korea IT services market estimates and forecast, by enterprise size, 2021 – 2033 (USD Million)
Table 122 South Korea IT services market estimates and forecast, by end use, 2021 – 2033 (USD Million)
Table 123 Latin America IT services market estimates and forecast, by country, 2021 – 2033 (USD Million)
Table 124 Latin America IT services market estimates and forecast, by approach, 2021 – 2033 (USD Million)
Table 125 Latin America IT services market estimates and forecast, by type, 2021 – 2033 (USD Million)
Table 126 Latin America IT services market estimates and forecast, by application, 2021 – 2033 (USD Million)
Table 127 Latin America IT services market estimates and forecast, by technology, 2021 – 2033 (USD Million)
Table 128 Latin America IT services market estimates and forecast, by deployment, 2021 – 2033 (USD Million)
Table 129 Latin America IT services market estimates and forecast, by enterprise size, 2021 – 2033 (USD Million)
Table 130 Latin America IT services market estimates and forecast, by end use, 2021 – 2033 (USD Million)
Table 131 Brazil IT services market estimates and forecast, 2021 – 2033 (USD Million)
Table 132 Brazil IT services market estimates and forecast, by approach, 2021 – 2033 (USD Million)
Table 133 Brazil IT services market estimates and forecast, by type, 2021 – 2033 (USD Million)
Table 134 Brazil IT services market estimates and forecast, by application, 2021 – 2033 (USD Million)
Table 135 Brazil IT services market estimates and forecast, by technology, 2021 – 2033 (USD Million)
Table 136 Brazil IT services market estimates and forecast, by deployment, 2021 – 2033 (USD Million)
Table 137 Brazil IT services market estimates and forecast, by enterprise size, 2021 – 2033 (USD Million)
Table 138 Brazil IT services market estimates and forecast, by end use, 2021 – 2033 (USD Million)
Table 139 Middle East and Africa IT services market estimates and forecast, by country, 2021 – 2033 (USD Million)
Table 140 Middle East and Africa IT services market estimates and forecast, by approach, 2021 – 2033 (USD Million)
Table 141 Middle East and Africa IT services market estimates and forecast, by type, 2021 – 2033 (USD Million)
Table 142 Middle East and Africa IT services market estimates and forecast, by application, 2021 – 2033 (USD Million)
Table 143 Middle East and Africa IT services market estimates and forecast, by technology, 2021 – 2033 (USD Million)
Table 144 Middle East and Africa IT services market estimates and forecast, by deployment, 2021 – 2033 (USD Million)
Table 145 Middle East and Africa IT services market estimates and forecast, by enterprise size, 2021 – 2033 (USD Million)
Table 146 Middle East and Africa IT services market estimates and forecast, by end use, 2021 – 2033 (USD Million)
Table 147 KSA IT services market estimates and forecast, 2021 – 2033 (USD Million)
Table 148 KSA IT services market estimates and forecast, by approach, 2021 – 2033 (USD Million)
Table 149 KSA IT services market estimates and forecast, by type, 2021 – 2033 (USD Million)
Table 150 KSA IT services market estimates and forecast, by application, 2021 – 2033 (USD Million)
Table 151 KSA IT services market estimates and forecast, by technology, 2021 – 2033 (USD Million)
Table 152 KSA IT services market estimates and forecast, by deployment, 2021 – 2033 (USD Million)
Table 153 KSA IT services market estimates and forecast, by enterprise size, 2021 – 2033 (USD Million)
Table 154 KSA IT services market estimates and forecast, by end use, 2021 – 2033 (USD Million)
Table 155 UAE IT services market estimates and forecast, 2021 – 2033 (USD Million)
Table 156 UAE IT services market estimates and forecast, by approach, 2021 – 2033 (USD Million)
Table 157 UAE IT services market estimates and forecast, by type, 2021 – 2033 (USD Million)
Table 158 UAE IT services market estimates and forecast, by application, 2021 – 2033 (USD Million)
Table 159 UAE IT services market estimates and forecast, by technology, 2021 – 2033 (USD Million)
Table 160 UAE IT services market estimates and forecast, by deployment, 2021 – 2033 (USD Million)
Table 161 UAE IT services market estimates and forecast, by enterprise size, 2021 – 2033 (USD Million)
Table 162 UAE IT services market estimates and forecast, by end use, 2021 – 2033 (USD Million)
Table 163 South Africa IT services market estimates and forecast, 2021 – 2033 (USD Million)
Table 164 South Africa IT services market estimates and forecast, by approach, 2021 – 2033 (USD Million)
Table 165 South Africa IT services market estimates and forecast, by type, 2021 – 2033 (USD Million)
Table 166 South Africa IT services market estimates and forecast, by application, 2021 – 2033 (USD Million)
Table 167 South Africa IT services market estimates and forecast, by technology, 2021 – 2033 (USD Million)
Table 168 South Africa IT services market estimates and forecast, by deployment, 2021 – 2033 (USD Million)
Table 169 South Africa IT services market estimates and forecast, by enterprise size, 2021 – 2033 (USD Million)
Table 170 South Africa IT services market estimates and forecast, by end use, 2021 – 2033 (USD Million)
Table 171 Recent developments and impact analysis, by key market participants
Table 172 Company heat map analysis, 2025
Table 173 Companies implementing key strategies
List of Figures
Fig. 1 IT services market segmentation
Fig. 2 Market research process
Fig. 3 Information procurement
Fig. 4 Primary research pattern
Fig. 5 Market research approaches
Fig. 6 Value chain-based sizing and forecasting
Fig. 7 Parent market analysis
Fig. 8 Market formulation and validation
Fig. 9 IT services market snapshot
Fig. 10 IT services market segment snapshot
Fig. 11 IT services market competitive landscape snapshot
Fig. 12 Market research process
Fig. 13 Market driver relevance analysis (Current and future impact)
Fig. 14 Market restraint relevance analysis (Current and future impact)
Fig. 15 IT services market: Approach outlook key takeaways (USD Million)
Fig. 16 IT services market: Approach movement analysis 2025 & 2033 (USD Million)
Fig. 17 Reactive IT Services market estimates & forecasts, 2021 – 2033 (USD Million)
Fig. 18 Proactive IT Services market estimates & forecasts, 2021 – 2033 (USD Million)
Fig. 19 IT services market: Type outlook key takeaways (USD Million)
Fig. 20 IT services market: Type movement analysis 2025 & 2033 (USD Million)
Fig. 21 Design & Implementation market estimates & forecasts, 2021 – 2033 (USD Million)
Fig. 22 Operations & maintenance market estimates & forecasts, 2021 – 2033 (USD Million)
Fig. 23 IT services market: Application outlook key takeaways (USD Million)
Fig. 24 IT services market: Application movement analysis 2025 & 2033 (USD Million)
Fig. 25 Systems & Network Management market estimates & forecasts, 2021 – 2033 (USD Million)
Fig. 26 Data Management market estimates & forecasts, 2021 – 2033 (USD Million)
Fig. 27 Application Management market estimates & forecasts, 2021 – 2033 (USD Million)
Fig. 28 Security & Compliance Management market estimates & forecasts, 2021 – 2033 (USD Million)
Fig. 29 Others market estimates & forecasts, 2021 – 2033 (USD Million)
Fig. 30 IT services market: Technology outlook key takeaways (USD Million)
Fig. 31 IT services market: Technology movement analysis 2025 & 2033 (USD Million)
Fig. 32 AI & machine learning market estimates & forecasts, 2021 – 2033 (USD Million)
Fig. 33 Big data analytics market estimates & forecasts, 2021 – 2033 (USD Million)
Fig. 34 Threat intelligence market estimates & forecasts, 2021 – 2033 (USD Million)
Fig. 35 Others market estimates & forecasts, 2021 – 2033 (USD Million)
Fig. 36 IT services market: Deployment outlook key takeaways (USD Million)
Fig. 37 IT services market: Deployment movement analysis 2025 & 2033 (USD Million)
Fig. 38 On-premises market estimates & forecasts, 2021 – 2033 (USD Million)
Fig. 39 Cloud market estimates & forecasts, 2021 – 2033 (USD Million)
Fig. 40 IT services market: Enterprise Size outlook key takeaways (USD Million)
Fig. 41 IT services market: Enterprise Size movement analysis 2025 & 2033 (USD Million)
Fig. 42 Small and medium enterprises (SMEs) market estimates & forecasts, 2021 – 2033 (USD Million)
Fig. 43 Large enterprises market estimates & forecasts, 2021 – 2033 (USD Million)
Fig. 44 IT services market: End Use outlook key takeaways (USD Million)
Fig. 45 IT services market: End Use movement analysis 2025 & 2033 (USD Million)
Fig. 46 BFSI market estimates & forecasts, 2021 – 2033 (USD Million)
Fig. 47 Government market estimates & forecasts, 2021 – 2033 (USD Million)
Fig. 48 Healthcare market estimates & forecasts, 2021 – 2033 (USD Million)
Fig. 49 Manufacturing market estimates & forecasts, 2021 – 2033 (USD Million)
Fig. 50 Media & communications market estimates & forecasts, 2021 – 2033 (USD Million)
Fig. 51 Retail market estimates & forecasts, 2021 – 2033 (USD Million)
Fig. 52 IT & telecom market estimates & forecasts, 2021 – 2033 (USD Million)
Fig. 53 Others market estimates & forecasts, 2021 – 2033 (USD Million)
Fig. 54 Regional marketplace: Key takeaways
Fig. 55 North America IT services market estimates and forecast, 2021 – 2033 (USD Million)
Fig. 56 US IT services market estimates and forecast, 2021 – 2033 (USD Million)
Fig. 57 Canada IT services market estimates and forecast, 2021 – 2033 (USD Million)
Fig. 58 Mexico IT services market estimates and forecast, 2021 – 2033 (USD Million)
Fig. 59 Europe IT services market estimates and forecast, 2021 – 2033 (USD Million)
Fig. 60 Germany IT services market estimates and forecast, 2021 – 2033 (USD Million)
Fig. 61 UK IT services market estimates and forecast, 2021 – 2033 (USD Million)
Fig. 62 France IT services market estimates and forecast, 2021 – 2033 (USD Million)
Fig. 63 Asia Pacific IT services market estimates and forecast, 2021 – 2033 (USD Million)
Fig. 64 China IT services market estimates and forecast, 2021 – 2033 (USD Million)
Fig. 65 India IT services market estimates and forecast, 2021 – 2033 (USD Million)
Fig. 66 Japan IT services market estimates and forecast, 2021 – 2033 (USD Million)
Fig. 67 Australia IT services market estimates and forecast, 2021 – 2033 (USD Million)
Fig. 68 South Korea IT services market estimates and forecast, 2021 – 2033 (USD Million)
Fig. 69 Latin America IT services market estimates and forecast, 2021 – 2033 (USD Million)
Fig. 70 Brazil IT services market estimates and forecast, 2021 – 2033 (USD Million)
Fig. 71 Middle East and Africa IT services market estimates and forecast, 2021 – 2033 (USD Million)
Fig. 72 KSA IT services market estimates and forecast, 2021 – 2033 (USD Million)
Fig. 73 UAE IT services market estimates and forecast, 2021 – 2033 (USD Million)
Fig. 74 South Africa IT services market estimates and forecast, 2021 – 2033 (USD Million)
Fig. 75 Strategy framework
Fig. 76 Company categorization