Industrial Air Filtration Market Size, Share & Trends Analysis Report By Product (Fume Collection, HEPA), By Distribution Channel (OEM, Aftermarket), By End-use, By MERV Rating, By Region, And Segment Forecasts, 2026 - 2033
産業用空気ろ過市場 - 製品別(排煙装置、HEPAフィルター)、流通チャネル別(OEM、アフターマーケット)、用途別、MERV定格別、地域、セグメント別予測による市場規模、成長と動向分析レポート 2026-2033年
| 出版 | Grand View Research |
| 出版年月 | 2026年02月 |
| ページ数 | 100 |
| 価格 | 記載以外のライセンスについてはお問合せください |
| シングルユーザ | USD 5,950 |
| 種別 | 英文調査報告書 |
| 商品番号 | SMR-16585 |

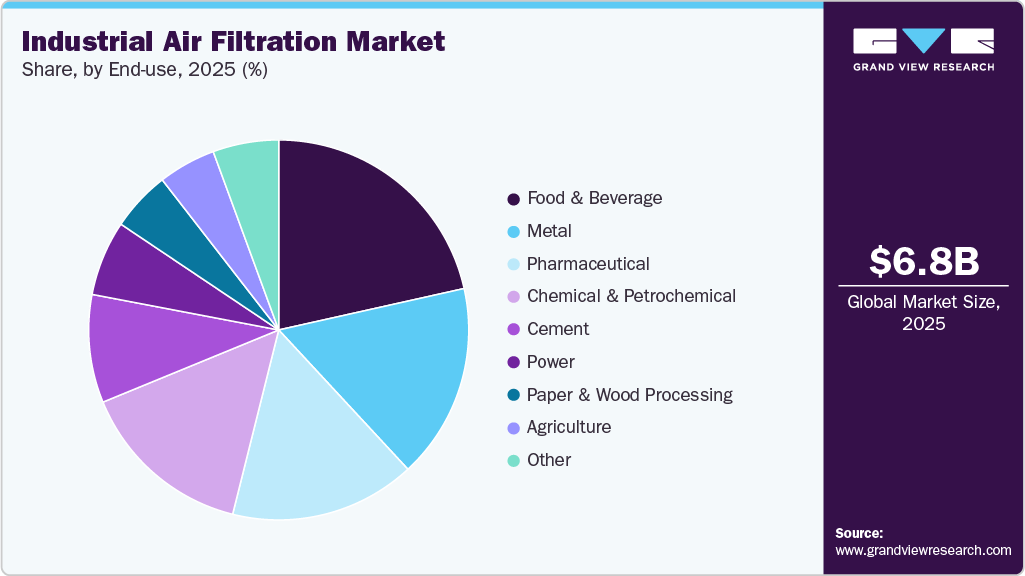
世界の産業用空気ろ過市場規模は、2025年には67億7,880万米ドルと推定され、2033年には107億7,620万米ドルに達すると予測されており、2026年から2033年にかけて年平均成長率(CAGR)6.0%に達するとGrand View Researchでは予測しています。工業化の進展と職場における空気質規制の厳格化が、市場を牽引する主要因となっています。
主要市場動向と洞察
- 北米は、2025年に41.9%という最大の収益シェアを獲得し、産業用空気ろ過市場を牽引しました。
- 米国の産業用空気ろ過市場は、予測期間中に著しい年平均成長率(CAGR)を記録すると予想されています。
- 製品別に見ると、HEPAフィルターセグメントは、2026年から2033年にかけて収益面で6.6%という高いCAGRで成長すると予測されています。
- 流通チャネル別に見ると、アフターマーケットは、2026年から2033年にかけて収益面で6.2%という高いCAGRで成長すると予測されています。
- MERV定格別に見ると、MERV17以上のセグメントは、2026年から2033年にかけて収益面で6.6%という高いCAGRで成長すると予測されています。
政府や安全機関は、労働者の健康と環境を保護するため、粒子状物質の排出規制を強化しています。これにより、製造・加工施設全体に高度なろ過システムを導入する動きが加速しています。
機器の保護と操業効率に対する意識の高まりも、市場の成長をさらに加速させています。効果的な空気ろ過は、産業機械における粉塵の蓄積、腐食、そして予期せぬダウンタイムを低減します。企業は生産性の向上と機器寿命の延長を目指し、信頼性の高いろ過システムへの投資を拡大しています。予防保全とクリーンな生産環境への移行は、長期的な需要を支えています。
Industrial Air Filtration Market Summary
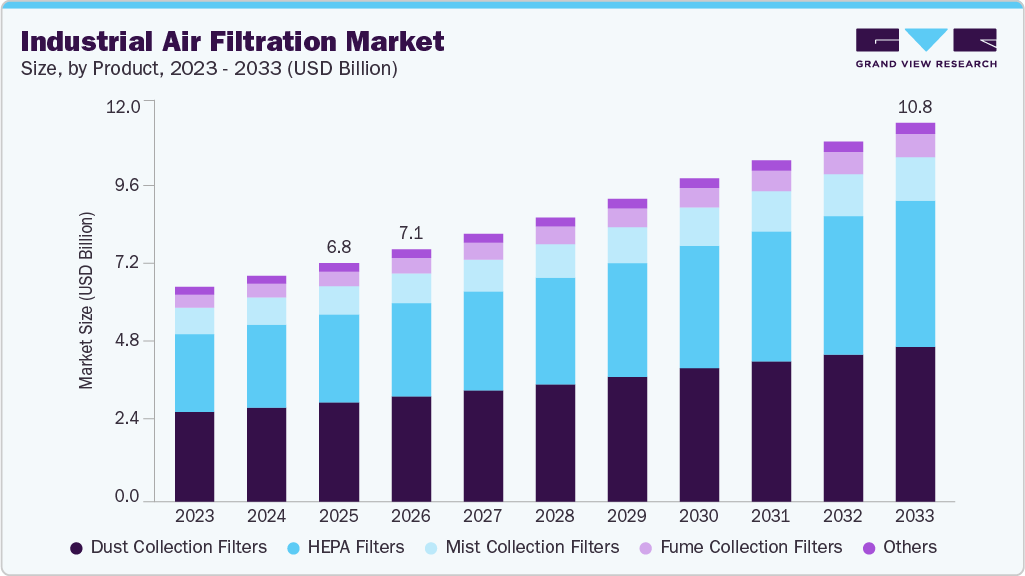
The global industrial air filtration market size was estimated at USD 6,778.8 million in 2025 and is projected to reach USD 10,776.2 million by 2033, growing at a CAGR of 6.0% from 2026 to 2033. Rising industrialization and stricter workplace air quality regulations are key factors driving the market.
industrial-air-filtration-market-size
Key Market Trends & Insights
- North America dominated the industrial air filtration market with the largest revenue share of 41.9% in 2025.
- The industrial air filtration market in the U.S. is expected to register significant CAGR over the forecast period.
- By product, the HEPA filters segment is expected to grow at a considerable CAGR of 6.6% from 2026 to 2033 in terms of revenue.
- By distribution channel, the aftermarket is expected to grow at a considerable CAGR of 6.2% from 2026 to 2033 in terms of revenue.
- By MERV rating, above 17 MERV segment is expected to grow at a considerable CAGR of 6.6% from 2026 to 2033 in terms of revenue.
Market Size & Forecast
- 2025 Market Size: USD 6,778.8 Million
- 2033 Projected Market Size: USD 10,776.2 Million
- CAGR (2026-2033): 6.0%
- North America: Largest market in 2025
- Asia Pacific: Fastest growing region
Governments and safety bodies are enforcing tighter limits on particulate emissions to protect worker health and the environment. This is pushing industries to install advanced filtration systems across manufacturing and processing facilities.
Growing awareness of equipment protection and operational efficiency is further accelerating market growth. Effective air filtration reduces dust buildup, corrosion, and unplanned downtime in industrial machinery. Industries are increasingly investing in reliable filtration to improve productivity and extend equipment life. The shift toward preventive maintenance and cleaner production environments is strengthening long-term demand.
Drivers, Opportunities & Restraints
Rising industrial emissions and stricter workplace air quality standards are major market drivers. Industries are under growing pressure to control dust, fumes, and harmful particulates to ensure regulatory compliance. Expansion of manufacturing, power generation, and process industries is increasing the installed base of filtration systems. Growing focus on worker safety and operational reliability further supports sustained demand.
Increasing adoption of high-efficiency and smart filtration systems presents strong growth opportunities for market players. Demand for customized solutions across pharmaceuticals, food processing, and chemicals is rising due to strict hygiene requirements. Retrofit and replacement of aging filtration infrastructure in mature industrial facilities offer recurring revenue potential. Growth of emerging economies and investments in clean manufacturing are also opening new market avenues.
High initial installation costs of advanced filtration systems remain a key restraint for small and mid-sized industries. Frequent maintenance and filter replacement expenses can add to long-term operational costs. Limited awareness in developing regions about the benefits of high-efficiency filtration slows adoption. In some price-sensitive markets, preference for low-cost alternatives impacts the uptake of premium solutions.
Product Insights
Dust collection filters dominated the market and accounted for a 41.7% share in 2025, due to their extensive use across cement, metal, power, and wood processing industries. These filters effectively captured large volumes of particulate matter generated during heavy industrial operations. Their proven reliability, scalability, and suitability for large production facilities supported widespread adoption. Expansion of dust-intensive industries further strengthened their leading market position.
The HEPA Filters segment is expected to grow at a fastest CAGR of 6.6% from 2026 to 2033 in terms of revenue, driven by increasing demand for ultra-clean air in pharmaceutical, food, and electronics manufacturing. Stricter contamination control and hygiene standards accelerated their adoption. These filters offered high removal efficiency for fine particles and microorganisms. Rising investments in cleanroom and controlled manufacturing environments supported rapid segment growth.
Distribution Channel Insights
The aftermarket segment dominated the market in 2025 and accounted for 78.8% share, due to the continuous need for filter replacement and system maintenance. Industrial facilities relied heavily on regular servicing to maintain filtration efficiency and comply with air quality norms. Aging installed filtration systems increased demand for spare filters and upgrades. The recurring nature of replacement cycles supported a strong aftermarket revenue share.
The OEM segment is expected to grow at a significant CAGR of 5.3% from 2026 to 2033 in terms of revenue, due to the rising installation of new industrial plants and process expansion projects. Equipment manufacturers are increasingly integrating filtration systems into new machinery and production lines. Stricter emission standards encouraged end users to adopt compliant filtration solutions at the installation stage. Growth in industrial automation and greenfield projects further supported OEM channel expansion.
MERV Rating Insights
Above 17 MERV filters dominated the market and accounted for a 36.7% share in 2025, due to their high efficiency in capturing fine and ultra-fine particles. These filters were widely adopted in pharmaceutical, chemical, and clean manufacturing environments with strict air quality requirements. Their ability to meet stringent regulatory and safety standards supported strong demand. Increasing focus on contamination control further reinforced their market leadership.
The 9 to 12 MERV segment is expected to grow at a significant CAGR of 6.4% from 2026 to 2033 in terms of revenue, due to its balance between filtration efficiency and cost-effectiveness. These filters were increasingly used in general manufacturing and food processing facilities. Rising awareness of workplace air quality encouraged upgrades from lower MERV ratings. Their suitability for mid-range industrial applications supported steady growth.
End-use Insights
The food & beverage segment dominated the market and accounted for a 21.5% share in 2025, due to strict hygiene and contamination control requirements. Processing plants relied on effective air filtration to maintain product quality and comply with food safety regulations. High usage of dust, mist, and odor control systems supported consistent demand. Expansion of packaged and processed food production further strengthened segment dominance.
The Pharmaceutical segment is expected to grow at the fastest CAGR of 6.7% from 2025 to 2033 in terms of revenue, due to rising drug manufacturing and stringent cleanroom standards. Air filtration played a critical role in controlling airborne contaminants during production and packaging. Increasing regulatory scrutiny accelerated the adoption of high-efficiency filtration systems. Growth in biopharmaceuticals and contract manufacturing supported rapid segment expansion.
Key Industrial Air Filtration Company Insights
Some of the key players operating in the market include Donaldson Company Inc., Honeywell International Inc., and Daikin Industries, Ltd.
- Donaldson Company Inc. focused strongly on industrial dust, fume, and mist collection solutions across heavy manufacturing sectors. The company emphasized high-efficiency filter media to handle harsh operating conditions and high particulate loads. Its portfolio addressed cement, metalworking, and power generation applications. Continuous investment in cartridge and baghouse technologies improved filtration performance and service life. A strong aftermarket presence supported recurring revenue through replacement filters and system upgrades.
- Honeywell International Inc. strengthened its position through advanced air filtration systems designed for regulated industrial environments. The company leveraged high-performance particulate and gas-phase filtration to support compliance-driven industries. Its solutions are aligned closely with pharmaceutical, chemical, and food processing applications. Focus on integrated building and process safety systems differentiates its offerings. Ongoing innovation supported the adoption of higher MERV and HEPA-grade filtration products.
Key Industrial Air Filtration Companies:
The following key companies have been profiled for this study on the industrial air filtration market.
- MANN+HUMMEL
- Donaldson Company Inc.
- Honeywell International Inc.
- Daikin Industries, Ltd.
- Danaher
- SPX FLOW, Inc.
- Lydall, Inc.
- American Air Filter Company, Inc.
- Industrial Air Filtration, Inc.
- PARKER HANNIFIN CORP
- Camfil
- K&N Engineering
- Freudenberg SE
- Testori Spa
- Eaton
Recent Developments
- In December 2025, Daikin announced an investment of USD 28.6 million to expand its manufacturing operations in Australia to strengthen local production capacity. The expansion supported the growing demand for air handling and ventilation equipment. It also improved supply efficiency for industrial and commercial customers. The move aligned with Daikin’s long-term focus on regional manufacturing and sustainability.
- In September 2024, Donaldson launched filtration services across selected EMEA countries to support industrial manufacturers with system performance and compliance. The services focused on compressed air and process filtration testing, monitoring, and maintenance. This helped end users improve filtration reliability and meet quality standards.
Industrial Air Filtration Market Report Scope
| Report Attribute | Details |
| Market size value in 2026 | USD 7,172.9 million |
| Revenue forecast in 2033 | USD 10,776.2 million |
| Growth rate | CAGR of 6.0% from 2026 to 2033 |
| Historical data | 2021 – 2024 |
| Forecast period | 2026 – 2033 |
| Quantitative units | Revenue in USD million/billion, and CAGR from 2026 to 2033 |
| Report coverage | Revenue forecast, company ranking, competitive landscape, growth factors, and trends |
| Segments covered | Product, distribution channel, MERV rating, application, region |
| Regional scope | North America, Europe, Asia Pacific, CSA, MEA |
| Country scope | U.S.; Canada; Mexico; UK; Germany; France; Italy; China; Japan; India; Australia; Brazil; Argentina; Saudi Arabia; South Africa |
| Key companies profiled | MANN+HUMMEL; Donaldson Company Inc.; Honeywell International Inc.; Daikin Industries, Ltd.; Danaher; SPX FLOW, Inc.; Lydall, Inc.; American Air Filter Company, Inc.; Industrial Air Filtration, Inc.; PARKER HANNIFIN CORP; Camfil; K&N Engineering; Freudenberg SE; Testori Spa; Eaton |
| Customization scope | Free report customization (equivalent up to 8 analysts working days) with purchase. Addition or alteration to country, regional & segment scope. |
Global Industrial Air Filtration Market Report Segmentation
This report forecasts revenue growth at global, regional, and country levels and provides an analysis of the latest industry trends in each of the sub-segments from 2021 to 2033. For this study, Grand View Research has segmented the global industrial air filtration market report based on product, distribution channel, MERV rating, application, and region:
- Product Outlook (Revenue, USD Million, 2021 – 2033)
- Dust Collection Filters
- Cartridge Collectors & Filters
- Baghouse Filters
- Other Filters
- Mist Collection Filters
- Fume Collection Filters
- HEPA Filters
- Others
- Dust Collection Filters
- Distribution Channel Outlook (Revenue, USD Million, 2021 – 2033)
- OEM
- Aftermarket
- MERV Rating Outlook (Revenue, USD Million, 2021 – 2033)
- 1 to 4 MERV
- 5 to 8 MERV
- 9 to 12 MERV
- 13 to 16 MERV
- Above 17 MERV
- End-use Outlook (Revenue, USD Million, 2021 – 2033)
- Cement
- Food & Beverage
- Metal
- Power
- Pharmaceutical
- Chemical & Petrochemical
- Paper & Wood Processing
- Agriculture
- Other
- Regional Outlook (Revenue, USD Million, 2021 – 2033)
- North America
- U.S.
- Canada
- Mexico
- Europe
- Germany
- France
- Italy
- UK
- Asia Pacific
- China
- India
- Japan
- Australia
- Central & South America
- Brazil
- Argentina
- Middle East and Africa
- Saudi Arabia
- South Africa
- North America
Table of Contents
Chapter 1. Methodology and Scope
1.1. Market Segmentation & Scope
1.2. Market Definition
1.3. Information Procurement
1.3.1. Purchased Database
1.3.2. GVR’s Internal Database
1.3.3. Secondary Sources & Third-Party Perspectives
1.3.4. Primary Research
1.4. Information Analysis
1.4.1. Data Analysis Models
1.5. Market Formulation & Data Visualization
1.6. Data Validation & Publishing
Chapter 2. Executive Summary
2.1. Market Snapshot
2.2. Segment Snapshot
2.3. Competitive Landscape Snapshot
Chapter 3. Global Industrial Air Filtration Market Variables, Trends & Scope
3.1. Market Concentration & Growth Prospect Mapping
3.2. Industry Value Chain Analysis
3.2.1. Raw Material/Component Outlook
3.2.2. Manufacturer Outlook
3.2.3. Distribution Outlook
3.2.4. End User Outlook
3.3. Regulatory Framework
3.4. Technology Overview
3.5. Market Dynamics
3.5.1. Market Driver Analysis
3.5.2. Market Restraint Analysis
3.5.3. Market Challenges Analysis
3.5.4. Market Opportunity Analysis
3.6. Economic Mega-Trend Analysis
3.7. Industry Analysis Tools
3.7.1. Porter’s Five Forces Analysis
3.7.2. Macro-environmental Analysis
Chapter 4. Global Industrial Air Filtration Market: Product Estimates & Trend Analysis
4.1. Product Movement Analysis & Market Share, 2025 & 2033
4.2. Global Industrial Air Filtration Market Estimates & Forecast, By Product, 2021 to 2033 (USD Million)
4.3. Dust Collection Filters
4.3.1. Market Revenue Estimates and Forecasts, 2021 – 2033 (USD Million)
4.3.1.1. Cartridge Collectors & Filters
4.3.1.1.1. Market Revenue Estimates and Forecasts, 2021 – 2033 (USD Million)
4.3.1.2. Baghouse Filters
4.3.1.2.1. Market Revenue Estimates and Forecasts, 2021 – 2033 (USD Million)
4.3.1.3. Other Filters
4.3.1.3.1. Market Revenue Estimates and Forecasts, 2021 – 2033 (USD Million)
4.4. Mist Collection Filters
4.4.1. Market Revenue Estimates and Forecasts, 2021 – 2033 (USD Million)
4.5. Fume Collection Filters
4.5.1. Market Revenue Estimates and Forecasts, 2021 – 2033 (USD Million)
4.6. HEPA Filters
4.6.1. Market Revenue Estimates and Forecasts, 2021 – 2033 (USD Million)
4.7. Others
4.7.1. Market Revenue Estimates and Forecasts, 2021 – 2033 (USD Million)
Chapter 5. Global Industrial Air Filtration Market: Distribution Channel Estimates & Trend Analysis
5.1. Distribution Channel Movement Analysis & Market Share, 2025 & 2033
5.2. Global Industrial Air Filtration Market Estimates & Forecast, By Distribution Channel, 2021 to 2033 (USD Million)
5.3. OEM
5.3.1. Market Revenue Estimates and Forecasts, 2021 – 2033 (USD Million)
5.4. Aftermarket
5.4.1. Market Revenue Estimates and Forecasts, 2021 – 2033 (USD Million)
Chapter 6. Global Industrial Air Filtration Market: MERV Rating Estimates & Trend Analysis
6.1. MERV Rating Movement Analysis & Market Share, 2025 & 2033
6.2. Global Industrial Air Filtration Market Estimates & Forecast, By MERV Rating, 2021 to 2033 (USD Million)
6.3. 1 to 4 MERV
6.3.1. Market Revenue Estimates and Forecasts, 2021 – 2033 (USD Million)
6.4. 5 to 8 MERV
6.4.1. Market Revenue Estimates and Forecasts, 2021 – 2033 (USD Million)
6.5. 9 to 12 MERV
6.5.1. Market Revenue Estimates and Forecasts, 2021 – 2033 (USD Million)
6.6. 13 to 16 MERV
6.6.1. Market Revenue Estimates and Forecasts, 2021 – 2033 (USD Million)
6.7. Above 17 MERV
6.7.1. Market Revenue Estimates and Forecasts, 2021 – 2033 (USD Million)
Chapter 7. Global Industrial Air Filtration Market: End Use Estimates & Trend Analysis
7.1. End Use Movement Analysis & Market Share, 2025 & 2033
7.2. Global Industrial Air Filtration Market Estimates & Forecast, By End Use, 2021 to 2033 (USD Million)
7.3. Cement
7.3.1. Market Revenue Estimates and Forecasts, 2021 – 2033 (USD Million)
7.4. Food & Beverage
7.4.1. Market Revenue Estimates and Forecasts, 2021 – 2033 (USD Million)
7.5. Metal
7.5.1. Market Revenue Estimates and Forecasts, 2021 – 2033 (USD Million)
7.6. Power
7.6.1. Market Revenue Estimates and Forecasts, 2021 – 2033 (USD Million)
7.7. Pharmaceutical
7.7.1. Market Revenue Estimates and Forecasts, 2021 – 2033 (USD Million)
7.8. Chemical & Petrochemical
7.8.1. Market Revenue Estimates and Forecasts, 2021 – 2033 (USD Million)
7.9. Paper & Wood Processing
7.9.1. Market Revenue Estimates and Forecasts, 2021 – 2033 (USD Million)
7.10. Agriculture
7.10.1. Market Revenue Estimates and Forecasts, 2021 – 2033 (USD Million)
7.11. Others
7.11.1. Market Revenue Estimates and Forecasts, 2021 – 2033 (USD Million)
Chapter 8. Global Industrial Air Filtration Market: Regional Estimates & Trend Analysis
8.1. Regional Movement Analysis & Market Share, 2025 & 2033
8.2. North America
8.2.1. Market Estimates & Forecast, 2021 – 2033 (USD Million)
8.2.2. Market estimates & forecast, by product, 2021 – 2033 (USD Million)
8.2.3. Market estimates & forecast, by distribution channel, 2021 – 2033 (USD Million)
8.2.4. Market estimates & forecast, by MERV rating, 2021 – 2033 (USD Million)
8.2.5. Market estimates & forecast, by application, 2021 – 2033 (USD Million)
8.2.6. U.S.
8.2.6.1. Key country dynamics
8.2.6.2. Market Estimates & Forecast, 2021 – 2033 (USD Million)
8.2.6.3. Market estimates & forecast, by product, 2021 – 2033 (USD Million)
8.2.6.4. Market estimates & forecast, by distribution channel, 2021 – 2033 (USD Million)
8.2.6.5. Market estimates & forecast, by MERV rating, 2021 – 2033 (USD Million)
8.2.6.6. Market estimates & forecast, by application, 2021 – 2033 (USD Million)
8.2.7. Canada
8.2.7.1. Key country dynamics
8.2.7.2. Market Estimates & Forecast, 2021 – 2033 (USD Million)
8.2.7.3. Market estimates & forecast, by product, 2021 – 2033 (USD Million)
8.2.7.4. Market estimates & forecast, by distribution channel, 2021 – 2033 (USD Million)
8.2.7.5. Market estimates & forecast, by MERV rating, 2021 – 2033 (USD Million)
8.2.7.6. Market estimates & forecast, by application, 2021 – 2033 (USD Million)
8.2.8. Mexico
8.2.8.1. Key country dynamics
8.2.8.2. Market Estimates & Forecast, 2021 – 2033 (USD Million)
8.2.8.3. Market estimates & forecast, by product, 2021 – 2033 (USD Million)
8.2.8.4. Market estimates & forecast, by distribution channel, 2021 – 2033 (USD Million)
8.2.8.5. Market estimates & forecast, by MERV rating, 2021 – 2033 (USD Million)
8.2.8.6. Market estimates & forecast, by application, 2021 – 2033 (USD Million)
8.3. Europe
8.3.1. Market Estimates & Forecast, 2021 – 2033 (USD Million)
8.3.2. Market estimates & forecast, by product, 2021 – 2033 (USD Million)
8.3.3. Market estimates & forecast, by distribution channel, 2021 – 2033 (USD Million)
8.3.4. Market estimates & forecast, by MERV rating, 2021 – 2033 (USD Million)
8.3.5. Market estimates & forecast, by application, 2021 – 2033 (USD Million)
8.3.6. Germany
8.3.6.1. Key country dynamics
8.3.6.2. Market Estimates & Forecast, 2021 – 2033 (USD Million)
8.3.6.3. Market estimates & forecast, by product, 2021 – 2033 (USD Million)
8.3.6.4. Market estimates & forecast, by distribution channel, 2021 – 2033 (USD Million)
8.3.6.5. Market estimates & forecast, by MERV rating, 2021 – 2033 (USD Million)
8.3.6.6. Market estimates & forecast, by application, 2021 – 2033 (USD Million)
8.3.7. France
8.3.7.1. Key country dynamics
8.3.7.2. Market Estimates & Forecast, 2021 – 2033 (USD Million)
8.3.7.3. Market estimates & forecast, by product, 2021 – 2033 (USD Million)
8.3.7.4. Market estimates & forecast, by distribution channel, 2021 – 2033 (USD Million)
8.3.7.5. Market estimates & forecast, by MERV rating, 2021 – 2033 (USD Million)
8.3.7.6. Market estimates & forecast, by application, 2021 – 2033 (USD Million)
8.3.8. UK
8.3.8.1. Key country dynamics
8.3.8.2. Market Estimates & Forecast, 2021 – 2033 (USD Million)
8.3.8.3. Market estimates & forecast, by product, 2021 – 2033 (USD Million)
8.3.8.4. Market estimates & forecast, by distribution channel, 2021 – 2033 (USD Million)
8.3.8.5. Market estimates & forecast, by MERV rating, 2021 – 2033 (USD Million)
8.3.8.6. Market estimates & forecast, by application, 2021 – 2033 (USD Million)
8.3.9. Italy
8.3.9.1. Key country dynamics
8.3.9.2. Market Estimates & Forecast, 2021 – 2033 (USD Million)
8.3.9.3. Market estimates & forecast, by product, 2021 – 2033 (USD Million)
8.3.9.4. Market estimates & forecast, by distribution channel, 2021 – 2033 (USD Million)
8.3.9.5. Market estimates & forecast, by MERV rating, 2021 – 2033 (USD Million)
8.3.9.6. Market estimates & forecast, by application, 2021 – 2033 (USD Million)
8.4. Asia Pacific
8.4.1. Market Estimates & Forecast, 2021 – 2033 (USD Million)
8.4.2. Market estimates & forecast, by product, 2021 – 2033 (USD Million)
8.4.3. Market estimates & forecast, by distribution channel, 2021 – 2033 (USD Million)
8.4.4. Market estimates & forecast, by MERV rating, 2021 – 2033 (USD Million)
8.4.5. Market estimates & forecast, by application, 2021 – 2033 (USD Million)
8.4.6. China
8.4.6.1. Key country dynamics
8.4.6.2. Market Estimates & Forecast, 2021 – 2033 (USD Million)
8.4.6.3. Market estimates & forecast, by product, 2021 – 2033 (USD Million)
8.4.6.4. Market estimates & forecast, by distribution channel, 2021 – 2033 (USD Million)
8.4.6.5. Market estimates & forecast, by MERV rating, 2021 – 2033 (USD Million)
8.4.6.6. Market estimates & forecast, by application, 2021 – 2033 (USD Million)
8.4.7. India
8.4.7.1. Key country dynamics
8.4.7.2. Market Estimates & Forecast, 2021 – 2033 (USD Million)
8.4.7.3. Market estimates & forecast, by product, 2021 – 2033 (USD Million)
8.4.7.4. Market estimates & forecast, by distribution channel, 2021 – 2033 (USD Million)
8.4.7.5. Market estimates & forecast, by MERV rating, 2021 – 2033 (USD Million)
8.4.7.6. Market estimates & forecast, by application, 2021 – 2033 (USD Million)
8.4.8. Japan
8.4.8.1. Key country dynamics
8.4.8.2. Market Estimates & Forecast, 2021 – 2033 (USD Million)
8.4.8.3. Market estimates & forecast, by product, 2021 – 2033 (USD Million)
8.4.8.4. Market estimates & forecast, by distribution channel, 2021 – 2033 (USD Million)
8.4.8.5. Market estimates & forecast, by MERV rating, 2021 – 2033 (USD Million)
8.4.8.6. Market estimates & forecast, by application, 2021 – 2033 (USD Million)
8.4.9. Australia
8.4.9.1. Key country dynamics
8.4.9.2. Market Estimates & Forecast, 2021 – 2033 (USD Million)
8.4.9.3. Market estimates & forecast, by product, 2021 – 2033 (USD Million)
8.4.9.4. Market estimates & forecast, by distribution channel, 2021 – 2033 (USD Million)
8.4.9.5. Market estimates & forecast, by MERV rating, 2021 – 2033 (USD Million)
8.4.9.6. Market estimates & forecast, by application, 2021 – 2033 (USD Million)
8.5. Central & South America
8.5.1. Market Estimates & Forecast, 2021 – 2033 (USD Million)
8.5.2. Market estimates & forecast, by product, 2021 – 2033 (USD Million)
8.5.3. Market estimates & forecast, by distribution channel, 2021 – 2033 (USD Million)
8.5.4. Market estimates & forecast, by MERV rating, 2021 – 2033 (USD Million)
8.5.5. Market estimates & forecast, by application, 2021 – 2033 (USD Million)
8.5.6. Brazil
8.5.6.1. Key country dynamics
8.5.6.2. Market Estimates & Forecast, 2021 – 2033 (USD Million)
8.5.6.3. Market estimates & forecast, by product, 2021 – 2033 (USD Million)
8.5.6.4. Market estimates & forecast, by distribution channel, 2021 – 2033 (USD Million)
8.5.6.5. Market estimates & forecast, by MERV rating, 2021 – 2033 (USD Million)
8.5.6.6. Market estimates & forecast, by application, 2021 – 2033 (USD Million)
8.5.7. Argentina
8.5.7.1. Key country dynamics
8.5.7.2. Market Estimates & Forecast, 2021 – 2033 (USD Million)
8.5.7.3. Market estimates & forecast, by product, 2021 – 2033 (USD Million)
8.5.7.4. Market estimates & forecast, by distribution channel, 2021 – 2033 (USD Million)
8.5.7.5. Market estimates & forecast, by MERV rating, 2021 – 2033 (USD Million)
8.5.7.6. Market estimates & forecast, by application, 2021 – 2033 (USD Million)
8.6. Middle East & Africa
8.6.1. Market Estimates & Forecast, 2021 – 2033 (USD Million)
8.6.2. Market estimates & forecast, by product, 2021 – 2033 (USD Million)
8.6.3. Market estimates & forecast, by distribution channel, 2021 – 2033 (USD Million)
8.6.4. Market estimates & forecast, by MERV rating, 2021 – 2033 (USD Million)
8.6.5. Market estimates & forecast, by application, 2021 – 2033 (USD Million)
8.6.6. Saudi Arabia
8.6.6.1. Key country dynamics
8.6.6.2. Market Estimates & Forecast, 2021 – 2033 (USD Million)
8.6.6.3. Market estimates & forecast, by product, 2021 – 2033 (USD Million)
8.6.6.4. Market estimates & forecast, by distribution channel, 2021 – 2033 (USD Million)
8.6.6.5. Market estimates & forecast, by MERV rating, 2021 – 2033 (USD Million)
8.6.6.6. Market estimates & forecast, by application, 2021 – 2033 (USD Million)
8.6.7. South Africa
8.6.7.1. Key country dynamics
8.6.7.2. Market Estimates & Forecast, 2021 – 2033 (USD Million)
8.6.7.3. Market estimates & forecast, by product, 2021 – 2033 (USD Million)
8.6.7.4. Market estimates & forecast, by distribution channel, 2021 – 2033 (USD Million)
8.6.7.5. Market estimates & forecast, by MERV rating, 2021 – 2033 (USD Million)
8.6.7.6. Market estimates & forecast, by application, 2021 – 2033 (USD Million)
Chapter 9. Global Industrial Air Filtration Market – Competitive Landscape
9.1. Recent Developments & Impact Analysis, By Key Market Participants
9.2. Company Categorization
9.3. Company Dashboard Analysis
9.4. Company Market Share Analysis, 2025
9.5. Company Positioning Analysis, 2025
9.6. Company Heat Map Analysis, 2025
9.7. Strategy Mapping
9.8. Company Profiles
9.8.1. MANN+HUMMEL
9.8.1.1. Participant’s overview
9.8.1.2. Financial performance
9.8.1.3. Product benchmarking
9.8.1.4. Recent developments
9.8.2. Donaldson Company Inc.
9.8.2.1. Participant’s overview
9.8.2.2. Financial performance
9.8.2.3. Product benchmarking
9.8.2.4. Recent developments
9.8.3. Honeywell International Inc.
9.8.3.1. Participant’s overview
9.8.3.2. Financial performance
9.8.3.3. Product benchmarking
9.8.3.4. Recent developments
9.8.4. Daikin Industries, Ltd.
9.8.4.1. Participant’s overview
9.8.4.2. Financial performance
9.8.4.3. Product benchmarking
9.8.4.4. Recent developments
9.8.5. Danaher
9.8.5.1. Participant’s overview
9.8.5.2. Financial performance
9.8.5.3. Product benchmarking
9.8.5.4. Recent developments
9.8.6. SPX FLOW, Inc.
9.8.6.1. Participant’s overview
9.8.6.2. Financial performance
9.8.6.3. Product benchmarking
9.8.6.4. Recent developments
9.8.7. Lydall, Inc.
9.8.7.1. Participant’s overview
9.8.7.2. Financial performance
9.8.7.3. Product benchmarking
9.8.7.4. Recent developments
9.8.8. American Air Filter Company, Inc.
9.8.8.1. Participant’s overview
9.8.8.2. Financial performance
9.8.8.3. Product benchmarking
9.8.8.4. Recent developments
9.8.9. Industrial Air Filtration, Inc.
9.8.9.1. Participant’s overview
9.8.9.2. Financial performance
9.8.9.3. Product benchmarking
9.8.9.4. Recent developments
9.8.10. PARKER HANNIFIN CORP
9.8.10.1. Participant’s overview
9.8.10.2. Financial performance
9.8.10.3. Product benchmarking
9.8.10.4. Recent developments
9.8.11. Camfil
9.8.11.1. Participant’s overview
9.8.11.2. Financial performance
9.8.11.3. Product benchmarking
9.8.11.4. Recent developments
9.8.12. K&N Engineering
9.8.12.1. Participant’s overview
9.8.12.2. Financial performance
9.8.12.3. Product benchmarking
9.8.12.4. Recent developments
9.8.13. Freudenberg SE
9.8.13.1. Participant’s overview
9.8.13.2. Financial performance
9.8.13.3. Product benchmarking
9.8.13.4. Recent developments
9.8.14. Testori Spa
9.8.14.1. Participant’s overview
9.8.14.2. Financial performance
9.8.14.3. Product benchmarking
9.8.14.4. Recent developments
9.8.15. Eaton
9.8.15.1. Participant’s overview
9.8.15.2. Financial performance
9.8.15.3. Product benchmarking
9.8.15.4. Recent developments
List of Tables
Table 1 Global industrial air filtration market estimates and forecasts, 2021 – 2033 (USD Million)
Table 2 Global industrial air filtration market estimates and forecasts, by product, 2021 – 2033 (USD Million)
Table 3 Global industrial air filtration market estimates and forecasts, by distribution channel, 2021 – 2033 (USD Million)
Table 4 Global industrial air filtration market estimates and forecasts, by MERV rating, 2021 – 2033 (USD Million)
Table 5 Global industrial air filtration market estimates and forecasts, by application, 2021 – 2033 (USD Million)
Table 6 Global industrial air filtration market estimates and forecasts, by region, 2021 – 2033 (USD Million)
Table 7 North America industrial air filtration market estimates and forecasts, 2021 – 2033 (USD Million)
Table 8 North America industrial air filtration market estimates and forecasts, by product, 2021 – 2033 (USD Million)
Table 9 North America industrial air filtration market estimates and forecasts, by distribution channel, 2021 – 2033 (USD Million)
Table 10 North America industrial air filtration market estimates and forecasts, by MERV rating, 2021 – 2033 (USD Million)
Table 11 North America industrial air filtration market estimates and forecasts, by application, 2021 – 2033 (USD Million)
Table 12 U.S. industrial air filtration market estimates and forecasts, 2021 – 2033 (USD Million)
Table 13 U.S. industrial air filtration market estimates and forecasts, by product, 2021 – 2033 (USD Million)
Table 14 U.S. industrial air filtration market estimates and forecasts, by distribution channel, 2021 – 2033 (USD Million)
Table 15 U.S. industrial air filtration market estimates and forecasts, by MERV rating, 2021 – 2033 (USD Million)
Table 16 U.S. industrial air filtration market estimates and forecasts, by application, 2021 – 2033 (USD Million)
Table 17 Canada industrial air filtration market estimates and forecasts, 2021 – 2033 (USD Million)
Table 18 Canada industrial air filtration market estimates and forecasts, by product, 2021 – 2033 (USD Million)
Table 19 Canada industrial air filtration market estimates and forecasts, by distribution channel, 2021 – 2033 (USD Million)
Table 20 Canada industrial air filtration market estimates and forecasts, by MERV rating, 2021 – 2033 (USD Million)
Table 21 Canada industrial air filtration market estimates and forecasts, by application, 2021 – 2033 (USD Million)
Table 22 Mexico industrial air filtration market estimates and forecasts, 2021 – 2033 (USD Million)
Table 23 Mexico industrial air filtration market estimates and forecasts, by product, 2021 – 2033 (USD Million)
Table 24 Mexico industrial air filtration market estimates and forecasts, by distribution channel, 2021 – 2033 (USD Million)
Table 25 Mexico industrial air filtration market estimates and forecasts, by MERV rating, 2021 – 2033 (USD Million)
Table 26 Mexico industrial air filtration market estimates and forecasts, by application, 2021 – 2033 (USD Million)
Table 27 Europe industrial air filtration market estimates and forecasts, 2021 – 2033 (USD Million)
Table 28 Europe industrial air filtration market estimates and forecasts, by product, 2021 – 2033 (USD Million)
Table 29 Europe industrial air filtration market estimates and forecasts, by distribution channel, 2021 – 2033 (USD Million)
Table 30 Europe industrial air filtration market estimates and forecasts, by MERV rating, 2021 – 2033 (USD Million)
Table 31 Europe industrial air filtration market estimates and forecasts, by application, 2021 – 2033 (USD Million)
Table 32 Germany industrial air filtration market estimates and forecasts, 2021 – 2033 (USD Million)
Table 33 Germany industrial air filtration market estimates and forecasts, by product, 2021 – 2033 (USD Million)
Table 34 Germany industrial air filtration market estimates and forecasts, by distribution channel, 2021 – 2033 (USD Million)
Table 35 Germany industrial air filtration market estimates and forecasts, by MERV rating, 2021 – 2033 (USD Million)
Table 36 Germany industrial air filtration market estimates and forecasts, by application, 2021 – 2033 (USD Million)
Table 37 France industrial air filtration market estimates and forecasts, 2021 – 2033 (USD Million)
Table 38 France industrial air filtration market estimates and forecasts, by product, 2021 – 2033 (USD Million)
Table 39 France industrial air filtration market estimates and forecasts, by distribution channel, 2021 – 2033 (USD Million)
Table 40 France industrial air filtration market estimates and forecasts, by MERV rating, 2021 – 2033 (USD Million)
Table 41 France industrial air filtration market estimates and forecasts, by application, 2021 – 2033 (USD Million)
Table 42 Italy industrial air filtration market estimates and forecasts, 2021 – 2033 (USD Million)
Table 43 Italy industrial air filtration market estimates and forecasts, by product, 2021 – 2033 (USD Million)
Table 44 Italy industrial air filtration market estimates and forecasts, by distribution channel, 2021 – 2033 (USD Million)
Table 45 Italy industrial air filtration market estimates and forecasts, by MERV rating, 2021 – 2033 (USD Million)
Table 46 Italy industrial air filtration market estimates and forecasts, by application, 2021 – 2033 (USD Million)
Table 47 UK industrial air filtration market estimates and forecasts, 2021 – 2033 (USD Million)
Table 48 UK industrial air filtration market estimates and forecasts, by product, 2021 – 2033 (USD Million)
Table 49 UK industrial air filtration market estimates and forecasts, by distribution channel, 2021 – 2033 (USD Million)
Table 50 UK industrial air filtration market estimates and forecasts, by MERV rating, 2021 – 2033 (USD Million)
Table 51 UK industrial air filtration market estimates and forecasts, by application, 2021 – 2033 (USD Million)
Table 52 Asia Pacific industrial air filtration market estimates and forecasts, 2021 – 2033 (USD Million)
Table 53 Asia Pacific industrial air filtration market estimates and forecasts, by product, 2021 – 2033 (USD Million)
Table 54 Asia Pacific industrial air filtration market estimates and forecasts, by distribution channel, 2021 – 2033 (USD Million)
Table 55 Asia Pacific industrial air filtration market estimates and forecasts, by MERV rating, 2021 – 2033 (USD Million)
Table 56 Asia Pacific industrial air filtration market estimates and forecasts, by application, 2021 – 2033 (USD Million)
Table 57 China industrial air filtration market estimates and forecasts, 2021 – 2033 (USD Million)
Table 58 China industrial air filtration market estimates and forecasts, by product, 2021 – 2033 (USD Million)
Table 59 China industrial air filtration market estimates and forecasts, by distribution channel, 2021 – 2033 (USD Million)
Table 60 China industrial air filtration market estimates and forecasts, by MERV rating, 2021 – 2033 (USD Million)
Table 61 China industrial air filtration market estimates and forecasts, by application, 2021 – 2033 (USD Million)
Table 62 India industrial air filtration market estimates and forecasts, 2021 – 2033 (USD Million)
Table 63 India industrial air filtration market estimates and forecasts, by product, 2021 – 2033 (USD Million)
Table 64 India industrial air filtration market estimates and forecasts, by distribution channel, 2021 – 2033 (USD Million)
Table 65 India industrial air filtration market estimates and forecasts, by MERV rating, 2021 – 2033 (USD Million)
Table 66 India industrial air filtration market estimates and forecasts, by application, 2021 – 2033 (USD Million)
Table 67 Japan industrial air filtration market estimates and forecasts, 2021 – 2033 (USD Million)
Table 68 Japan industrial air filtration market estimates and forecasts, by product, 2021 – 2033 (USD Million)
Table 69 Japan industrial air filtration market estimates and forecasts, by distribution channel, 2021 – 2033 (USD Million)
Table 70 Japan industrial air filtration market estimates and forecasts, by MERV rating, 2021 – 2033 (USD Million)
Table 71 Japan industrial air filtration market estimates and forecasts, by application, 2021 – 2033 (USD Million)
Table 72 Australia industrial air filtration market estimates and forecasts, 2021 – 2033 (USD Million)
Table 73 Australia industrial air filtration market estimates and forecasts, by product, 2021 – 2033 (USD Million)
Table 74 Australia industrial air filtration market estimates and forecasts, by distribution channel, 2021 – 2033 (USD Million)
Table 75 Australia industrial air filtration market estimates and forecasts, by MERV rating, 2021 – 2033 (USD Million)
Table 76 Australia industrial air filtration market estimates and forecasts, by application, 2021 – 2033 (USD Million)
Table 77 Central & South America industrial air filtration market estimates and forecasts, 2021 – 2033 (USD Million)
Table 78 Central & South America industrial air filtration market estimates and forecasts, by product, 2021 – 2033 (USD Million)
Table 79 Central & South America industrial air filtration market estimates and forecasts, by distribution channel, 2021 – 2033 (USD Million)
Table 80 Central & South America industrial air filtration market estimates and forecasts, by MERV rating, 2021 – 2033 (USD Million)
Table 81 Central & South America industrial air filtration market estimates and forecasts, by application, 2021 – 2033 (USD Million)
Table 82 Brazil industrial air filtration market estimates and forecasts, 2021 – 2033 (USD Million)
Table 83 Brazil industrial air filtration market estimates and forecasts, by product, 2021 – 2033 (USD Million)
Table 84 Brazil industrial air filtration market estimates and forecasts, by distribution channel, 2021 – 2033 (USD Million)
Table 85 Brazil industrial air filtration market estimates and forecasts, by MERV rating, 2021 – 2033 (USD Million)
Table 86 Brazil industrial air filtration market estimates and forecasts, by application, 2021 – 2033 (USD Million)
Table 87 Argentina industrial air filtration market estimates and forecasts, 2021 – 2033 (USD Million)
Table 88 Argentina industrial air filtration market estimates and forecasts, by product, 2021 – 2033 (USD Million)
Table 89 Argentina industrial air filtration market estimates and forecasts, by distribution channel, 2021 – 2033 (USD Million)
Table 90 Argentina industrial air filtration market estimates and forecasts, by MERV rating, 2021 – 2033 (USD Million)
Table 91 Argentina industrial air filtration market estimates and forecasts, by application, 2021 – 2033 (USD Million)
Table 92 Middle East & Africa industrial air filtration market estimates and forecasts, 2021 – 2033 (USD Million)
Table 93 Middle East & Africa industrial air filtration market estimates and forecasts, by product, 2021 – 2033 (USD Million)
Table 94 Middle East & Africa industrial air filtration market estimates and forecasts, by distribution channel, 2021 – 2033 (USD Million)
Table 95 Middle East & Africa industrial air filtration market estimates and forecasts, by MERV rating, 2021 – 2033 (USD Million)
Table 96 Middle East & Africa industrial air filtration market estimates and forecasts, by application, 2021 – 2033 (USD Million)
Table 97 Saudi Arabia industrial air filtration market estimates and forecasts, 2021 – 2033 (USD Million)
Table 98 Saudi Arabia industrial air filtration market estimates and forecasts, by product, 2021 – 2033 (USD Million)
Table 99 Saudi Arabia industrial air filtration market estimates and forecasts, by distribution channel, 2021 – 2033 (USD Million)
Table 100 Saudi Arabia industrial air filtration market estimates and forecasts, by MERV rating, 2021 – 2033 (USD Million)
Table 101 Saudi Arabia industrial air filtration market estimates and forecasts, by application, 2021 – 2033 (USD Million)
Table 102 South Africa industrial air filtration market estimates and forecasts, by product, 2021 – 2033 (USD Million)
Table 103 South Africa industrial air filtration market estimates and forecasts, 2021 – 2033 (USD Million)
Table 104 South Africa industrial air filtration market estimates and forecasts, by distribution channel, 2021 – 2033 (USD Million)
Table 105 South Africa industrial air filtration market estimates and forecasts, by MERV rating, 2021 – 2033 (USD Million)
Table 106 South Africa industrial air filtration market estimates and forecasts, by application, 2021 – 2033 (USD Million)
Table 107 Company Heat Map Analysis, 2025
Table 108 Strategy Mapping
List of Figures
Fig. 1 Market research process
Fig. 2 Data triangulation techniques
Fig. 3 Primary research pattern
Fig. 4 Market research approaches
Fig. 5 Information Procurement
Fig. 6 Market Formulation and Validation
Fig. 7 Data Validating & Publishing
Fig. 8 Market Segmentation & Scope
Fig. 9 Global Industrial Air Filtration Market Snapshot
Fig. 10 Segment Snapshot
Fig. 11 Competitive Landscape Snapshot
Fig. 12 Parent market outlook
Fig. 13 Global Industrial Air Filtration Market Value, 2025 (USD Million)
Fig. 14 Global Industrial Air Filtration Market – Value Chain Analysis
Fig. 15 Global Industrial Air Filtration Market – Market Dynamics
Fig. 16 Global Industrial Air Filtration Market – PORTER’s Analysis
Fig. 17 Global Industrial Air Filtration Market – PESTEL Analysis
Fig. 18 Global Industrial Air Filtration Market Estimates & Forecasts, By Product: Key Takeaways
Fig. 19 Global Industrial Air Filtration Market Share, By Product, 2025 & 2033
Fig. 20 Global Industrial Air Filtration Market Estimates and Forecast, By Dust Collection Filters 2021 – 2033 (USD Million)
Fig. 21 Dust Collection Filters Market Estimates and Forecast, By Cartridge Collectors & Filters 2021 – 2033 (USD Million)
Fig. 22 Dust Collection Filters Market Estimates and Forecast, By Baghouse Filters 2021 – 2033 (USD Million)
Fig. 23 Dust Collection Filters Market Estimates and Forecast, By Other Filters 2021 – 2033 (USD Million)
Fig. 24 Global Industrial Air Filtration Market Estimates and Forecast, By Mist Collection Filters 2021 – 2033 (USD Million)
Fig. 25 Global Industrial Air Filtration Market Estimates and Forecast, By Fume Collection Filters 2021 – 2033 (USD Million)
Fig. 26 Global Industrial Air Filtration Market Estimates and Forecast, By HEPA Filters 2021 – 2033 (USD Million)
Fig. 27 Global Industrial Air Filtration Market Estimates and Forecast, By Others 2021 – 2033 (USD Million)
Fig. 28 Global Industrial Air Filtration Market Estimates & Forecasts, By Distribution Channel: Key Takeaways
Fig. 29 Global Industrial Air Filtration Market Share, By Distribution Channel, 2025 & 2033
Fig. 30 Global Industrial Air Filtration Market Estimates and Forecast, By OEM 2021 – 2033 (USD Million)
Fig. 31 Global Industrial Air Filtration Market Estimates and Forecast, By Aftermarket 2021 – 2033 (USD Million)
Fig. 32 Global Industrial Air Filtration Market Estimates & Forecasts, By MERV Rating: Key Takeaways
Fig. 33 Global Industrial Air Filtration Market Share, By MERV Rating, 2025 & 2033
Fig. 34 Global Industrial Air Filtration Market Estimates and Forecast, By 1 to 4 MERV 2021 – 2033 (USD Million)
Fig. 35 Global Industrial Air Filtration Market Estimates and Forecast, By 5 to 8 MERV 2021 – 2033 (USD Million)
Fig. 36 Global Industrial Air Filtration Market Estimates and Forecast, By 9 to 12 MERV 2021 – 2033 (USD Million)
Fig. 37 Global Industrial Air Filtration Market Estimates and Forecast, By 13 to 16 MERV 2021 – 2033 (USD Million)
Fig. 38 Global Industrial Air Filtration Market Estimates and Forecast, By Above 17 MERV 2021 – 2033 (USD Million)
Fig. 39 Global Industrial Air Filtration Market Estimates & Forecasts, By End Use: Key Takeaways
Fig. 40 Global Industrial Air Filtration Market Share, By End Use, 2025 & 2033
Fig. 41 Global Industrial Air Filtration Market Estimates and Forecast, In Cement, 2021 – 2033 (USD Million)
Fig. 42 Global Industrial Air Filtration Market Estimates and Forecast, In Food & Beverage, 2021 – 2033 (USD Million)
Fig. 43 Global Industrial Air Filtration Market Estimates and Forecast, In Metal, 2021 – 2033 (USD Million)
Fig. 44 Global Industrial Air Filtration Market Estimates and Forecast, In Power, 2021 – 2033 (USD Million)
Fig. 45 Global Industrial Air Filtration Market Estimates and Forecast, In Pharmaceutical, 2021 – 2033 (USD Million)
Fig. 46 Global Industrial Air Filtration Market Estimates and Forecast, In Chemical & Petrochemical, 2021 – 2033 (USD Million)
Fig. 47 Global Industrial Air Filtration Market Estimates and Forecast, In Paper & Wood Processing, 2021 – 2033 (USD Million)
Fig. 48 Global Industrial Air Filtration Market Estimates and Forecast, In Agriculture, 2021 – 2033 (USD Million)
Fig. 49 Global Industrial Air Filtration Market Estimates and Forecast, In Others, 2021 – 2033 (USD Million)
Fig. 50 North America Industrial Air Filtration Market Estimates & Forecasts, 2021 – 2033 (USD Million)
Fig. 51 U.S. Industrial Air Filtration Market Estimates & Forecasts, 2021 – 2033 (USD Million)
Fig. 52 Canada Industrial Air Filtration Market Estimates & Forecasts, 2021 – 2033 (USD Million)
Fig. 53 Mexico Industrial Air Filtration Market Estimates & Forecasts, 2021 – 2033 (USD Million)
Fig. 54 Europe Industrial Air Filtration Market Estimates & Forecasts, 2021 – 2033 (USD Million)
Fig. 55 Germany Industrial Air Filtration Market Estimates & Forecasts, 2021 – 2033 (USD Million)
Fig. 56 France Industrial Air Filtration Market Estimates & Forecasts, 2021 – 2033 (USD Million)
Fig. 57 UK Industrial Air Filtration Market Estimates & Forecasts, 2021 – 2033 (USD Million)
Fig. 58 Italy Industrial Air Filtration Market Estimates & Forecasts, 2021 – 2033 (USD Million)
Fig. 59 Asia Pacific Industrial Air Filtration Market Estimates & Forecasts, 2021 – 2033 (USD Million)
Fig. 60 China Industrial Air Filtration Market Estimates & Forecasts, 2021 – 2033 (USD Million)
Fig. 61 Japan Industrial Air Filtration Market Estimates & Forecasts, 2021 – 2033 (USD Million)
Fig. 62 India Industrial Air Filtration Market Estimates & Forecasts, 2021 – 2033 (USD Million)
Fig. 63 Australia Industrial Air Filtration Market Estimates & Forecasts, 2021 – 2033 (USD Million)
Fig. 64 Australia Industrial Air Filtration Market Estimates & Forecasts, 2021 – 2033 (USD Million)
Fig. 65 Central & South America Industrial Air Filtration Market Estimates & Forecasts, 2021 – 2033 (USD Million)
Fig. 66 Brazil Industrial Air Filtration Market Estimates & Forecasts, 2021 – 2033 (USD Million)
Fig. 67 Argentina Industrial Air Filtration Market Estimates & Forecasts, 2021 – 2033 (USD Million)
Fig. 68 Middle East & Africa Industrial Air Filtration Market Estimates & Forecasts, 2021 – 2033 (USD Million)
Fig. 69 Saudi Arabia Industrial Air Filtration Market Estimates & Forecasts, 2021 – 2033 (USD Million)
Fig. 70 South Africa Industrial Air Filtration Market Estimates & Forecasts, 2021 – 2033 (USD Million)
Fig. 71 Key Company Categorization
Fig. 72 Company Market Positioning
Fig. 73 Key Company Market Share Analysis, 2025
Fig. 74 Strategy Mapping