Indoor Amusement Center Market Size, Share & Trends Analysis Report By Component (Arcade Games, AR-VR Games, Indoor Go-karts, Indoor Adventure Parks, Bowling Alleys, Children's Entertainment & Education Area), By Region, And Segment Forecasts, 2026 - 2033
屋内アミューズメントセンター市場 - 構成要素別(アーケードゲーム、AR/VRゲーム、屋内ゴーカート、屋内アドベンチャーパーク、ボウリング場、子供向けエンターテイメント&教育エリア)、地域、セグメント別予測による市場規模、成長と動向分析レポート 2026-2033年
| 出版 | Grand View Research |
| 出版年月 | 2026年02月 |
| ページ数 | 120 |
| 価格 | 記載以外のライセンスについてはお問合せください |
| シングルユーザ | USD 4,950 |
| 種別 | 英文調査報告書 |
| 商品番号 | SMR-16417 |

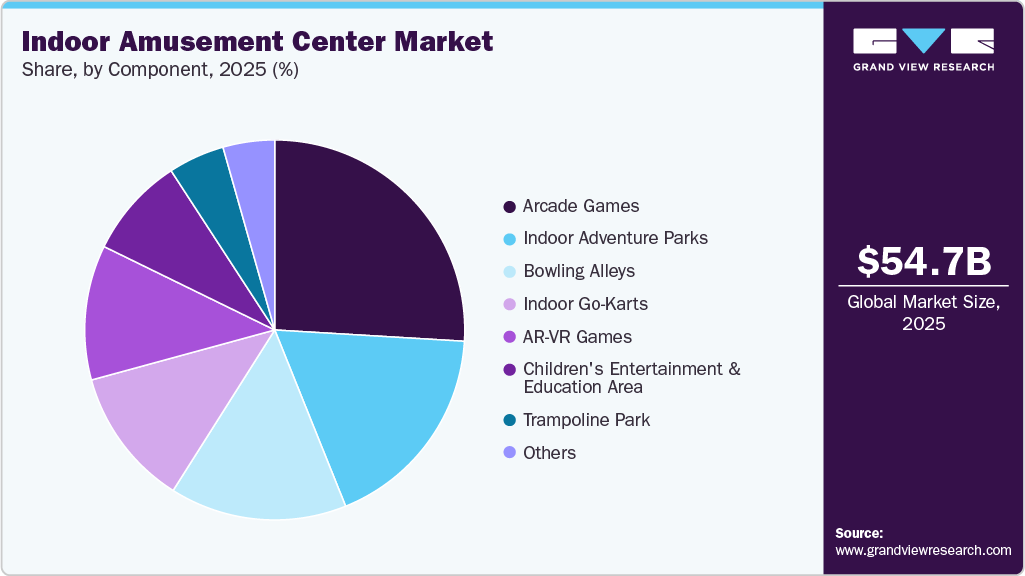
世界の屋内アミューズメントセンター市場規模は、2025年には547億3000万米ドルと推定され、2033年までに1215億4000万米ドルに達すると予測されており、2026年から2033年にかけて年平均成長率(CAGR)10.9%に達するとGrand View Researchでは予測しています。可処分所得の増加、都市化、消費者の余暇嗜好の変化、そして没入型エンターテインメント技術の進歩が、この成長を牽引している。
主要市場動向と洞察
- 北米の屋内アミューズメントセンター市場は、2025年に世界最大の収益シェア39.3%を占めました。
- 米国の屋内アミューズメントセンター業界は、2026年から2033年にかけて大幅な成長が見込まれています。
- 構成要素別に見ると、アーケードゲームが2025年に最大の収益シェア26.0%を占め、市場を牽引しました。
アジア太平洋、ヨーロッパ、北米の人口密集都市を中心に、急速な都市化と居住空間の縮小が進む中、屋内アミューズメントセンター業界の成長が加速しています。屋外レクリエーション施設の不足と予測不可能な天候により、年間を通して快適な空調完備の屋内エンターテイメント施設への需要が高まっています。ファミリーエンターテイメントセンター(FEC)、トランポリンパーク、屋内テーマパーク、エデュテインメントゾーンといった屋内アミューズメントセンターは、屋外アミューズメントパークに比べて安定した集客力と予測可能な収益源を提供します。
さらに、家族向けで体験型のエンターテイメントへの需要の高まりも、この成長を後押ししています。特にミレニアル世代やZ世代の親世代は、物質的なものよりも体験を重視する傾向にあります。屋内アミューズメントセンターは、ゲーム、アトラクション、VRアトラクション、ソフトプレイエリア、飲食施設などを一箇所に集約することで、多世代の顧客層に対応しています。誕生日パーティー、学校行事、企業イベントなどを開催できることも、リピーターの増加と顧客生涯価値の向上に繋がります。
本レポートは、世界、地域、国レベルでの収益成長を予測し、2021年から2033年までの各サブセグメントにおける最新の業界動向を分析しています。本調査において、グランドビューリサーチは屋内アミューズメントセンター市場レポートを構成要素と地域に基づいてセグメント化しました。
Indoor Amusement Center Market Summary
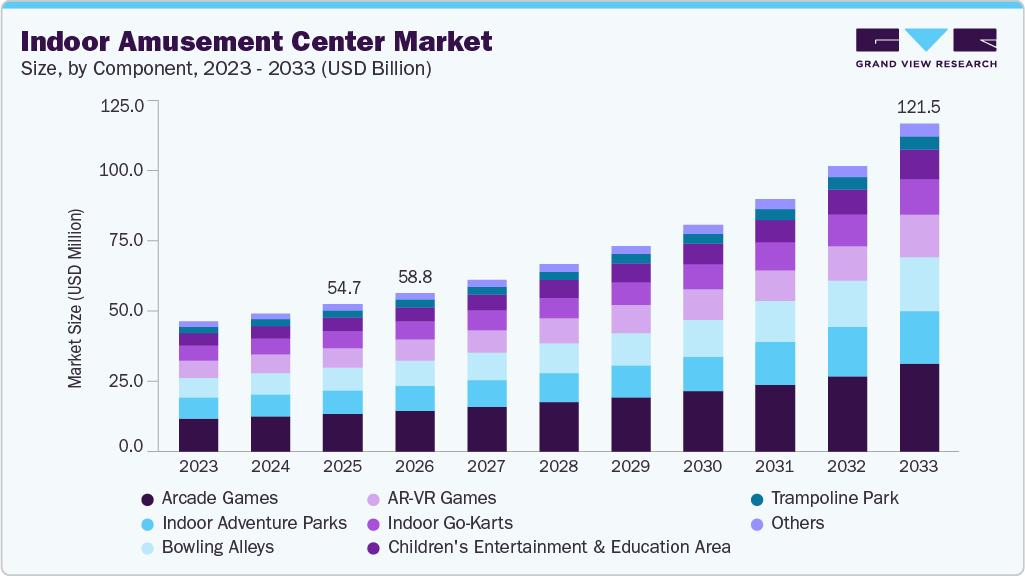
The global indoor amusement center market size was estimated at USD 54.73 billion in 2025 and is projected to reach USD 121.54 billion by 2033, growing at a CAGR of 10.9% from 2026 to 2033. The rising levels of disposable income, urbanization, evolving consumer leisure preferences, and advancements in immersive entertainment technologies drive this growth.
indoor-amusement-center-market-size
Key Market Trends & Insights
- The North America indoor amusement center market held the largest global revenue share of 39.3% in 2025.
- The indoor amusement center industry in the U.S. is expected to grow significantly from 2026 to 2033.
- By component, arcade games led the market with the largest revenue share of 26.0% in 2025.
Market Size & Forecast
- 2025 Market Size: USD 54.73 Billion
- 2033 Projected Market Size: USD 121.54 Billion
- CAGR (2026-2033): 10.9%
- North America: Largest market in 2025
The rapid urbanization and shrinking residential spaces, particularly in densely populated cities across Asia Pacific, Europe, and North America, contribute to the growth in the indoor amusement center industry. Limited outdoor recreational infrastructure and unpredictable weather have increased demand for indoor, year-round, climate-controlled entertainment venues. Indoor amusement centers, such as family entertainment centers (FECs), trampoline parks, indoor theme parks, and edutainment zones, offer consistent footfall and predictable revenue streams compared to outdoor amusement parks.
In addition, the rising demand for family-oriented and experiential entertainment drives the growth. Consumers, especially millennials and Gen Z parents, are prioritizing experiences over material goods. Indoor amusement centers cater to multi-generational audiences by combining gaming, rides, VR attractions, soft play areas, and food & beverage offerings under one roof. The ability to host birthday parties, school outings, and corporate events further strengthens repeat visitation and customer lifetime value.
Technological integration and immersive experiences are also accelerating market growth. The adoption of virtual reality (VR), augmented reality (AR), motion simulators, interactive projection mapping, and gamified attractions enhances customer engagement and differentiates venues in a competitive leisure market. These technologies enable operators to refresh attractions at lower capital costs than in large outdoor parks, resulting in faster ROI and greater scalability. For example, in August 2025, Formula One World Championship Limited introduced F1 Box, a new immersive motorsport attraction set to open at Westfield Stratford City in the UK. The venue features advanced full-motion racing simulators, ultra-high-definition 4K visuals, and sophisticated audio-visual effects complemented by race-style commentary. Built around competitive, high-adrenaline gameplay, F1 Box aims to deliver a realistic and engaging Formula 1 racing experience for fans and visitors alike.
The bowling alleys segment is anticipated to grow at the fastest CAGR during the forecast period, driven by the strong demand for group-based and social recreation activities. Bowling appeals to a wide age range, from children to older adults, and does not require advanced skill levels, making it ideal for families, friends, and corporate groups. Its suitability for birthday parties, team outings, leagues, and corporate events ensures steady weekday and weekend footfall, supporting consistent revenue generation for operators. Moreover, flexible revenue models and franchising strategies are strengthening the segment’s scalability.
Component Insights
The arcade games segment dominated the indoor amusement center market, accounting for the revenue share of 26.0% in 2025, owing to the increasing consumer preference for out-of-home, social entertainment experiences. Unlike home consoles and mobile gaming, arcade games offer a shared, competitive, and immersive environment that appeals to families, teenagers, and young adults. Multiplayer formats, ticket-redemption mechanics, and skill-based challenges encourage group participation, repeat play, and longer dwell times, making arcade zones a core revenue generator for family entertainment centers (FECs) and indoor amusement parks.
Key Indoor Amusement Center Company Insights
Key players in the indoor amusement center industry include CEC Entertainment Concepts, LP; Cinergy Entertainment Group; Dave & Buster’s, Inc.; and Bowlero. The companies are focusing on various strategic initiatives, including new product development, partnerships & collaborations, and agreements to gain a competitive advantage over their rivals. The following are some instances of such initiatives.
- In November 2025, CEC Entertainment Concepts announced the launch of Chuck E. Cheese Adventure World, a new indoor playground concept centered exclusively on active play. Spanning 12,000 square feet, the facility is opening in Texas, U.S., and is tailored for families with children aged 3 to 8. The new venue emphasizes physical activity, creativity, and imaginative play within a secure, themed environment. Designed to reflect the brand’s signature characters and playful atmosphere, Adventure World aims to offer a trusted space where children can stay engaged and active. At the same time, parents enjoy a safe and thoughtfully curated entertainment experience.
- In August 2025, Smash Park expanded its U.S. footprint with the opening of a new location in Westerville, Ohio, introducing its signature blend of dining and entertainment to the area. The 52,000-square-foot venue features a mix of indoor and outdoor pickleball courts, along with a wide range of games, including cornhole, duckpin bowling, bocce ball, shuffleboard, darts, and an arcade. The location also includes a full-service restaurant and bar, positioning Smash Park as a comprehensive eatertainment destination designed to attract families, groups, and social gatherings.
Key Indoor Amusement Center Companies:
The following key companies have been profiled for this study on the indoor amusement center market.
- Bandai Namco Holdings Inc.
- Bowlero
- CEC Entertainment Concepts, LP
- Cinergy Entertainment Group
- Dave and Buster’s, Inc.
- Funriders
- Inflatable Solutions International Limited
- KidZania
- Landmark Group (Funcity)
- Main Event Entertainment
- Merlin Entertainments
- Scene75 Entertainment Centers
- Smaaash Entertainment Private Limited
- TEEG
- Urban Air
Indoor Amusement Center Market Report Scope
| Report Attribute | Details |
| Market size in 2026 | USD 58.78 billion |
| Revenue forecast in 2033 | USD 121.54 billion |
| Growth rate | CAGR of 10.9% from 2026 to 2033 |
| Actual data | 2021 – 2025 |
| Forecast period | 2026 – 2033 |
| Quantitative units | Revenue in USD billion and CAGR from 2026 to 2033 |
| Report enterprise size | Revenue forecast, company share, competitive landscape, growth factors, and trends |
| Segments covered | Component and region |
| Regional scope | North America; Europe; Asia Pacific; Latin America; MEA |
| Country scope | U.S.; Canada; Mexico; U.K.; Germany; France; China; South Korea; India; Australia; Indonesia; Thailand; New Zealand; Singapore; Philippines; Malaysia; Brazil; UAE; Saudi Arabia; South Africa |
| Key companies profiled | Bandai Namco Holdings Inc.; Bowlero; CEC Entertainment Concepts, LP; Cinergy Entertainment Group; Dave and Buster’s, Inc.; Funriders; Inflatable Solutions International Limited; KidZania; Landmark Group (Funcity); Main Event Entertainment; Merlin Entertainments; Scene75 Entertainment Centers; Smaaash Entertainment Private Limited; TEEG; Urban Air |
| Customization scope | Free report customization (equivalent to 8 analysts working days) with purchase. Addition or alteration to country, regional & segment scope. |
Global Indoor Amusement Center Market Report Segmentation
This report forecasts revenue growth at the global, regional, and country levels and provides an analysis of the latest industry trends in each of the sub-segments from 2021 to 2033. For this study, Grand View Research has segmented the indoor amusement center market report based on component and region:
- Component Outlook (Revenue, USD Billion, 2021 – 2033)
- Arcade Games
- AR-VR Games
- Indoor Go-karts
- Indoor Adventure Parks
- Bowling Alleys
- Children’s Entertainment & Education Area
- Trampoline Park
- Others
- Regional Outlook (Revenue, USD Billion, 2021 – 2033)
- North America
- U.S.
- Canada
- Mexico
- Europe
- UK
- Germany
- France
- Asia Pacific
- China
- India
- Japan
- Australia
- South Korea
- Indonesia
- Thailand
- New Zealand
- Singapore
- Philippines
- Malaysia
- Latin America
- Brazil
- Middle East & Africa
- UAE
- Saudi Arabia
- South Africa
- North America
Table of Contents
Chapter 1. Methodology and Scope
1.1. Methodology segmentation & scope
1.2. Market Definitions
1.3. Research Methodology
1.3.1. Information Procurement
1.3.2. Information or Data Analysis
1.3.3. Market Formulation & Data Visualization
1.3.4. Data Validation & Publishing
1.4. Research Scope and Assumptions
1.4.1. List of Data Sources
Chapter 2. Executive Summary
2.1. Market Outlook
2.2. Segment Outlook
2.3. Competitive Insights
Chapter 3. Indoor Amusement Center Variables, Trends & Scope
3.1. Market Introduction/Lineage Outlook
3.2. Industry Value Chain Analysis
3.3. Market Dynamics
3.3.1. Market Drivers Analysis
3.3.2. Market Restraints Analysis
3.3.3. Industry Opportunities
3.4. Indoor Amusement Center Analysis Tools
3.4.1. Porter’s Analysis
3.4.1.1. Bargaining power of the suppliers
3.4.1.2. Bargaining power of the buyers
3.4.1.3. Threats of substitution
3.4.1.4. Threats from new entrants
3.4.2. PESTEL Analysis
3.4.2.1. Political landscape
3.4.2.2. Economic and Social landscape
3.4.2.3. Technological landscape
3.4.2.4. Environmental landscape
3.4.2.5. Legal landscape
Chapter 4. Indoor Amusement Center Market: Component Estimates & Trend Analysis
4.1. Segment Dashboard
4.2. Indoor Amusement Center: Component Movement Analysis, USD Billion, 2025 & 2033
4.3. Arcade Games
4.3.1. Market Size Estimates and Forecasts, 2021 – 2033 (USD Billion)
4.4. AR-VR Games
4.4.1. Market Size Estimates and Forecasts, 2021 – 2033 (USD Billion)
4.5. Indoor Go-karts
4.5.1. Market Size Estimates and Forecasts, 2021 – 2033 (USD Billion)
4.6. Indoor Adventure Parks
4.6.1. Market Size Estimates and Forecasts, 2021 – 2033 (USD Billion)
4.7. Bowling Alleys
4.7.1. Market Size Estimates and Forecasts, 2021 – 2033 (USD Billion)
4.8. Children’s Entertainment & Education Area
4.8.1. Market Size Estimates and Forecasts, 2021 – 2033 (USD Billion)
4.9. Trampoline Park
4.9.1. Market Size Estimates and Forecasts, 2021 – 2033 (USD Billion)
4.10. Others
4.10.1. Market Size Estimates and Forecasts, 2021 – 2033 (USD Billion)
Chapter 5. Indoor Amusement Center Market: Regional Estimates & Trend Analysis
5.1. Indoor Amusement Center Share, By Region, 2025 & 2033, USD Billion
5.2. North America
5.2.1. Market Estimates and Forecasts, 2021 – 2033 (USD Billion)
5.2.2. Market estimates and forecast by component, 2021 – 2033 (Revenue, USD Billion)
5.2.3. U.S.
5.2.3.1. Market Estimates and Forecasts, 2021 – 2033 (USD Billion)
5.2.3.2. Market estimates and forecast by component, 2021 – 2033 (Revenue, USD Billion)
5.2.4. Canada
5.2.4.1. Market Estimates and Forecasts, 2021 – 2033 (USD Billion)
5.2.4.2. Market estimates and forecast by component, 2021 – 2033 (Revenue, USD Billion)
5.2.5. Mexico
5.2.5.1. Market Estimates and Forecasts, 2021 – 2033 (USD Billion)
5.2.5.2. Market estimates and forecast by component, 2021 – 2033 (Revenue, USD Billion)
5.3. Europe
5.3.1. Market Estimates and Forecasts, 2021 – 2033 (USD Billion)
5.3.2. Market estimates and forecast by component, 2021 – 2033 (Revenue, USD Billion)
5.3.3. U.K.
5.3.3.1. Market Estimates and Forecasts, 2021 – 2033 (USD Billion)
5.3.3.2. Market estimates and forecast by component, 2021 – 2033 (Revenue, USD Billion)
5.3.4. Germany
5.3.4.1. Market Estimates and Forecasts, 2021 – 2033 (USD Billion)
5.3.4.2. Market estimates and forecast by component, 2021 – 2033 (Revenue, USD Billion)
5.3.5. France
5.3.5.1. Market Estimates and Forecasts, 2021 – 2033 (USD Billion)
5.3.5.2. Market estimates and forecast by component, 2021 – 2033 (Revenue, USD Billion)
5.4. Asia Pacific
5.4.1. Market Estimates and Forecasts, 2021 – 2033 (USD Billion)
5.4.2. Market estimates and forecast by component, 2021 – 2033 (Revenue, USD Billion)
5.4.3. China
5.4.3.1. Market Estimates and Forecasts, 2021 – 2033 (USD Billion)
5.4.3.2. Market estimates and forecast by component, 2021 – 2033 (Revenue, USD Billion)
5.4.4. India
5.4.4.1. Market Estimates and Forecasts, 2021 – 2033 (USD Billion)
5.4.4.2. Market estimates and forecast by component, 2021 – 2033 (Revenue, USD Billion)
5.4.5. Japan
5.4.5.1. Market Estimates and Forecasts, 2021 – 2033 (USD Billion)
5.4.5.2. Market estimates and forecast by component, 2021 – 2033 (Revenue, USD Billion)
5.4.6. Australia
5.4.6.1. Market Estimates and Forecasts, 2021 – 2033 (USD Billion)
5.4.6.2. Market estimates and forecast by component, 2021 – 2033 (Revenue, USD Billion)
5.4.7. South Korea
5.4.7.1. Market Estimates and Forecasts, 2021 – 2033 (USD Billion)
5.4.7.2. Market estimates and forecast by component, 2021 – 2033 (Revenue, USD Billion)
5.4.8. Indonesia
5.4.8.1. Market Estimates and Forecasts, 2021 – 2033 (USD Billion)
5.4.8.2. Market estimates and forecast by component, 2021 – 2033 (Revenue, USD Billion)
5.4.9. Thailand
5.4.9.1. Market Estimates and Forecasts, 2021 – 2033 (USD Billion)
5.4.9.2. Market estimates and forecast by component, 2021 – 2033 (Revenue, USD Billion)
5.4.10. New Zealand
5.4.10.1. Market Estimates and Forecasts, 2021 – 2033 (USD Billion)
5.4.10.2. Market estimates and forecast by component, 2021 – 2033 (Revenue, USD Billion)
5.4.11. Singapore
5.4.11.1. Market Estimates and Forecasts, 2021 – 2033 (USD Billion)
5.4.11.2. Market estimates and forecast by component, 2021 – 2033 (Revenue, USD Billion)
5.4.12. Philippines
5.4.12.1. Market Estimates and Forecasts, 2021 – 2033 (USD Billion)
5.4.12.2. Market estimates and forecast by component, 2021 – 2033 (Revenue, USD Billion)
5.4.13. Malaysia
5.4.13.1. Market Estimates and Forecasts, 2021 – 2033 (USD Billion)
5.4.13.2. Market estimates and forecast by component, 2021 – 2033 (Revenue, USD Billion)
5.5. Latin America
5.5.1. Market Estimates and Forecasts, 2021 – 2033 (USD Billion)
5.5.2. Market estimates and forecast by component, 2021 – 2033 (Revenue, USD Billion)
5.5.3. Brazil
5.5.3.1. Market Estimates and Forecasts, 2021 – 2033 (USD Billion)
5.5.3.2. Market estimates and forecast by component, 2021 – 2033 (Revenue, USD Billion)
5.6. Middle East & Africa
5.6.1. Market Estimates and Forecasts, 2021 – 2033 (USD Billion)
5.6.2. Market estimates and forecast by component, 2021 – 2033 (Revenue, USD Billion)
5.6.3. Saudi Arabia
5.6.3.1. Market Estimates and Forecasts, 2021 – 2033 (USD Billion)
5.6.3.2. Market estimates and forecast by component, 2021 – 2033 (Revenue, USD Billion)
5.6.4. UAE
5.6.4.1. Market Estimates and Forecasts, 2021 – 2033 (USD Billion)
5.6.4.2. Market estimates and forecast by component, 2021 – 2033 (Revenue, USD Billion)
5.6.5. South Africa
5.6.5.1. Market Estimates and Forecasts, 2021 – 2033 (USD Billion)
5.6.5.2. Market estimates and forecast by component, 2021 – 2033 (Revenue, USD Billion)
Chapter 6. Competitive Landscape
6.1. Recent Developments & Impact Analysis by Key Market Participants
6.2. Company Categorization
6.3. Company Market Share Analysis
6.4. Company Heat Map Analysis
6.5. Strategy Mapping
6.5.1. Expansion
6.5.2. Mergers & Acquisition
6.5.3. Partnerships & Collaborations
6.5.4. New Product Launches
6.5.5. Research And Development
6.6. Company Profiles
6.6.1. Bandai Namco Holdings Inc.
6.6.1.1. Participant’s Overview
6.6.1.2. Financial Performance
6.6.1.3. Product Benchmarking
6.6.1.4. Recent Developments
6.6.2. Bowlero
6.6.2.1. Participant’s Overview
6.6.2.2. Financial Performance
6.6.2.3. Product Benchmarking
6.6.2.4. Recent Developments
6.6.3. CEC Entertainment Concepts, LP
6.6.3.1. Participant’s Overview
6.6.3.2. Financial Performance
6.6.3.3. Product Benchmarking
6.6.3.4. Recent Developments
6.6.4. Cinergy Entertainment Group
6.6.4.1. Participant’s Overview
6.6.4.2. Financial Performance
6.6.4.3. Product Benchmarking
6.6.4.4. Recent Developments
6.6.5. Dave and Buster’s, Inc.
6.6.5.1. Participant’s Overview
6.6.5.2. Financial Performance
6.6.5.3. Product Benchmarking
6.6.5.4. Recent Developments
6.6.6. Funriders
6.6.6.1. Participant’s Overview
6.6.6.2. Financial Performance
6.6.6.3. Product Benchmarking
6.6.6.4. Recent Developments
6.6.7. Inflatable Solutions International Limited
6.6.7.1. Participant’s Overview
6.6.7.2. Financial Performance
6.6.7.3. Product Benchmarking
6.6.7.4. Recent Developments
6.6.8. KidZania
6.6.8.1. Participant’s Overview
6.6.8.2. Financial Performance
6.6.8.3. Product Benchmarking
6.6.8.4. Recent Developments
6.6.9. Landmark Group (Funcity)
6.6.9.1. Participant’s Overview
6.6.9.2. Financial Performance
6.6.9.3. Product Benchmarking
6.6.9.4. Recent Developments
6.6.10. Main Event Entertainment
6.6.10.1. Participant’s Overview
6.6.10.2. Financial Performance
6.6.10.3. Product Benchmarking
6.6.10.4. Recent Developments
6.6.11. Merlin Entertainments
6.6.11.1. Participant’s Overview
6.6.11.2. Financial Performance
6.6.11.3. Product Benchmarking
6.6.11.4. Recent Developments
6.6.12. Scene75 Entertainment Centers
6.6.12.1. Participant’s Overview
6.6.12.2. Financial Performance
6.6.12.3. Product Benchmarking
6.6.12.4. Recent Developments
6.6.13. Smaaash Entertainment Private Limited
6.6.13.1. Participant’s Overview
6.6.13.2. Financial Performance
6.6.13.3. Product Benchmarking
6.6.13.4. Recent Developments
6.6.14. TEEG
6.6.14.1. Participant’s Overview
6.6.14.2. Financial Performance
6.6.14.3. Product Benchmarking
6.6.14.4. Recent Developments
6.6.15. Urban Air
6.6.15.1. Participant’s Overview
6.6.15.2. Financial Performance
6.6.15.3. Product Benchmarking
6.6.15.4. Recent Developments
List of Tables
Table 1 List of Abbreviations
Table 2 Global indoor amusement center market, 2021 – 2033 (USD Billion)
Table 3 Global indoor amusement center market, by region, 2021 – 2033 (USD Billion)
Table 4 Global indoor amusement center market, by component, 2021 – 2033 (USD Billion)
Table 5 Global arcade games market by region, 2021 – 2033 (USD Billion)
Table 6 Global AR-VR games market by region, 2021 – 2033 (USD Billion)
Table 7 Global indoor Go-karts market by region, 2021 – 2033 (USD Billion)
Table 8 Global indoor adventure parks market by region, 2021 – 2033 (USD Billion)
Table 9 Global bowling alleys market by region, 2021 – 2033 (USD Billion)
Table 10 Global children’s entertainment & education area market by region, 2021 – 2033 (USD Billion)
Table 11 Global trampoline park market by region, 2021 – 2033 (USD Billion)
Table 12 Global others market by region, 2021 – 2033 (USD Billion)
Table 13 North America indoor amusement center market, by component 2021 – 2033 (USD Billion)
Table 14 U.S. indoor amusement center market, by component 2021 – 2033 (USD Billion)
Table 15 Canada indoor amusement center market, by component 2021 – 2033 (USD Billion)
Table 16 Mexico indoor amusement center market, by component 2021 – 2033 (USD Billion)
Table 17 Europe indoor amusement center market, by component 2021 – 2033 (USD Billion)
Table 18 U.K. indoor amusement center market, by component 2021 – 2033 (USD Billion)
Table 19 Germany indoor amusement center market, by component 2021 – 2033 (USD Billion)
Table 20 France indoor amusement center market, by component 2021 – 2033 (USD Billion)
Table 21 Asia Pacific indoor amusement center market, by component 2021 – 2033 (USD Billion)
Table 22 China indoor amusement center market, by component 2021 – 2033 (USD Billion)
Table 23 India indoor amusement center market, by component 2021 – 2033 (USD Billion)
Table 24 Japan indoor amusement center market, by component 2021 – 2033 (USD Billion)
Table 25 Australia indoor amusement center market, by component 2021 – 2033 (USD Billion)
Table 26 South Korea indoor amusement center market, by component 2021 – 2033 (USD Billion)
Table 27 Indonesia indoor amusement center market, by component 2021 – 2033 (USD Billion)
Table 28 Thailand indoor amusement center market, by component 2021 – 2033 (USD Billion)
Table 29 New Zealand indoor amusement center market, by component 2021 – 2033 (USD Billion)
Table 30 Singapore indoor amusement center market, by component 2021 – 2033 (USD Billion)
Table 31 Philippines indoor amusement center market, by component 2021 – 2033 (USD Billion)
Table 32 Malaysia indoor amusement center market, by component 2021 – 2033 (USD Billion)
Table 33 Latin America indoor amusement center market, by component 2021 – 2033 (USD Billion)
Table 34 Brazil indoor amusement center market, by component 2021 – 2033 (USD Billion)
Table 35 Middle East & Africa indoor amusement center market, by component 2021 – 2033 (USD Billion)
Table 36 UAE indoor amusement center market, by component 2021 – 2033 (USD Billion)
Table 37 Saudi Arabia indoor amusement center market, by component 2021 – 2033 (USD Billion)
Table 38 South Africa indoor amusement center market, by component 2021 – 2033 (USD Billion)
List of Figures
Fig. 1 Indoor Amusement Center Market Segmentation
Fig. 2 Market landscape
Fig. 3 Information Procurement
Fig. 4 Data Analysis Models
Fig. 5 Market Formulation and Validation
Fig. 6 Data Validating & Publishing
Fig. 7 Market Snapshot
Fig. 8 Segment Snapshot
Fig. 9 Competitive Landscape Snapshot
Fig. 10 Indoor Amusement Center: Industry Value Chain Analysis
Fig. 11 Indoor Amusement Center: Market Dynamics
Fig. 12 Indoor Amusement Center: PORTER’s Analysis
Fig. 13 Indoor Amusement Center: PESTEL Analysis
Fig. 14 Indoor Amusement Center Share by Component, 2025 & 2033 (USD Billion)
Fig. 15 Indoor Amusement Center, by Component: Market Share, 2025 & 2033
Fig. 16 Arcade Games Market Estimates and Forecasts, 2021 – 2033 (Revenue, USD Billion)
Fig. 17 AR-VR Games Market Estimates and Forecasts, 2021 – 2033 (Revenue, USD Billion)
Fig. 18 Indoor Go-karts Market Estimates and Forecasts, 2021 – 2033 (Revenue, USD Billion)
Fig. 19 Indoor Adventure Parks Market Estimates and Forecasts, 2021 – 2033 (Revenue, USD Billion)
Fig. 20 Bowling Alleys Market Estimates and Forecasts, 2021 – 2033 (Revenue, USD Billion)
Fig. 21 Children’s Entertainment & Education Area Market Estimates and Forecasts, 2021 – 2033 (Revenue, USD Billion)
Fig. 22 Trampoline Park Market Estimates and Forecasts, 2021 – 2033 (Revenue, USD Billion)
Fig. 23 Others Market Estimates and Forecasts, 2021 – 2033 (Revenue, USD Billion)
Fig. 24 Regional Marketplace: Key Takeaways
Fig. 25 Regional Marketplace: Key Takeaways
Fig. 26 North America Indoor Amusement Center Market Estimates and Forecasts, 2021 – 2033 (USD Billion)
Fig. 27 U.S. Indoor Amusement Center Market Estimates and Forecasts, 2021 – 2033 (USD Billion)
Fig. 28 Canada Indoor Amusement Center Market Estimates and Forecasts, 2021 – 2033 (USD Billion)
Fig. 29 Mexico Indoor Amusement Center Market Estimates and Forecasts, 2021 – 2033 (USD Billion)
Fig. 30 Europe Indoor Amusement Center Market Estimates and Forecasts, 2021 – 2033 (USD Billion)
Fig. 31 U.K. Indoor Amusement Center Market Estimates and Forecasts, 2021 – 2033 (USD Billion)
Fig. 32 Germany Indoor Amusement Center Market Estimates and Forecasts, 2021 – 2033 (USD Billion)
Fig. 33 France Indoor Amusement Center Market Estimates and Forecasts, 2021 – 2033 (USD Billion)
Fig. 34 Asia Pacific Indoor Amusement Center Market Estimates and Forecast, 2021 – 2033 (USD Billion)
Fig. 35 China Indoor Amusement Center Market Estimates and Forecasts, 2021 – 2033 (USD Billion)
Fig. 36 India Indoor Amusement Center Market Estimates and Forecasts, 2021 – 2033 (USD Billion)
Fig. 37 Japan Indoor Amusement Center Market Estimates and Forecasts, 2021 – 2033 (USD Billion)
Fig. 38 Australia Indoor Amusement Center Market Estimates and Forecasts, 2021 – 2033 (USD Billion)
Fig. 39 South Korea Indoor Amusement Center Market Estimates and Forecasts, 2021 – 2033 (USD Billion)
Fig. 40 Indonesia Indoor Amusement Center Market Estimates and Forecasts, 2021 – 2033 (USD Billion)
Fig. 41 Thailand Indoor Amusement Center Market Estimates and Forecasts, 2021 – 2033 (USD Billion)
Fig. 42 New Zealand Indoor Amusement Center Market Estimates and Forecasts, 2021 – 2033 (USD Billion)
Fig. 43 Singapore Indoor Amusement Center Market Estimates and Forecasts, 2021 – 2033 (USD Billion)
Fig. 44 Philippines Indoor Amusement Center Market Estimates and Forecasts, 2021 – 2033 (USD Billion)
Fig. 45 Malaysia Indoor Amusement Center Market Estimates and Forecasts, 2021 – 2033 (USD Billion)
Fig. 46 Latin America Indoor Amusement Center Market Estimates and Forecasts, 2021 – 2033 (USD Billion)
Fig. 47 Brazil Indoor Amusement Center Market Estimates and Forecasts, 2021 – 2033 (USD Billion)
Fig. 48 MEA Indoor Amusement Center Market Estimates and Forecasts, 2021 – 2033 (USD Billion)
Fig. 49 Saudi Arabia Indoor Amusement Center Market Estimates and Forecasts, 2021 – 2033 (USD Billion)
Fig. 50 UAE Indoor Amusement Center Market Estimates and Forecasts, 2021 – 2033 (USD Billion)
Fig. 51 South Africa Indoor Amusement Center Market Estimates and Forecasts, 2021 – 2033 (USD Billion)
Fig. 52 Key Company Categorization
Fig. 53 Company Market Positioning
Fig. 54 Key Company Market Share Analysis, 2025
Fig. 55 Strategic Framework