Fixed Wireless Access Market Size, Share & Trends Analysis Report
Fixed Wireless Access Market Size, Share & Trends Analysis Report By Offering (Hardware, Services), By Operating Frequency (Sub-6 GHz, 24-39 GHz), By Demography, By Technology (4G, 5G), By Application (Residential, Commercial, Industrial), By Region, And Segment Forecasts, 2026 - 2033
固定無線アクセス市場 - 提供内容(ハードウェア、サービス)、動作周波数(サブ6GHz、24~39GHz)、人口統計、テクノロジー(4G、5G)、用途(住宅、商業、産業)、地域、セグメント別予測による市場規模、成長と動向分析レポート 2026-2033年
| 出版 | Grand View Research |
| 出版年月 | 2025年12月 |
| ページ数 | 150 |
| 価格 | 記載以外のライセンスについてはお問合せください |
| シングルユーザ | USD 4,950 |
| 種別 | 英文調査報告書 |
| 商品番号 | SMR-1226712267 |

世界の固定無線アクセス市場規模は、2025年に1,837億8,000万米ドルに達すると推定され、2026年から2033年にかけて年平均成長率(CAGR)26.7%で成長し、2033年には1兆1,159億8,000万米ドルに達すると予測されています。5G技術の急速な進歩と導入が市場の成長を牽引しています。光ファイバーやDSLなどの固定回線接続に依存する従来のブロードバンドとは異なり、固定無線アクセス(FWA)はセルラーネットワークを活用して高速インターネットを提供します。
4G よりも低遅延、高帯域幅、高速データ速度を提供する 5G ネットワークの展開により、光ファイバー ケーブルの敷設がコスト的に困難であったり地理的に困難な地域では特に、FWA が有線ブロードバンドの現実的な代替手段となっています。
従来のブロードバンドインフラが不十分、あるいは全く整備されていない農村部やサービスが行き届いていない地域では、高速インターネットアクセスの需要が高まっています。固定無線アクセス(FWA)は、物理的なケーブル敷設に比べて迅速かつ低コストで導入できるため、これらの地域にとって魅力的なソリューションとなります。リモートワーク、オンライン教育、ストリーミングサービス、その他のデジタルアクティビティにおける信頼性の高いインターネットアクセスの需要の高まりが、この需要を牽引しています。
固定無線アクセスは、特に低密度地域やアクセスが困難な地域において、従来のブロードバンドよりも費用対効果の高いソリューションを提供します。ケーブルや溝といった大規模な物理インフラの必要性が減るため、導入・保守コストの削減につながります。さらに、FWAは拡張性が高く、サービスプロバイダーは需要の増加に応じて、大幅な追加投資をすることなく、カバレッジと容量を拡張できます。この拡張性により、FWAは投資収益率(ROI)の最大化を目指す通信事業者にとって魅力的な選択肢となっています。
Fixed Wireless Access Market Summary
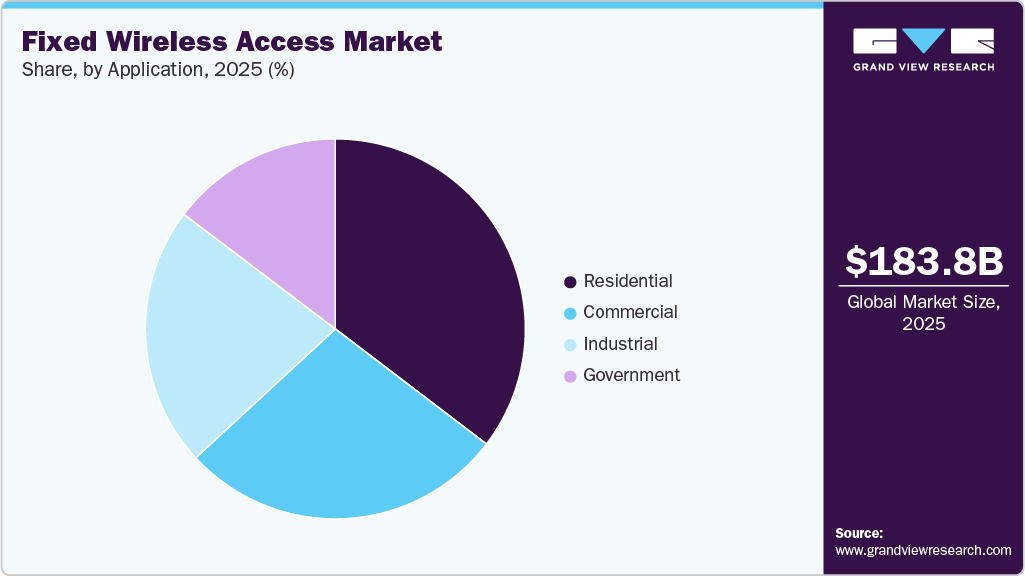
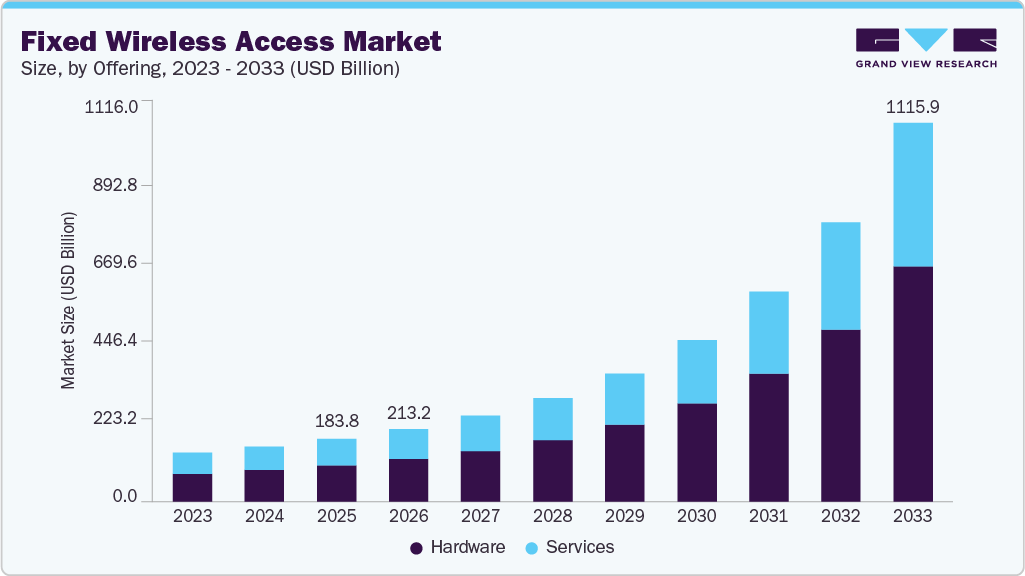
The global fixed wireless access market size was estimated at USD 183.78 billion in 2025 and is projected to reach USD 1,115.98 billion by 2033, growing at a CAGR of 26.7% from 2026 to 2033. The rapid advancement and deployment of 5G technology drives the market’s growth; unlike traditional broadband, which relies on fixed-line connections such as fiber or DSL, fixed wireless access (FWA) leverages cellular networks to deliver high-speed internet.
fixed-wireless-access-market-size
The rollout of 5G networks, which offer lower latency, higher bandwidth, and faster data speeds than 4G, has made FWA a viable alternative to wired broadband, particularly in areas where laying fiber-optic cables is cost-prohibitive or geographically challenging.
There is a growing demand for high-speed internet access in rural and underserved regions where traditional broadband infrastructure is inadequate or non-existent. fixed wireless access (FWA) presents an attractive solution in these areas as it can be deployed more quickly and with lower capital expenditure compared to laying physical cables. The increasing need for reliable internet access for remote work, online education, streaming services, and other digital activities drives this demand.
Fixed wireless access offers a more cost-effective solution than traditional broadband, especially in low-density or hard-to-reach areas. The reduced need for extensive physical infrastructure, such as cables and trenches, translates into lower deployment and maintenance costs. Furthermore, FWA is highly scalable, allowing service providers to expand their coverage and capacity in response to growing demand without substantial additional investment. This scalability makes FWA an attractive option for telecom operators looking to maximize their return on investment.
The evolving needs of consumers and businesses contribute to the growth of fixed wireless access. The rise of remote work, online education, and the increased reliance on digital services have highlighted the importance of reliable, high-speed internet connectivity. Fixed Wireless Access (FWA) offers a flexible and scalable solution that can quickly adapt to changing demands in urban, suburban, or rural settings. FWA provides a dependable internet connection for businesses that can support a range of operations, from small offices to large enterprises, without extensive infrastructure. This adaptability to diverse needs is a key factor in adopting FWA in the global market.
However, a lack of awareness about fixed wireless access and consumer perceptions could hinder market growth. Many consumers may be unfamiliar with fixed wireless access as a broadband option or may have concerns about its reliability, speed, and overall performance compared to traditional wired solutions. Misconceptions about the technology, such as the belief that it is only suitable for rural areas or offers inferior service, can deter potential customers from considering FWA.
Fixed Wireless Access Market Report Scope
| Report Attribute | Details |
| Market size value in 2026 | USD 213.15 billion |
| Revenue forecast in 2033 | USD 1,115.98 billion |
| Growth rate | CAGR of 26.7% from 2026 to 2033 |
| Base year for estimation | 2025 |
| Historical data | 2021 – 2024 |
| Forecast period | 2026 – 2033 |
| Quantitative units | Volume in thousand units; revenue in USD million/billion, and CAGR from 2026 to 2033 |
| Report coverage | Volume & revenue forecast, company market share, competitive landscape, growth factors, and trends |
| Segments covered | Offering, operating frequency, demography, technology, application, region |
| Regional scope | North America; Europe; Asia Pacific; Latin America; MEA |
| Country scope | U.S.; Canada; Mexico; Germany; UK; France; China; India; Japan; South Korea; Philippines; Brazil; Kingdom of Saudi Arabia (KSA); UAE; South Africa |
| Key companies profiled | Nokia Corporation; AT&T Inc.; T Mobile USA, Inc.; CommScope Inc.; Verizon Communications Inc.; Vodafone Group Plc; Huawei Technologies Co., Ltd.; Inseego Corp; Telstra; FS.com |
| Customization scope | Free report customization (equivalent to up to 8 analysts working days) with purchase. Addition or alteration to country, regional & segment scope |
Global Fixed Wireless Access Market Report Segmentation
The report forecasts volume & revenue growth at global, regional, and country levels and provides an analysis of the latest industry trends in each of the sub-segments from 2021 to 2033. For this study, Grand View Research has segmented the global fixed wireless access market report based on offering, operating frequency, demography, technology, and region.
- Offering Outlook (Volume, Thousand Units; Revenue, USD Million, 2021 – 2033)
- Hardware
o Customer Premises Equipment (CPE)
o Indoor CPE
o Outdoor CPE
o Access Units
o Femto Cells
o Pico Cells
- Services
- Operating Frequency Outlook Volume, Thousand Units; Revenue, USD Million, 2021 – 2033)
- Sub-6 GHz
- 24-39 GHz
- Above 39 GHz
- Demography Outlook (Volume, Thousand Units; Revenue, USD Million, 2021 – 2033)
- Urban
- Semi-Urban
- Rural
- Technology Outlook (Volume, Thousand Units; Revenue, USD Million, 2021 – 2033)
- 4G
- 5G
- Application Outlook (Volume, Thousand Units; Revenue, USD Million, 2021 – 2033)
- Residential
- Commercial
- Industrial
o Oil & Gas
o Mining
o Utility
o Others
- Government
- Regional Outlook (Volume, Thousand Units; Revenue, USD Million, 2021 – 2033)
- North America
o U.S.
o Canada
o Mexico
- Europe
o Germany
o UK
o France
- Asia Pacific
o China
o India
o Japan
o South Korea
o Philippines
- Latin America
o Brazil
- Middle East & Africa (MEA)
o UAE
o Kingdom of Saudi Arabia (KSA)
o South Africa
Table of Contents
Chapter 1. Methodology and Scope
1.1. Market Segmentation & Scope
1.2. Market Definitions
1.3. Research Methodology
1.3.1. Information Procurement
1.3.2. Information or Data Analysis
1.3.3. Market Formulation & Data Visualization
1.3.4. Data Validation & Publishing
1.4. Research Scope and Assumptions
1.4.1. List of Data Sources
Chapter 2. Executive Summary
2.1. Market Outlook
2.2. Segmental Outlook
2.3. Competitive Landscape Snapshot
Chapter 3. Market Variables, Trends, and Scope
3.1. Market Introduction/Lineage Outlook
3.2. Industry Value Chain Analysis
3.3. Market Dynamics
3.3.1. Market Driver Impact Analysis
3.3.2. Market Challenge Impact Analysis
3.3.3. Market Opportunity Impact Analysis
3.4. Fixed Wireless Access Market Analysis Tools
3.4.1. Porter’s Analysis
3.4.1.1. Bargaining power of the suppliers
3.4.1.2. Bargaining power of the buyers
3.4.1.3. Threats of substitution
3.4.1.4. Threats from new entrants
3.4.1.5. Competitive rivalry
3.4.2. PESTEL Analysis
3.4.2.1. Political landscape
3.4.2.2. Economic and Social landscape
3.4.2.3. Technological landscape
3.4.2.4. Environmental landscape
3.4.2.5. Legal landscape
Chapter 4. Fixed Wireless Access Market: Offering Estimates & Trend Analysis
4.1. Segment Dashboard
4.2. Fixed Wireless Access Market: Offering Movement Analysis, USD Million, 2025 & 2033
4.3. Hardware
4.3.1. Hardware Markets Revenue Estimates and Forecasts, 2021 – 2033 (USD Million, Thousand Units)
4.3.2. Customer Premises Equipment (CPE)
4.3.2.1. Customer premises equipment (CPE) markets revenue estimates and forecasts, 2021 – 2033 (USD Million, Thousand Units)
4.3.2.1.1. Indoor CPE markets revenue estimates and forecasts, 2021 – 2033 (USD Million, Thousand Units)
4.3.2.1.2. Outdoor CPE markets revenue estimates and forecasts, 2021 – 2033 (USD Million, Thousand Units)
4.3.3. Access Units
4.3.3.1. Access units markets revenue estimates and forecasts, 2021 – 2033 (USD Million, Thousand Units)
4.3.3.1.1. Femto cells markets revenue estimates and forecasts, 2021 – 2033 (USD Million, Thousand Units)
4.3.3.1.2. Pico cells markets revenue estimates and forecasts, 2021 – 2033 (USD Million, Thousand Units)
4.4. Services
4.4.1. Services Revenue Estimates and Forecasts, 2021 – 2033 (USD Million, Thousand Units)
Chapter 5. Fixed Wireless Access Market: Operating Frequency Estimates & Trend Analysis
5.1. Segment Dashboard
5.2. Fixed Wireless Access Market: Operating Frequency Movement Analysis, USD Million, 2025 & 2033
5.3. Sub-6 GHz
5.3.1. Sub-6 GHz Market Revenue Estimates and Forecasts, 2021 – 2033 (USD Million, Thousand Units)
5.4. 24-39 GHz
5.4.1. 24-39 GHz Market Revenue Estimates and Forecasts, 2021 – 2033 (USD Million, Thousand Units)
5.5. Above 39 GHz
5.5.1. Above 39 GHz Market Revenue Estimates and Forecasts, 2021 – 2033 (USD Million, Thousand Units)
Chapter 6. Fixed Wireless Access Market: Demography Estimates & Trend Analysis
6.1. Segment Dashboard
6.2. Fixed Wireless Access Market: Demography Movement Analysis, USD Million, 2025 & 2033
6.3. Urban
6.3.1. Urban Market Revenue Estimates and Forecasts, 2021 – 2033 (USD Million, Thousand Units)
6.4. Semi-Urban
6.4.1. Semi-Urban Revenue Estimates and Forecasts, 2021 – 2033 (USD Million, Thousand Units)
6.5. Rural
6.5.1. Rural Revenue Estimates and Forecasts, 2021 – 2033 (USD Million, Thousand Units)
Chapter 7. Fixed Wireless Access Market: Technology Estimates & Trend Analysis
7.1. Segment Dashboard
7.2. Fixed Wireless Access Market: Technology Movement Analysis, USD Million, 2025 & 2033
7.3. 4G
7.3.1. 4G Market Revenue Estimates and Forecasts, 2021 – 2033 (USD Million, Thousand Units)
7.4. 5G
7.4.1. 5G Revenue Estimates and Forecasts, 2021 – 2033 (USD Million, Thousand Units)
Chapter 8. Fixed Wireless Access Market: Technology Estimates & Trend Analysis
8.1. Residential
8.1.1. Residential Revenue Estimates and Forecasts, 2021 – 2033 (USD Million, Thousand Units)
8.2. Commercial
8.2.1. Commercial Revenue Estimates and Forecasts, 2021 – 2033 (USD Million, Thousand Units)
8.3. Industrial
8.3.1. Industrial Revenue Estimates and Forecasts, 2021 – 2033 (USD Million, Thousand Units)
8.3.2. Oil & Gas
8.3.2.1. Oil & gas markets revenue estimates and forecasts, 2021 – 2033 (USD Million, Thousand Units)
8.3.3. Mining
8.3.3.1. Mining markets revenue estimates and forecasts, 2021 – 2033 (USD Million, Thousand Units)
8.3.4. Utility
8.3.4.1. Utility markets revenue estimates and forecasts, 2021 – 2033 (USD Million, Thousand Units)
8.3.5. Others
8.3.5.1. Others markets revenue estimates and forecasts, 2021 – 2033 (USD Million, Thousand Units)
8.4. Government
8.4.1. Government Revenue Estimates and Forecasts, 2021 – 2033 (USD Million, Thousand Units)
Chapter 9. Fixed Wireless Access Market: Regional Estimates & Trend Analysis
9.1. Fixed Wireless Access Market Share, By Region, 2025 & 2033, USD Million
9.2. North America
9.2.1. North America fixed wireless access market estimates & forecasts, 2021 – 2033 (USD Million, Thousand Units)
9.2.2. U.S.
9.2.2.1. U.S. fixed wireless access market estimates & forecasts, 2021 – 2033 (USD Million, Thousand Units)
9.2.3. Canada
9.2.3.1. Canada fixed wireless access market estimates & forecasts, 2021 – 2033 (USD Million, Thousand Units)
9.2.4. Mexico
9.2.4.1. Mexico fixed wireless access market estimates & forecasts, 2021 – 2033 (USD Million, Thousand Units)
9.3. Europe
9.3.1. Europe fixed wireless access market estimates & forecasts, 2021 – 2033 (USD Million, Thousand Units)
9.3.2. U.K.
9.3.2.1. U.K. fixed wireless access market estimates & forecasts, 2021 – 2033 (USD Million, Thousand Units)
9.3.3. Germany
9.3.3.1. Germany fixed wireless access market estimates & forecasts, 2021 – 2033 (USD Million, Thousand Units)
9.3.4. France
9.3.4.1. France fixed wireless access market estimates & forecasts, 2021 – 2033 (USD Million, Thousand Units)
9.4. Asia Pacific
9.4.1. Asia Pacific fixed wireless access market estimates & forecasts, 2021 – 2033 (USD Million, Thousand Units)
9.4.2. China
9.4.2.1. China fixed wireless access market estimates & forecasts, 2021 – 2033 (USD Million, Thousand Units)
9.4.3. India
9.4.3.1. India fixed wireless access market estimates & forecasts, 2021 – 2033 (USD Million, Thousand Units)
9.4.4. Japan
9.4.4.1. Japan fixed wireless access market estimates & forecasts, 2021 – 2033 (USD Million, Thousand Units)
9.4.5. South Korea
9.4.5.1. South Korea fixed wireless access market estimates & forecasts, 2021 – 2033 (USD Million, Thousand Units)
9.4.6. Philippines
9.4.6.1. Philippines fixed wireless access market estimates & forecasts, 2021 – 2033 (USD Million, Thousand Units)
9.5. Latin America
9.5.1. Latin America fixed wireless access market estimates & forecasts, 2021 – 2033 (USD Million, Thousand Units)
9.5.2. Brazil
9.5.2.1. Brazil fixed wireless access market estimates & forecasts, 2021 – 2033 (USD Million, Thousand Units)
9.6. Middle East & Africa
9.6.1. Middle East & Africa fixed wireless access market estimates & forecasts, 2021 – 2033 (USD Million, Thousand Units)
9.6.2. The Kingdom of Saudi Arabia (KSA)
9.6.2.1. The Kingdom of Saudi Arabia (KSA) fixed wireless access market estimates & forecasts, 2021 – 2033 (USD Million, Thousand Units)
9.6.3. UAE
9.6.3.1. UAE fixed wireless access market estimates & forecasts, 2021 – 2033 (USD Million, Thousand Units)
9.6.4. South Arica
9.6.4.1. South Africa fixed wireless access market estimates & forecasts, 2021 – 2033 (USD Million, Thousand Units)
Chapter 10. Competitive Landscape
10.1. Recent Developments & Impact Analysis by Key Market Participants
10.2. Company Categorization
10.3. Company Market Positioning
10.4. Company Market Share Analysis
10.5. Company Heat Map Analysis
10.6. Strategy Mapping
10.6.1. Expansion
10.6.2. Mergers & Acquisition
10.6.3. Partnerships & Collaborations
10.6.4. New Product Launches
10.6.5. Research And Development
10.7. Company Profiles
10.7.1. Nokia Corporation
10.7.1.1. Participant’s Overview
10.7.1.2. Financial Performance
10.7.1.3. Product Benchmarking
10.7.1.4. Recent Developments
10.7.2. AT&T Inc.
10.7.2.1. Participant’s Overview
10.7.2.2. Financial Performance
10.7.2.3. Product Benchmarking
10.7.2.4. Recent Developments
10.7.3. T Mobile USA, Inc.
10.7.3.1. Participant’s Overview
10.7.3.2. Financial Performance
10.7.3.3. Product Benchmarking
10.7.3.4. Recent Developments
10.7.4. CommScope Inc.
10.7.4.1. Participant’s Overview
10.7.4.2. Financial Performance
10.7.4.3. Product Benchmarking
10.7.4.4. Recent Developments
10.7.5. Verizon Communications Inc.
10.7.5.1. Participant’s Overview
10.7.5.2. Financial Performance
10.7.5.3. Product Benchmarking
10.7.5.4. Recent Developments
10.7.6. Vodafone Group Plc
10.7.6.1. Participant’s Overview
10.7.6.2. Financial Performance
10.7.6.3. Product Benchmarking
10.7.6.4. Recent Developments
10.7.7. Huawei Technologies Co., Ltd.
10.7.7.1. Participant’s Overview
10.7.7.2. Financial Performance
10.7.7.3. Product Benchmarking
10.7.7.4. Recent Developments
10.7.8. Inseego Corp.
10.7.8.1. Participant’s Overview
10.7.8.2. Financial Performance
10.7.8.3. Product Benchmarking
10.7.8.4. Recent Developments
10.7.9. Telstra
10.7.9.1. Participant’s Overview
10.7.9.2. Financial Performance
10.7.9.3. Product Benchmarking
10.7.9.4. Recent Developments
10.7.10. FS.com
10.7.10.1. Participant’s Overview
10.7.10.2. Financial Performance
10.7.10.3. Product Benchmarking
10.7.10.4. Recent Developments
List of Tables
Table 1 Fixed wireless access market, 2021 – 2033 (USD Million, Thousand Units)
Table 2 Global market estimates and forecasts, by region, 2021 – 2033 (USD Million, Thousand Units)
Table 3 Global market estimates and forecasts, by offering, 2021 – 2033 (USD Million, Thousand Units)
Table 4 Global market estimates and forecasts, by operating frequency, 2021 – 2033 (USD Million, Thousand Units)
Table 5 Global market estimates and forecasts, by demography, 2021 – 2033 (USD Million, Thousand Units)
Table 6 Global market estimates and forecasts, by technology, 2021 – 2033 (USD Million, Thousand Units)
Table 7 Global market estimates and forecasts, by application, 2021 – 2033 (USD Million, Thousand Units)
Table 8 Hardware fixed wireless access market, by region, 2021 – 2033 (USD Million, Thousand Units)
Table 9 Customer premises equipment (CPE) fixed wireless access market, by region, 2021 – 2033 (USD Million, Thousand Units)
Table 10 Indoor CPE fixed wireless access market, by region, 2021 – 2033 (USD Million, Thousand Units)
Table 11 Outdoor CPE fixed wireless access market, by region, 2021 – 2033 (USD Million, Thousand Units)
Table 12 Access units fixed wireless access market, by region, 2021 – 2033 (USD Million, Thousand Units)
Table 13 Femto cells fixed wireless access market, by region, 2021 – 2033 (USD Million, Thousand Units)
Table 14 Pico cells fixed wireless access market, by region, 2021 – 2033 (USD Million, Thousand Units)
Table 15 Service fixed wireless access market, by region, 2021 – 2033 (USD Million, Thousand Units)
Table 16 Sub-6 GHz fixed wireless access market, by region, 2021 – 2033 (USD Million, Thousand Units)
Table 17 24-39 GHz fixed wireless access market, by region, 2021 – 2033 (USD Million, Thousand Units)
Table 18 Above 39 GHz fixed wireless access market, by region, 2021 – 2033 (USD Million, Thousand Units)
Table 19 Urban fixed wireless access market, by region, 2021 – 2033 (USD Million, Thousand Units)
Table 20 Semi-Urban fixed wireless access market, by region, 2021 – 2033 (USD Million, Thousand Units)
Table 21 Rural fixed wireless access market, by region, 2021 – 2033 (USD Million, Thousand Units)
Table 22 4G fixed wireless access market, by region, 2021 – 2033 (USD Million, Thousand Units)
Table 23 5G fixed wireless access market, by region, 2021 – 2033 (USD Million, Thousand Units)
Table 24 Residential fixed wireless access market, by region, 2021 – 2033 (USD Million, Thousand Units)
Table 25 Commercial fixed wireless access market, by region, 2021 – 2033 (USD Million, Thousand Units)
Table 26 Industrial fixed wireless access market, by region, 2021 – 2033 (USD Million, Thousand Units)
Table 27 Oil & gas fixed wireless access market, by region, 2021 – 2033 (USD Million, Thousand Units)
Table 28 Mining fixed wireless access market, by region, 2021 – 2033 (USD Million, Thousand Units)
Table 29 Utility fixed wireless access market, by region, 2021 – 2033 (USD Million, Thousand Units)
Table 30 Others fixed wireless access market, by region, 2021 – 2033 (USD Million, Thousand Units)
Table 31 Government fixed wireless access market, by region, 2021 – 2033 (USD Million, Thousand Units)
Table 32 North America fixed wireless access market, by offering, 2021 – 2033 (USD Million, Thousand Units)
Table 33 North America fixed wireless access market, by operating frequency, 2021 – 2033 (USD Million, Thousand Units)
Table 34 North America fixed wireless access market, by demography, 2021 – 2033 (USD Million, Thousand Units)
Table 35 North America fixed wireless access market, by technology, 2021 – 2033 (USD Million, Thousand Units)
Table 36 North America fixed wireless access market, by application, 2021 – 2033 (USD Million, Thousand Units)
Table 37 US fixed wireless access market, by offering, 2021 – 2033 (USD Million, Thousand Units)
Table 38 US fixed wireless access market, by operating frequency, 2021 – 2033 (USD Million, Thousand Units)
Table 39 US fixed wireless access market, by demography, 2021 – 2033 (USD Million, Thousand Units)
Table 40 US fixed wireless access market, by technology, 2021 – 2033 (USD Million, Thousand Units)
Table 41 US fixed wireless access market, by application, 2021 – 2033 (USD Million, Thousand Units)
Table 42 Canada fixed wireless access market, by offering, 2021 – 2033 (USD Million, Thousand Units)
Table 43 Canada fixed wireless access market, by operating frequency, 2021 – 2033 (USD Million, Thousand Units)
Table 44 Canada fixed wireless access market, by demography, 2021 – 2033 (USD Million, Thousand Units)
Table 45 Canada fixed wireless access market, by technology, 2021 – 2033 (USD Million, Thousand Units)
Table 46 Canada fixed wireless access market, by application, 2021 – 2033 (USD Million, Thousand Units)
Table 47 Mexico fixed wireless access market, by offering, 2021 – 2033 (USD Million, Thousand Units)
Table 48 Mexico fixed wireless access market, by operating frequency, 2021 – 2033 (USD Million, Thousand Units)
Table 49 Mexico fixed wireless access market, by demography, 2021 – 2033 (USD Million, Thousand Units)
Table 50 Mexico fixed wireless access market, by technology, 2021 – 2033 (USD Million, Thousand Units)
Table 51 Mexico fixed wireless access market, by application, 2021 – 2033 (USD Million, Thousand Units)
Table 52 Europe fixed wireless access market, by offering, 2021 – 2033 (USD Million, Thousand Units)
Table 53 Europe fixed wireless access market, by operating frequency, 2021 – 2033 (USD Million, Thousand Units)
Table 54 Europe fixed wireless access market, by demography, 2021 – 2033 (USD Million, Thousand Units)
Table 55 Europe fixed wireless access market, by technology, 2021 – 2033 (USD Million, Thousand Units)
Table 56 Europe fixed wireless access market, by application, 2021 – 2033 (USD Million, Thousand Units)
Table 57 UK fixed wireless access market, by offering, 2021 – 2033 (USD Million, Thousand Units)
Table 58 UK fixed wireless access market, by operating frequency, 2021 – 2033 (USD Million, Thousand Units)
Table 59 UK fixed wireless access market, by demography, 2021 – 2033 (USD Million, Thousand Units)
Table 60 UK fixed wireless access market, by technology, 2021 – 2033 (USD Million, Thousand Units)
Table 61 UK fixed wireless access market, by application, 2021 – 2033 (USD Million, Thousand Units)
Table 62 Germany fixed wireless access market, by offering, 2021 – 2033 (USD Million, Thousand Units)
Table 63 Germany fixed wireless access market, by operating frequency, 2021 – 2033 (USD Million, Thousand Units)
Table 64 Germany fixed wireless access market, by demography, 2021 – 2033 (USD Million, Thousand Units)
Table 65 Germany fixed wireless access market, by technology, 2021 – 2033 (USD Million, Thousand Units)
Table 66 Germany fixed wireless access market, by application, 2021 – 2033 (USD Million, Thousand Units)
Table 67 France fixed wireless access market, by offering, 2021 – 2033 (USD Million, Thousand Units)
Table 68 France fixed wireless access market, by operating frequency, 2021 – 2033 (USD Million, Thousand Units)
Table 69 France fixed wireless access market, by demography, 2021 – 2033 (USD Million, Thousand Units)
Table 70 France fixed wireless access market, by technology, 2021 – 2033 (USD Million, Thousand Units)
Table 71 France fixed wireless access market, by application, 2021 – 2033 (USD Million, Thousand Units)
Table 72 Asia Pacific fixed wireless access market, by offering, 2021 – 2033 (USD Million, Thousand Units)
Table 73 Asia Pacific fixed wireless access market, by operating frequency, 2021 – 2033 (USD Million, Thousand Units)
Table 74 Asia Pacific fixed wireless access market, by demography, 2021 – 2033 (USD Million, Thousand Units)
Table 75 Asia Pacific fixed wireless access market, by technology, 2021 – 2033 (USD Million, Thousand Units)
Table 76 Asia Pacific fixed wireless access market, by application, 2021 – 2033 (USD Million, Thousand Units)
Table 77 China fixed wireless access market, by offering, 2021 – 2033 (USD Million, Thousand Units)
Table 78 China fixed wireless access market, by operating frequency, 2021 – 2033 (USD Million, Thousand Units)
Table 79 China fixed wireless access market, by demography, 2021 – 2033 (USD Million, Thousand Units)
Table 80 China fixed wireless access market, by technology, 2021 – 2033 (USD Million, Thousand Units)
Table 81 China fixed wireless access market, by application, 2021 – 2033 (USD Million, Thousand Units)
Table 82 India fixed wireless access market, by offering, 2021 – 2033 (USD Million, Thousand Units)
Table 83 India fixed wireless access market, by operating frequency, 2021 – 2033 (USD Million, Thousand Units)
Table 84 India fixed wireless access market, by demography, 2021 – 2033 (USD Million, Thousand Units)
Table 85 India fixed wireless access market, by technology, 2021 – 2033 (USD Million, Thousand Units)
Table 86 India fixed wireless access market, by application, 2021 – 2033 (USD Million, Thousand Units)
Table 87 Japan fixed wireless access market, by offering, 2021 – 2033 (USD Million, Thousand Units)
Table 88 Japan fixed wireless access market, by operating frequency, 2021 – 2033 (USD Million, Thousand Units)
Table 89 Japan fixed wireless access market, by demography, 2021 – 2033 (USD Million, Thousand Units)
Table 90 Japan fixed wireless access market, by technology, 2021 – 2033 (USD Million, Thousand Units)
Table 91 Japan fixed wireless access market, by application, 2021 – 2033 (USD Million, Thousand Units)
Table 92 South Korea fixed wireless access market, by offering, 2021 – 2033 (USD Million, Thousand Units)
Table 93 South Korea fixed wireless access market, by operating frequency, 2021 – 2033 (USD Million, Thousand Units)
Table 94 South Korea fixed wireless access market, by demography, 2021 – 2033 (USD Million, Thousand Units)
Table 95 South Korea fixed wireless access market, by technology, 2021 – 2033 (USD Million, Thousand Units)
Table 96 South Korea fixed wireless access market, by application, 2021 – 2033 (USD Million, Thousand Units)
Table 97 Philippines fixed wireless access market, by offering, 2021 – 2033 (USD Million, Thousand Units)
Table 98 Philippines fixed wireless access market, by operating frequency, 2021 – 2033 (USD Million, Thousand Units)
Table 99 Philippines fixed wireless access market, by demography, 2021 – 2033 (USD Million, Thousand Units)
Table 100 Philippines fixed wireless access market, by technology, 2021 – 2033 (USD Million, Thousand Units)
Table 101 Philippines fixed wireless access market, by application, 2021 – 2033 (USD Million, Thousand Units)
Table 102 Latin America fixed wireless access market, by offering, 2021 – 2033 (USD Million, Thousand Units)
Table 103 Latin America fixed wireless access market, by operating frequency, 2021 – 2033 (USD Million, Thousand Units)
Table 104 Latin America fixed wireless access market, by demography, 2021 – 2033 (USD Million, Thousand Units)
Table 105 Latin America fixed wireless access market, by technology, 2021 – 2033 (USD Million, Thousand Units)
Table 106 Latin America fixed wireless access market, by application, 2021 – 2033 (USD Million, Thousand Units)
Table 107 Brazil fixed wireless access market, by offering, 2021 – 2033 (USD Million, Thousand Units)
Table 108 Brazil fixed wireless access market, by operating frequency, 2021 – 2033 (USD Million, Thousand Units)
Table 109 Brazil fixed wireless access market, by demography, 2021 – 2033 (USD Million, Thousand Units)
Table 110 Brazil fixed wireless access market, by technology, 2021 – 2033 (USD Million, Thousand Units)
Table 111 Brazil fixed wireless access market, by application, 2021 – 2033 (USD Million, Thousand Units)
Table 112 MEA fixed wireless access market, by offering, 2021 – 2033 (USD Million, Thousand Units)
Table 113 MEA fixed wireless access market, by operating frequency, 2021 – 2033 (USD Million, Thousand Units)
Table 114 MEA fixed wireless access market, by demography, 2021 – 2033 (USD Million, Thousand Units)
Table 115 MEA fixed wireless access market, by technology, 2021 – 2033 (USD Million, Thousand Units)
Table 116 MEA fixed wireless access market, by application, 2021 – 2033 (USD Million, Thousand Units)
Table 117 Kingdom of Saudi Arabia (KSA) fixed wireless access market, by offering, 2021 – 2033 (USD Million, Thousand Units)
Table 118 Kingdom of Saudi Arabia (KSA) fixed wireless access market, by operating frequency, 2021 – 2033 (USD Million, Thousand Units)
Table 119 Kingdom of Saudi Arabia (KSA) fixed wireless access market, by demography, 2021 – 2033 (USD Million, Thousand Units)
Table 120 Kingdom of Saudi Arabia (KSA) fixed wireless access market, by technology, 2021 – 2033 (USD Million, Thousand Units)
Table 121 Kingdom of Saudi Arabia (KSA) fixed wireless access market, by application, 2021 – 2033 (USD Million, Thousand Units)
Table 122 UAE fixed wireless access market, by offering, 2021 – 2033 (USD Million, Thousand Units)
Table 123 UAE fixed wireless access market, by operating frequency, 2021 – 2033 (USD Million, Thousand Units)
Table 124 UAE fixed wireless access market, by demography, 2021 – 2033 (USD Million, Thousand Units)
Table 125 UAE fixed wireless access market, by technology, 2021 – 2033 (USD Million, Thousand Units)
Table 126 UAE fixed wireless access market, by application, 2021 – 2033 (USD Million, Thousand Units)
Table 127 South Africa fixed wireless access market, by offering, 2021 – 2033 (USD Million, Thousand Units)
Table 128 South Africa fixed wireless access market, by operating frequency, 2021 – 2033 (USD Million, Thousand Units)
Table 129 South Africa fixed wireless access market, by demography, 2021 – 2033 (USD Million, Thousand Units)
Table 130 South Africa fixed wireless access market, by technology, 2021 – 2033 (USD Million, Thousand Units)
Table 131 South Africa fixed wireless access market, by application, 2021 – 2033 (USD Million, Thousand Units)
Table 132 Company Market Share, 2025
Table 133 Company Heat Map Analysis
Table 134 Key companies undergoing expansion
Table 135 Key companies undergoing collaborations
Table 136 Key companies undergoing new product launch
Table 137 Key companies undergoing mergers & acquisitions
Table 138 Key companies undergoing other strategies
List of Figures
Fig. 1 Fixed Wireless Access Market Segmentation
Fig. 2 Information procurement
Fig. 3 Data analysis models
Fig. 4 Market formulation and validation
Fig. 5 Data validating & publishing
Fig. 6 Market snapshot
Fig. 7 Segment snapshot
Fig. 8 Competitive landscape snapshot
Fig. 9 Parent market value, 2025 (USD Billion)
Fig. 10 Fixed wireless access market – industry value chain analysis
Fig. 11 Fixed wireless access market dynamics
Fig. 12 Fixed wireless access market: Porter’s analysis
Fig. 13 Fixed wireless access market: PESTEL analysis
Fig. 14 Fixed wireless access, by offering: key takeaways
Fig. 15 Fixed wireless access, by offering: market share, 2025 & 2033
Fig. 16 Fixed wireless access market estimates & forecasts, by hardware, 2021 – 2033 (USD Million, Thousand Units)
Fig. 17 Fixed wireless access market estimates & forecasts, by customer premises equipment (CPE), 2021 – 2033 (USD Million, Thousand Units)
Fig. 18 Fixed wireless access market estimates & forecasts, by indoor CPE, 2021 – 2033 (USD Million, Thousand Units)
Fig. 19 Fixed wireless access market estimates & forecasts, by outdoor CPE, 2021 – 2033 (USD Million, Thousand Units)
Fig. 20 Fixed wireless access market estimates & forecasts, by access units, 2021 – 2033 (USD Million, Thousand Units)
Fig. 21 Fixed wireless access market estimates & forecasts, by femto cells, 2021 – 2033 (USD Million, Thousand Units)
Fig. 22 Fixed wireless access market estimates & forecasts, by pico cells, 2021 – 2033 (USD Million, Thousand Units)
Fig. 23 Fixed wireless access market estimates & forecasts, by service, 2021 – 2033 (USD Million, Thousand Units)
Fig. 24 Fixed wireless access, by operating frequency: key takeaways
Fig. 25 Fixed wireless access, by operating frequency: market share, 2025 & 2033
Fig. 26 Fixed wireless access market estimates & forecasts, by sub-6 GHz, 2021 – 2033 (USD Million, Thousand Units)
Fig. 27 Fixed wireless access market estimates & forecasts, by 24-39 GHz, 2021 – 2033 (USD Million, Thousand Units)
Fig. 28 Fixed wireless access market estimates & forecasts, by above 39 GHz, 2021 – 2033 (USD Million, Thousand Units)
Fig. 29 Fixed wireless access, by demography: key takeaways
Fig. 30 Fixed wireless access, by demography: market share, 2025 & 2033
Fig. 31 Fixed wireless access market estimates & forecasts, by urban, 2021 – 2033 (USD Million, Thousand Units)
Fig. 32 Fixed wireless access market estimates & forecasts, by semi-urban, 2021 – 2033 (USD Million, Thousand Units)
Fig. 33 Fixed wireless access market estimates & forecasts, by rural, 2021 – 2033 (USD Million, Thousand Units)
Fig. 34 Fixed wireless access, by technology: key takeaways
Fig. 35 Fixed wireless access, by technology: market share, 2025 & 2033
Fig. 36 Fixed wireless access market estimates & forecasts, by 4G, 2021 – 2033 (USD Million, Thousand Units)
Fig. 37 Fixed wireless access market estimates & forecasts, by 5G, 2021 – 2033 (USD Million, Thousand Units)
Fig. 38 Fixed wireless access, by application: key takeaways
Fig. 39 Fixed wireless access, by application: market share, 2025 & 2033
Fig. 40 Fixed wireless access market estimates & forecasts, by residential, 2021 – 2033 (USD Million, Thousand Units)
Fig. 41 Fixed wireless access market estimates & forecasts, by commercial, 2021 – 2033 (USD Million, Thousand Units)
Fig. 42 Fixed wireless access market estimates & forecasts, by industrial, 2021 – 2033 (USD Million, Thousand Units)
Fig. 43 Fixed wireless access market estimates & forecasts,by oil & gas,2021 – 2033(USD Million, Thousand Units)
Fig. 44 Fixed wireless access market estimates & forecasts, by mining, 2021 – 2033 (USD Million, Thousand Units)
Fig. 45 Fixed wireless access market estimates & forecasts, by utility, 2021 – 2033 (USD Million, Thousand Units)
Fig. 46 Fixed wireless access market estimates & forecasts, by others, 2021 – 2033 (USD Million, Thousand Units)
Fig. 47 Fixed wireless access market estimates & forecasts, by government, 2021 – 2033 (USD Million, Thousand Units)
Fig. 48 North America fixed wireless access market, 2021 – 2033 (USD Million, Thousand Units)
Fig. 49 US fixed wireless access market, 2021 – 2033 (USD Million, Thousand Units)
Fig. 50 Canada fixed wireless access market, 2021 – 2033 (USD Million, Thousand Units)
Fig. 51 Mexico fixed wireless access market, 2021 – 2033 (USD Million, Thousand Units)
Fig. 52 Europe fixed wireless access market, 2021 – 2033 (USD Million, Thousand Units)
Fig. 53 UK fixed wireless access market, 2021 – 2033 (USD Million, Thousand Units)
Fig. 54 Germany fixed wireless access market, 2021 – 2033 (USD Million, Thousand Units)
Fig. 55 France fixed wireless access market, 2021 – 2033 (USD Million, Thousand Units)
Fig. 56 Asia Pacific fixed wireless access market, 2021 – 2033 (USD Million, Thousand Units)
Fig. 57 China fixed wireless access market, 2021 – 2033 (USD Million, Thousand Units)
Fig. 58 India fixed wireless access market, 2021 – 2033 (USD Million, Thousand Units)
Fig. 59 Japan fixed wireless access market, 2021 – 2033 (USD Million, Thousand Units)
Fig. 60 South Korea fixed wireless access market, 2021 – 2033 (USD Million, Thousand Units)
Fig. 61 Philippines fixed wireless access market, 2021 – 2033 (USD Million, Thousand Units)
Fig. 62 Latin America fixed wireless access market, 2021 – 2033 (USD Million, Thousand Units)
Fig. 63 Brazil fixed wireless access market, 2021 – 2033 (USD Million, Thousand Units)
Fig. 64 Middle East & Africa fixed wireless access market, 2021 – 2033 (USD Million, Thousand Units)
Fig. 65 Kingdom of Saudi Arabia (KSA) fixed wireless access market, 2021 – 2033 (USD Million, Thousand Units)
Fig. 66 UAE fixed wireless access market, 2021 – 2033 (USD Million, Thousand Units)
Fig. 67 South Africa fixed wireless access market, 2021 – 2033 (USD Million, Thousand Units) Key company categorization
Fig. 68 Company market positioning
Fig. 69 Company market share analysis, 2025
Fig. 70 Strategic framework