Enterprise Metaverse Market Size, Share & Trends Analysis Report By Component (Software, Hardware, Services), By Application (Virtual Collaboration, Training and Simulation, Product Design and Development), By End Use, By Region, And Segment Forecasts, 2026 - 2033
エンタープライズ メタバース市場 - コンポーネント別(ソフトウェア、ハードウェア、サービス)、用途別(仮想コラボレーション、トレーニングおよびシミュレーション、製品設計および開発)、エンドユーザー別、地域、セグメント別予測による市場規模、成長と動向分析レポート 2026-2033年
| 出版 | Grand View Research |
| 出版年月 | 2026年02月 |
| ページ数 | 150 |
| 価格 | 記載以外のライセンスについてはお問合せください |
| シングルユーザ | USD 4,950 |
| 種別 | 英文調査報告書 |
| 商品番号 | SMR-16688 |

世界のエンタープライズメタバース市場規模は、2025年には425億6000万米ドルと推定され、2033年までに6673億4000万米ドルに達するとGrand View Researchでは予測しています。2026年から2033年にかけて年平均成長率(CAGR)41.1%で成長すると見込まれています。市場は、企業の急速なデジタルトランスフォーメーションに牽引され、着実に成長を続けている。組織は、AR、VR、デジタルツインといった没入型テクノロジーの導入をますます進めている。
主要市場動向とインサイト
- 北米のエンタープライズメタバース市場は、2025年に世界最大の収益シェア37.6%を占めました。
- 米国のエンタープライズメタバース業界は、2025年に北米最大の収益シェアを獲得しました。
- コンポーネント別に見ると、ソフトウェア分野が2025年に最大の収益シェア47.3%を占め、市場を牽引しました。
- アプリケーション別に見ると、トレーニングおよびシミュレーション分野が2025年に最大の収益シェア33.5%を占めました。
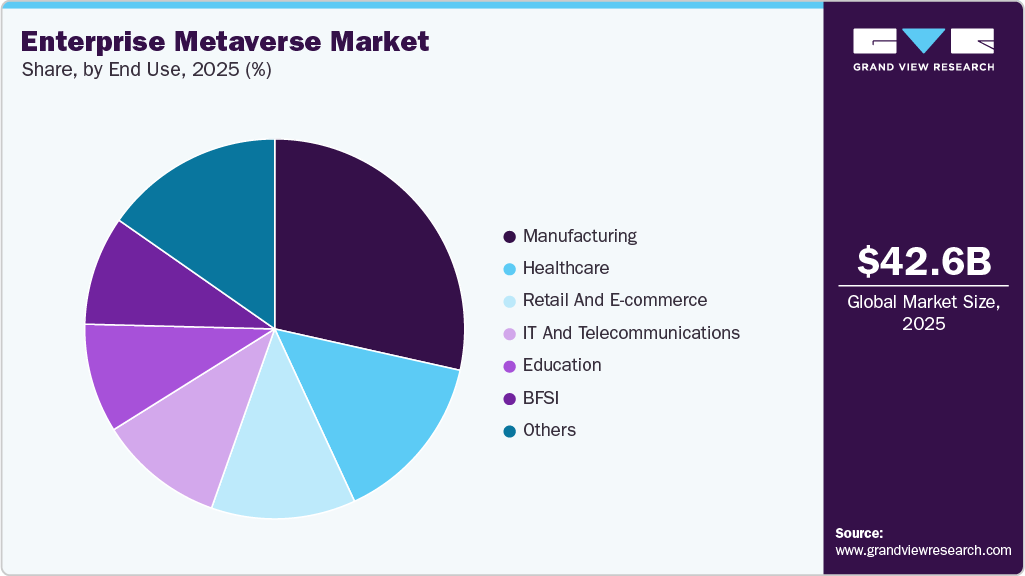
- エンドユーザー別に見ると、ヘルスケア分野は2026年から2033年にかけて年平均成長率(CAGR)45.2%で最も高い成長が見込まれています。
エンタープライズメタバース主要企業の動向
エンタープライズメタバース業界の主要企業には、Capgemini、Deloitte、Epic Games、IBM、Infosys、Meta Platformsなどが挙げられます。各社は、業界における競争優位性を獲得するため、顧客基盤の拡大に注力しています。そのため、主要企業は、合併・買収や他社との提携など、様々な戦略的取り組みを進めています。
- IBMは、没入型テクノロジーをクラウド、AI、データプラットフォームと統合することで、エンタープライズメタバース市場における地位を確立しています。同社は、大企業向けに仮想コラボレーション、デジタルワークプレイス、没入型学習環境の提供に注力しています。IBMは、AR/VRおよび3D環境を活用して、従業員研修、オンボーディング、リモートコラボレーションを強化しています。IBMのエンタープライズメタバースへの取り組みは、ハイブリッドワークモデルや、安全で拡張性の高いビジネス環境と密接に連携しています。また、IBMは、企業が特定のビジネスプロセスに合わせたカスタマイズされた仮想体験を構築できるよう支援しています。
- Infosysは、没入型デジタル体験と仮想ワークプレイスソリューションを通じて、エンタープライズメタバース業界における存在感を強化しています。 Infosysは、従業員研修、仮想コラボレーション、顧客エンゲージメントといった分野で企業を支援しています。AR/VR、クラウド、デジタルプラットフォームを組み合わせ、拡張性の高い企業向けメタバース環境を構築します。その取り組みは、生産性向上、スキル開発、そして顧客体験に基づく変革を重視しています。また、Infosysはグローバルな顧客と協力し、業界を問わず活用できる企業向けメタバースのユースケースを設計しています。
本レポートは、世界、地域、国レベルでの収益成長を予測し、2021年から2033年までの各サブセグメントにおける最新の業界動向を分析しています。本調査において、Grand View Researchは、世界のエンタープライズメタバース市場レポートをコンポーネント、用途、エンドユース、地域に基づいてセグメント化しました。
Enterprise Metaverse Market Summary
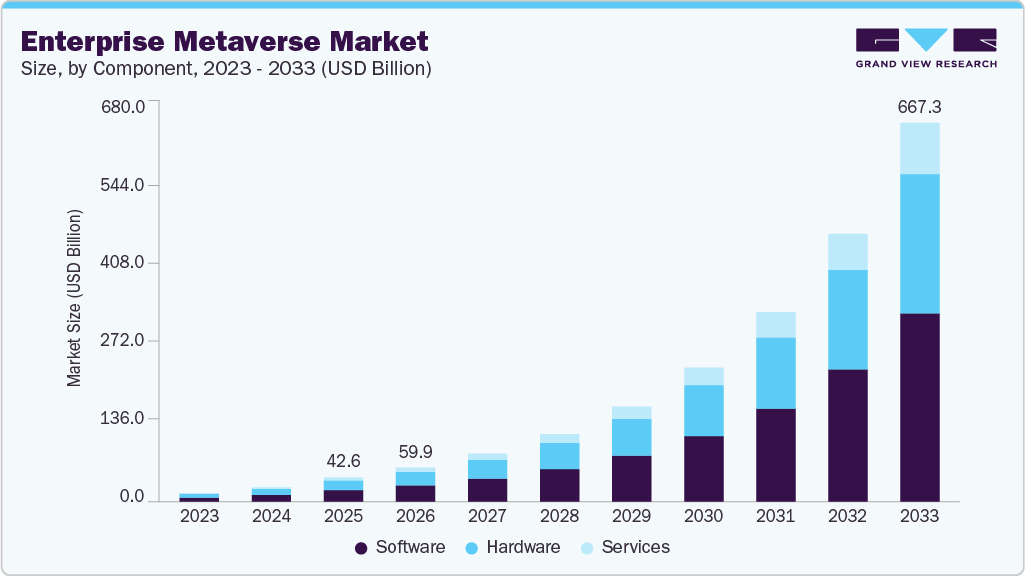
The global enterprise metaverse market size was estimated at USD 42.56 billion in 2025 and is projected to reach USD 667.34 billion by 2033, growing at a CAGR of 41.1% from 2026 to 2033. The market is experiencing steady growth driven by rapid enterprise digital transformation. Organizations are increasingly adopting immersive technologies such as AR, VR, and digital twins.
enterprise-metaverse-market-size
Key Market Trends & Insights
- The North Americaenterprise metaverse market held the largest global revenue share of 37.6% in 2025.
- The enterprise metaverse industry in the U.S. led North America with the largest revenue share in 2025.
- By component, the software segment led the market with the largest revenue share of 47.3% in 2025.
- By application, the training and simulation segment held the largest revenue share of 33.5% in 2025.
- By end use, the healthcare segment is expected to grow at the fastest CAGR of 45.2% from 2026 to 2033.
Market Size & Forecast
- 2025 Market Size: USD 42.56 Billion
- 2033 Projected Market Size: USD 667.34 Billion
- CAGR (2026-2033): 41.1%
- North America: Largest market in 2025
- Asia Pacific: Fastest market in 2025
These technologies are being used to improve collaboration, employee training, and operational efficiency. Enterprises are leveraging virtual environments to enhance productivity and decision-making. As digital adoption continues to rise, demand for enterprise metaverse solutions is expected to grow steadily. The increasing adoption of immersive, avatar-driven collaboration in the workplace is driving the enterprise metaverse market. Organizations are using 3D virtual environments for meetings, training, and events, boosting demand for collaboration platforms. Companies are expanding their use of spatial computing and digital identity solutions to enhance remote teamwork. Virtual experiences are improving productivity and employee engagement, encouraging wider enterprise adoption. This growth is creating opportunities for software, hardware, and service providers in the enterprise metaverse ecosystem. For instance, in December 2025, Microsoft launched Immersive Events in Teams as a generally available feature
This enables organizations to host 3D virtual environments where participants can interact as avatars for meetings, training sessions, and events.
Enterprises are increasingly using immersive virtual environments to enhance employee training and upskilling. Companies adopt these platforms for onboarding, compliance, and skills development programs. Employees can practice tasks safely and interactively in realistic 3D settings, improving engagement and knowledge retention. These environments also support remote and hybrid teams by replicating in-office collaboration and fostering team cohesion. Overall, this approach strengthens workforce capabilities, accelerates professional development, and drives enterprise metaverse adoption. For instance, in January 2024, Microsoft launched Microsoft Mesh, which became generally available within Microsoft Teams, providing mixed-reality collaboration. The platform enables enterprise users to collaborate in shared 3D virtual spaces for meetings, interactive training, and project work, enhancing communication and teamwork across remote and hybrid work environments.
The enterprise metaverse is increasingly applied to product visualization, design reviews, and marketing experiences. Teams can co-create in 3D, improving collaboration across locations. Virtual environments allow stakeholders to visualize prototypes before physical production. Companies can engage clients or partners in interactive settings, enhancing communication and feedback. Marketing campaigns within immersive spaces enable businesses to showcase products in engaging ways. This approach helps increase customer engagement and shorten sales cycles. Adoption is steadily growing as organizations focus on innovative and impactful customer experiences.
Component Insights
The Software segment dominated the global enterprise metaverse industry, accounting for a revenue share of 47.3% in 2025, showing its widespread use across enterprise applications. It supports collaboration, training, and product design platforms, enabling teams to work efficiently across geographies and improve overall productivity. The strong performance of software reflects its ability to create scalable, flexible virtual environments, enabling businesses to implement metaverse initiatives without the heavy physical infrastructure. Enterprises use these platforms to enhance employee engagement, streamline workflows, and accelerate project timelines, delivering clear operational benefits. Software remains the most significant contributor to revenue and adoption within the enterprise metaverse ecosystem.
The services segment is expected to grow over the forecast period. Services enable companies to customize platforms, optimize workflows, and provide training, ensuring smooth adoption across departments. They complement software by enhancing usability and maximizing operational efficiency. As enterprises focus on immersive collaboration, training, and marketing, the services segment is becoming an essential part of the market ecosystem. This trend indicates that enterprises are relying more on expertise and support to implement metaverse solutions successfully.
Application Insights
The training and simulation segment dominated the global enterprise metaverse market in 2025, due to widespread adoption across industries such as manufacturing, healthcare, and defense. Organizations increasingly use immersive virtual environments to deliver safe, repeatable, and cost-effective training for complex, high-risk operations. Virtual simulations helped reduce operational downtime and minimize safety incidents compared to traditional training methods. At the same time, the use of advanced technologies such as VR, AI, and digital twins improved realism and engagement in training programs. These tools allowed companies to track performance, assess skill gaps, and personalize learning experiences.
The marketing and advertising segment is growing steadily as companies seek more immersive and interactive ways to engage customers. Brands are using virtual environments to create experiential campaigns that allow users to interact with products before making purchase decisions. These experiences improve brand recall and customer engagement compared to traditional digital marketing channels. The rise of virtual showrooms, product launches, and branded events is further supporting adoption. Enterprises are also leveraging data from user interactions in virtual spaces to refine targeting and campaign effectiveness.
End Use Insights
Manufacturing dominated the enterprise metaverse industry in 2025, due to its strong need for efficiency, precision, and cost optimization. Manufacturers widely adopted virtual environments for process simulation, factory layout planning, and equipment testing before physical deployment. This approach reduced errors, material waste, and production downtime. The use of digital twins enabled real-time monitoring and optimization of production lines. Virtual training also helped upskill workers on complex machinery without disrupting operations. As a result, manufacturing emerged as the leading end-use segment by driving clear operational and financial benefits.
The healthcare segment is growing as providers increasingly adopt immersive technologies for training, treatment planning, and patient engagement. Virtual simulations are used to train medical professionals in complex procedures in a safe, controlled environment. Hospitals are also leveraging digital twins and 3D visualization for surgical planning and diagnostics. These tools help improve accuracy and reduce procedural risks. In addition, virtual environments support remote collaboration among clinicians and specialists. As healthcare systems focus on improving outcomes and efficiency, the adoption of metaverse-based solutions continues to rise.
Key Enterprise Metaverse Company Insights
Some of the key companies in the Enterprise Metaverse industry include Capgemini, Deloitte, Epic Games, Inc., IBM Corporation, Infosys Limited, Meta Platforms, and others. Organizations are focusing on increasing their customer base to gain a competitive edge in the industry. Therefore, key players are taking several strategic initiatives, such as mergers and acquisitions, and partnerships with other major companies.
- IBM Corporation is advancing in the enterprise metaverse market by integrating immersive technologies with cloud, AI, and data platforms. The company focuses on virtual collaboration, digital workplaces, and immersive learning environments for large enterprises. IBM leverages AR/VR and 3D environments to enhance employee training, onboarding, and remote collaboration. Its enterprise metaverse efforts align closely with hybrid work models and secure, scalable business environments. IBM also supports enterprises in building customized virtual experiences tailored to specific business processes.
- Infosys Limited is strengthening its presence in the enterprise metaverse industry through immersive digital experiences and virtual workplace solutions. The company supports enterprises in areas such as employee training, virtual collaboration, and customer engagement. Infosys combines AR/VR, cloud, and digital platforms to create scalable enterprise-focused metaverse environments. Its initiatives emphasize productivity, skill development, and experience-driven transformation. Infosys also collaborates with global clients to design industry-agnostic enterprise metaverse use cases.
Key Enterprise Metaverse Companies:
The following key companies have been profiled for this study on the enterprise metaverse market.
- Accenture
- Capgemini
- Deloitte
- Epic Games, Inc.
- IBM
- Infosys Limited
- Meta Platforms
- Microsoft
- Tata Consultancy Services (TCS)
- Unity Technologies
Recent Developments
- In March 2024, Microsoft and NVIDIA Corporation expanded their partnership to integrate NVIDIA’s advanced AI, accelerated computing, and Omniverse technologies across Azure AI, Microsoft Azure, Microsoft Fabric, and Microsoft 365, enabling enterprises to build and deploy generative AI at scale. This partnership also enables industrial digitalization and immersive 3D digital twin use cases through NVIDIA Omniverse Cloud APIs on Azure, alongside enhancements to Microsoft Copilot powered by NVIDIA AI platforms.
- In June 2023, Accenture and Microsoft expanded their long-standing partnership to help organizations responsibly adopt and scale generative AI using Microsoft Azure, Azure OpenAI Service, and Microsoft 365 Copilot across enterprise functions. The partnership focuses on industry-specific AI solutions spanning financial services, healthcare, supply chain, security, and customer operations to drive productivity, efficiency, and business transformation.
Enterprise Metaverse Market Report Scope
| Report Attribute | Details |
| Market size value in 2026 | USD 59.87 billion |
| Revenue forecast in 2033 | USD 667.34 billion |
| Growth rate | CAGR of 41.1% from 2026 to 2033 |
| Base year for estimation | 2025 |
| Historical data | 2021 – 2024 |
| Forecast period | 2026 – 2033 |
| Quantitative units | Revenue in USD million/billion and CAGR from 2026 to 2033 |
| Report coverage | Revenue forecast, company ranking, competitive landscape, growth factors, and trends |
| Segments covered | Component, application, end use, region |
| Regional scope | North America; Europe; Asia Pacific; Latin America; MEA |
| Country scope | U.S.; Canada; Mexico; UK; Germany; France; China; Japan; India; South Korea; Australia; Brazil; KSA; UAE; South Africa |
| Key companies profiled | Accenture; Capgemini; Deloitte; Epic Games, Inc.; IBM; Infosys Limited; Meta Platforms; Microsoft; Tata Consultancy Services (TCS); Unity Technologies |
| Customization scope | Free report customization (equivalent up to 8 analysts working days) with purchase. Addition or alteration to country, regional & segment scope. |
Global Enterprise Metaverse Market Report Segmentation
This report forecasts revenue growth at the global, regional, and country levels and provides an analysis of the latest industry trends in each of the sub-segments from 2021 to 2033. For this study, Grand View Research has segmented the global enterprise metaverse market report based on component, application, end use, and region.
- Component Outlook (Revenue, USD Million, 2021 – 2033)
- Software
- Hardware
- Services
- Application Outlook (Revenue, USD Million, 2021 – 2033)
- Virtual Collaboration
- Training and Simulation
- Product Design and Development
- Marketing and Advertising
- Remote Work
- End Use Outlook (Revenue, USD Million, 2021 – 2033)
- BFSI
- Healthcare
- Retail and E-commerce
- Manufacturing
- IT & Telecommunication
- Education
- Others
- Regional Outlook (Revenue, USD Million, 2021 – 2033)
- North America
- U.S.
- Canada
- Mexico
- Europe
- UK
- Germany
- France
- Asia Pacific
- China
- Japan
- India
- South Korea
- Australia
- Latin America
- Brazil
- Middle East and Africa (MEA)
- KSA
- UAE
- South Africa
- North America
Table of Contents
Chapter 1. Methodology and Scope
1.1. Market Segmentation and Scope
1.2. Market Definition
1.3. Research Methodology
1.3.1. Information Procurement
1.3.2. Information or Data Analysis
1.3.3. Market Formulation & Data Visualization
1.3.4. Data Validation & Publishing
1.4. Research Scope and Assumptions
1.4.1. List of Data Sources
Chapter 2. Executive Summary
2.1. Market Outlook
2.2. Segment Outlook
2.3. Competitive Insights
Chapter 3. Enterprise Metaverse Market Variables, Trends, & Scope
3.1. Market Introduction/Lineage Outlook
3.2. Market Dynamics
3.2.1. Market Driver Analysis
3.2.2. Market Restraint Analysis
3.2.3. Industry Challenge
3.3. Enterprise Metaverse Market Analysis Tools
3.3.1. Porter’s Analysis
3.3.2. PESTEL Analysis
Chapter 4. Enterprise Metaverse Market: Component Estimates & Trend Analysis
4.1. Segment Dashboard
4.2. Enterprise Metaverse Market: Component Movement Analysis, 2025 & 2033 (USD Million)
4.3. Software
4.3.1. Software Enterprise Metaverse Market Revenue Estimates and Forecasts, 2021 – 2033 (USD million)
4.4. Hardware
4.4.1. Hardware Enterprise Metaverse Market Revenue Estimates and Forecasts, 2021 – 2033 (USD million)
4.5. Services
4.5.1. Services Enterprise Metaverse Market Revenue Estimates and Forecasts, 2021 – 2033 (USD million)
Chapter 5. Enterprise Metaverse Market: Application Estimates & Trend Analysis
5.1. Segment Dashboard
5.2. Enterprise Metaverse Market: Application Movement Analysis, 2025 & 2033 (USD Million)
5.3. Virtual Collaboration
5.3.1. Virtual Collaboration Enterprise Metaverse Market Revenue Estimates and Forecasts, 2021 – 2033 (USD million)
5.4. Training and Simulation
5.4.1. Training and Simulation Enterprise Metaverse Market Revenue Estimates and Forecasts, 2021 – 2033 (USD million)
5.5. Product Design and Development
5.5.1. Product Design and Development Enterprise Metaverse Market Revenue Estimates and Forecasts, 2021 – 2033 (USD million)
5.6. Marketing and Advertising
5.6.1. Marketing and Advertising Enterprise Metaverse Market Revenue Estimates and Forecasts, 2021 – 2033 (USD million)
5.7. Remote Work
5.7.1. Remote Work Enterprise Metaverse Market Revenue Estimates and Forecasts, 2021 – 2033 (USD million)
Chapter 6. Enterprise Metaverse Market: End Use Estimates & Trend Analysis
6.1. Segment Dashboard
6.2. Enterprise Metaverse Market: End Use Movement Analysis, 2025 & 2033 (USD Million)
6.3. BFSI
6.3.1. BFSI Enterprise Metaverse Market Revenue Estimates and Forecasts, 2021 – 2033 (USD million)
6.4. Healthcare
6.4.1. Healthcare Enterprise Metaverse Market Revenue Estimates and Forecasts, 2021 – 2033 (USD million)
6.5. Retail and E-commerce
6.5.1. Retail and E-commerce Enterprise Metaverse Market Revenue Estimates and Forecasts, 2021 – 2033 (USD million)
6.6. Manufacturing
6.6.1. Manufacturing Enterprise Metaverse Market Revenue Estimates and Forecasts, 2021 – 2033 (USD million)
6.7. IT & Telecommunication
6.7.1. IT & Telecommunication Enterprise Metaverse Market Revenue Estimates and Forecasts, 2021 – 2033 (USD million)
6.8. Education
6.8.1. Education Enterprise Metaverse Market Revenue Estimates and Forecasts, 2021 – 2033 (USD million)
6.9. Others
6.9.1. Others Enterprise Metaverse Market Revenue Estimates and Forecasts, 2021 – 2033 (USD million)
Chapter 7. Enterprise Metaverse Market: Regional Estimates & Trend Analysis
7.1. Enterprise Metaverse Market Share, By Region, 2025 & 2033 (USD Million)
7.2. North America
7.2.1. North America Enterprise Metaverse Market Estimates and Forecasts, 2021 – 2033 (USD million)
7.2.2. U.S.
7.2.2.1. U.S. Enterprise Metaverse Market Estimates and Forecasts, 2021 – 2033 (USD million)
7.2.3. Canada
7.2.3.1. Canada Enterprise Metaverse Market Estimates and Forecasts, 2021 – 2033 (USD million)
7.2.4. Mexico
7.2.4.1. Mexico Enterprise Metaverse Market Estimates and Forecasts, 2021 – 2033 (USD million)
7.3. Europe
7.3.1. Europe Enterprise Metaverse Market Estimates and Forecasts, 2021 – 2033 (USD million)
7.3.2. UK
7.3.2.1. UK Enterprise Metaverse Market Estimates and Forecasts, 2021 – 2033 (USD million)
7.3.3. Germany
7.3.3.1. Germany Enterprise Metaverse Market Estimates and Forecasts, 2021 – 2033 (USD million)
7.3.4. France
7.3.4.1. France Enterprise Metaverse Market Estimates and Forecasts, 2021 – 2033 (USD million)
7.4. Asia Pacific
7.4.1. Asia Pacific Enterprise Metaverse Market Estimates and Forecasts, 2021 – 2033 (USD million)
7.4.2. China
7.4.2.1. China Enterprise Metaverse Market Estimates and Forecasts, 2021 – 2033 (USD million)
7.4.3. Japan
7.4.3.1. Japan Enterprise Metaverse Market Estimates and Forecasts, 2021 – 2033 (USD million)
7.4.4. India
7.4.4.1. India Enterprise Metaverse Market Estimates and Forecasts, 2021 – 2033 (USD million)
7.4.5. South Korea
7.4.5.1. South Korea Enterprise Metaverse Market Estimates and Forecasts, 2021 – 2033 (USD million)
7.4.6. Australia
7.4.6.1. Australia Enterprise Metaverse Market Estimates and Forecasts, 2021 – 2033 (USD million)
7.5. Latin America
7.5.1. Latin America Enterprise Metaverse Market Estimates and Forecasts, 2021 – 2033 (USD million)
7.5.2. Brazil
7.5.2.1. Brazil Enterprise Metaverse Market Estimates and Forecasts, 2021 – 2033 (USD million)
7.6. Middle East and Africa
7.6.1. Middle East and Africa Enterprise Metaverse Market Estimates and Forecasts, 2021 – 2033 (USD million)
7.6.2. KSA
7.6.2.1. KSA Enterprise Metaverse Market Estimates and Forecasts, 2021 – 2033 (USD million)
7.6.3. UAE
7.6.3.1. UAE Enterprise Metaverse Market Estimates and Forecasts, 2021 – 2033 (USD million)
7.6.4. South Africa
7.6.4.1. South Africa Enterprise Metaverse Market Estimates and Forecasts, 2021 – 2033 (USD million)
Chapter 8. Competitive Landscape
8.1. Company Categorization
8.2. Company Market Positioning
8.3. Participant’s Overview
8.4. Financial Performance
8.5. Component Benchmarking
8.6. Company Heat Map Analysis
8.7. Strategy Mapping
8.8. Company Profiles/Listing
8.8.1. Accenture
8.8.1.1. Participant’s Overview
8.8.1.2. Financial Performance
8.8.1.3. Product Benchmarking
8.8.1.4. Recent Developments
8.8.2. Capgemini
8.8.2.1. Participant’s Overview
8.8.2.2. Financial Performance
8.8.2.3. Product Benchmarking
8.8.2.4. Recent Developments
8.8.3. Deloitte
8.8.3.1. Participant’s Overview
8.8.3.2. Financial Performance
8.8.3.3. Product Benchmarking
8.8.3.4. Recent Developments
8.8.4. Epic Games, Inc.
8.8.4.1. Participant’s Overview
8.8.4.2. Financial Performance
8.8.4.3. Product Benchmarking
8.8.4.4. Recent Developments
8.8.5. IBM Corporation
8.8.5.1. Participant’s Overview
8.8.5.2. Financial Performance
8.8.5.3. Product Benchmarking
8.8.5.4. Recent Developments
8.8.6. Infosys Limited
8.8.6.1. Participant’s Overview
8.8.6.2. Financial Performance
8.8.6.3. Product Benchmarking
8.8.6.4. Recent Developments
8.8.7. Meta Platforms
8.8.7.1. Participant’s Overview
8.8.7.2. Financial Performance
8.8.7.3. Product Benchmarking
8.8.7.4. Recent Developments
8.8.8. Microsoft
8.8.8.1. Participant’s Overview
8.8.8.2. Financial Performance
8.8.8.3. Product Benchmarking
8.8.8.4. Recent Developments
8.8.9. Tata Consultancy Services (TCS)
8.8.9.1. Participant’s Overview
8.8.9.2. Financial Performance
8.8.9.3. Product Benchmarking
8.8.9.4. Recent Developments
8.8.10. Unity Technologies
8.8.10.1. Participant’s Overview
8.8.10.2. Financial Performance
8.8.10.3. Product Benchmarking
8.8.10.4. Recent Developments
List of Tables
Table 1 Global Enterprise Metaverse Market estimates and forecasts, by region, 2021 – 2033 (USD Million)
Table 2 Global Enterprise Metaverse Market estimates and forecasts, by Component, 2021 – 2033 (USD Million)
Table 3 Global Enterprise Metaverse Market estimates and forecasts, by Application, 2021 – 2033 (USD Million)
Table 4 Global Enterprise Metaverse Market estimates and forecasts, by End Use, 2021 – 2033 (USD Million)
Table 5 North America Enterprise Metaverse Market estimates and forecasts, by country, 2021 – 2033 (USD Million)
Table 6 North America Enterprise Metaverse Market estimates and forecasts, by Component, 2021 – 2033 (USD Million)
Table 7 North America Enterprise Metaverse Market estimates and forecasts, by Application, 2021 – 2033 (USD Million)
Table 8 North America Enterprise Metaverse Market estimates and forecasts, by End Use, 2021 – 2033 (USD Million)
Table 9 U.S. Enterprise Metaverse Market estimates and forecasts, by Component, 2021 – 2033 (USD Million)
Table 10 U.S. Enterprise Metaverse Market estimates and forecasts, by Application, 2021 – 2033 (USD Million)
Table 11 U.S. Enterprise Metaverse Market estimates and forecasts, by End Use, 2021 – 2033 (USD Million)
Table 12 Canada Enterprise Metaverse Market estimates and forecasts, by Component, 2021 – 2033 (USD Million)
Table 13 Canada Enterprise Metaverse Market estimates and forecasts, by Application, 2021 – 2033 (USD Million)
Table 14 Canada Enterprise Metaverse Market estimates and forecasts, by End Use, 2021 – 2033 (USD Million)
Table 15 Mexico Enterprise Metaverse Market estimates and forecasts, by Component, 2021 – 2033 (USD Million)
Table 16 Mexico Enterprise Metaverse Market estimates and forecasts, by Application, 2021 – 2033 (USD Million)
Table 17 Mexico Enterprise Metaverse Market estimates and forecasts, by End Use, 2021 – 2033 (USD Million)
Table 18 Europe Enterprise Metaverse Market estimates and forecasts, by country, 2021 – 2033 (USD Million)
Table 19 Europe Enterprise Metaverse Market estimates and forecasts, by Component, 2021 – 2033 (USD Million)
Table 20 Europe Enterprise Metaverse Market estimates and forecasts, by Application, 2021 – 2033 (USD Million)
Table 21 Europe Enterprise Metaverse Market estimates and forecasts, by End Use, 2021 – 2033 (USD Million)
Table 22 UK Enterprise Metaverse Market estimates and forecasts, by Component, 2021 – 2033 (USD Million)
Table 23 UK Enterprise Metaverse Market estimates and forecasts, by Application, 2021 – 2033 (USD Million)
Table 24 UK Enterprise Metaverse Market estimates and forecasts, by End Use, 2021 – 2033 (USD Million)
Table 25 Germany Enterprise Metaverse Market estimates and forecasts, by Component, 2021 – 2033 (USD Million)
Table 26 Germany Enterprise Metaverse Market estimates and forecasts, by Application, 2021 – 2033 (USD Million)
Table 27 Germany Enterprise Metaverse Market estimates and forecasts, by End Use, 2021 – 2033 (USD Million)
Table 28 France Enterprise Metaverse Market estimates and forecasts, by Component, 2021 – 2033 (USD Million)
Table 29 France Enterprise Metaverse Market estimates and forecasts, by Application, 2021 – 2033 (USD Million)
Table 30 France Enterprise Metaverse Market estimates and forecasts, by End Use, 2021 – 2033 (USD Million)
Table 31 Asia Pacific Enterprise Metaverse Market estimates and forecasts, by country, 2021 – 2033 (USD Million)
Table 32 Asia Pacific Enterprise Metaverse Market estimates and forecasts, by Component, 2021 – 2033 (USD Million)
Table 33 Asia Pacific Enterprise Metaverse Market estimates and forecasts, by Application, 2021 – 2033 (USD Million)
Table 34 Asia Pacific Enterprise Metaverse Market estimates and forecasts, by End Use, 2021 – 2033 (USD Million)
Table 35 China Enterprise Metaverse Market estimates and forecasts, by Component, 2021 – 2033 (USD Million)
Table 36 China Enterprise Metaverse Market estimates and forecasts, by Application, 2021 – 2033 (USD Million)
Table 37 China Enterprise Metaverse Market estimates and forecasts, by End Use, 2021 – 2033 (USD Million)
Table 38 Japan Enterprise Metaverse Market estimates and forecasts, by Component, 2021 – 2033 (USD Million)
Table 39 Japan Enterprise Metaverse Market estimates and forecasts, by Application, 2021 – 2033 (USD Million)
Table 40 Japan Enterprise Metaverse Market estimates and forecasts, by End Use, 2021 – 2033 (USD Million)
Table 41 India Enterprise Metaverse Market estimates and forecasts, by Component, 2021 – 2033 (USD Million)
Table 42 India Enterprise Metaverse Market estimates and forecasts, by Application, 2021 – 2033 (USD Million)
Table 43 India Enterprise Metaverse Market estimates and forecasts, by End Use, 2021 – 2033 (USD Million)
Table 44 Australia Enterprise Metaverse Market estimates and forecasts, by Component, 2021 – 2033 (USD Million)
Table 45 Australia Enterprise Metaverse Market estimates and forecasts, by Application, 2021 – 2033 (USD Million)
Table 46 Australia Enterprise Metaverse Market estimates and forecasts, by End Use, 2021 – 2033 (USD Million)
Table 47 South Korea Enterprise Metaverse Market estimates and forecasts, by Component, 2021 – 2033 (USD Million)
Table 48 South Korea Enterprise Metaverse Market estimates and forecasts, by Application, 2021 – 2033 (USD Million)
Table 49 South Korea Enterprise Metaverse Market estimates and forecasts, by End Use, 2021 – 2033 (USD Million)
Table 50 Latin America Enterprise Metaverse Market estimates and forecasts, by country, 2021 – 2033 (USD Million)
Table 51 Latin America Enterprise Metaverse Market estimates and forecasts, by Component, 2021 – 2033 (USD Million)
Table 52 Latin America Enterprise Metaverse Market estimates and forecasts, by Application, 2021 – 2033 (USD Million)
Table 53 Latin America Enterprise Metaverse Market estimates and forecasts, by End Use, 2021 – 2033 (USD Million)
Table 54 Brazil Enterprise Metaverse Market estimates and forecasts, by Component, 2021 – 2033 (USD Million)
Table 55 Brazil Enterprise Metaverse Market estimates and forecasts, by Application, 2021 – 2033 (USD Million)
Table 56 Brazil Enterprise Metaverse Market estimates and forecasts, by End Use, 2021 – 2033 (USD Million)
Table 57 Middle East & Africa Enterprise Metaverse Market estimates and forecasts, by country, 2021 – 2033 (USD Million)
Table 58 Middle East & Africa Enterprise Metaverse Market estimates and forecasts, by Component, 2021 – 2033 (USD Million)
Table 59 Middle East & Africa Enterprise Metaverse Market estimates and forecasts, by Application, 2021 – 2033 (USD Million)
Table 60 Middle East & Africa Enterprise Metaverse Market estimates and forecasts, by End Use, 2021 – 2033 (USD Million)
Table 61 Saudi Arabia Enterprise Metaverse Market estimates and forecasts, by Component, 2021 – 2033 (USD Million)
Table 62 Saudi Arabia Enterprise Metaverse Market estimates and forecasts, by Application, 2021 – 2033 (USD Million)
Table 63 Saudi Arabia Enterprise Metaverse Market estimates and forecasts, by End Use, 2021 – 2033 (USD Million)
Table 64 UAE Enterprise Metaverse Market estimates and forecasts, by Component, 2021 – 2033 (USD Million)
Table 65 UAE Enterprise Metaverse Market estimates and forecasts, by Application, 2021 – 2033 (USD Million)
Table 66 UAE Enterprise Metaverse Market estimates and forecasts, by End Use, 2021 – 2033 (USD Million)
Table 67 South Africa Enterprise Metaverse Market estimates and forecasts, by Component, 2021 – 2033 (USD Million)
Table 68 South Africa Enterprise Metaverse Market estimates and forecasts, by Application, 2021 – 2033 (USD Million)
Table 69 South Africa Enterprise Metaverse Market estimates and forecasts, by End Use, 2021 – 2033 (USD Million)
List of Figures
Fig. 1 Enterprise Metaverse Market segmentation
Fig. 2 Market research process
Fig. 3 Information procurement
Fig. 4 Primary research pattern
Fig. 5 Market research approaches
Fig. 6 Market formulation & validation
Fig. 7 Enterprise Metaverse Market snapshot
Fig. 8 Enterprise Metaverse Market segment snapshot
Fig. 9 Enterprise Metaverse Market competitive landscape snapshot
Fig. 10 Market driver impact analysis
Fig. 11 Market restraint impact analysis
Fig. 12 Enterprise Metaverse Market: Component outlook key takeaways (USD Million)
Fig. 13 Enterprise Metaverse Market: Component movement analysis 2025 & 2033 (USD Million)
Fig. 14 Software Market revenue estimates and forecasts, 2021 – 2033 (USD Million)
Fig. 15 Hardware Market revenue estimates and forecasts, 2021 – 2033 (USD Million)
Fig. 16 Services Market revenue estimates and forecasts, 2021 – 2033 (USD Million)
Fig. 17 Enterprise Metaverse Market: Application outlook key takeaways (USD Million)
Fig. 18 Enterprise Metaverse Market: Application movement analysis 2025 & 2033 (USD Million)
Fig. 19 Virtual Collaboration Market revenue estimates and forecasts, 2021 – 2033 (USD Million)
Fig. 20 Training and Simulation Market revenue estimates and forecasts, 2021 – 2033 (USD Million)
Fig. 21 Product Design and Development Market revenue estimates and forecasts, 2021 – 2033 (USD Million)
Fig. 22 Marketing and Advertising Market revenue estimates and forecasts, 2021 – 2033 (USD Million)
Fig. 23 Remote Work Market revenue estimates and forecasts, 2021 – 2033 (USD Million)
Fig. 24 Enterprise Metaverse Market: End Use outlook key takeaways (USD Million)
Fig. 25 Enterprise Metaverse Market: End Use movement analysis 2025 & 2033 (USD Million)
Fig. 26 BFSI Market revenue estimates and forecasts, 2021 – 2033 (USD Million)
Fig. 27 Healthcare Market revenue estimates and forecasts, 2021 – 2033 (USD Million)
Fig. 28 Retail and E-commerce Market revenue estimates and forecasts, 2021 – 2033 (USD Million)
Fig. 29 Manufacturing Market revenue estimates and forecasts, 2021 – 2033 (USD Million)
Fig. 30 IT & Telecommunication Market revenue estimates and forecasts, 2021 – 2033 (USD Million)
Fig. 31 Education Market revenue estimates and forecasts, 2021 – 2033 (USD Million)
Fig. 32 Others Market revenue estimates and forecasts, 2021 – 2033 (USD Million)
Fig. 33 Regional Marketplace: Key takeaways
Fig. 34 Enterprise Metaverse Market: Regional outlook, 2025 & 2033, USD Million
Fig. 35 North America Enterprise Metaverse Market estimates and forecasts, 2021 – 2033 (USD Million)
Fig. 36 U.S. Enterprise Metaverse Market estimates and forecasts, 2021 – 2033 (USD Million)
Fig. 37 Canada Enterprise Metaverse Market estimates and forecasts, 2021 – 2033 (USD Million)
Fig. 38 Mexico Enterprise Metaverse Market estimates and forecasts, 2021 – 2033 (USD Million)
Fig. 39 Europe Enterprise Metaverse Market estimates and forecasts, 2021 – 2033 (USD Million)
Fig. 40 UK Enterprise Metaverse Market estimates and forecasts, 2021 – 2033 (USD Million)
Fig. 41 Germany Enterprise Metaverse Market estimates and forecasts, 2021 – 2033 (USD Million)
Fig. 42 France Enterprise Metaverse Market estimates and forecasts, 2021 – 2033 (USD Million)
Fig. 43 Asia Pacific Enterprise Metaverse Market estimates and forecasts, 2021 – 2033 (USD Million)
Fig. 44 China Enterprise Metaverse Market estimates and forecasts, 2021 – 2033 (USD Million)
Fig. 45 Japan Enterprise Metaverse Market estimates and forecasts, 2021 – 2033 (USD Million)
Fig. 46 India Enterprise Metaverse Market estimates and forecasts, 2021 – 2033 (USD Million)
Fig. 47 South Korea Enterprise Metaverse Market estimates and forecasts, 2021 – 2033 (USD Million)
Fig. 48 Australia Enterprise Metaverse Market estimates and forecasts, 2021 – 2033 (USD Million)
Fig. 49 Latin America Enterprise Metaverse Market estimates and forecasts, 2021 – 2033 (USD Million)
Fig. 50 Brazil Enterprise Metaverse Market estimates and forecasts, 2021 – 2033 (USD Million)
Fig. 51 MEA Enterprise Metaverse Market estimates and forecasts, 2021 – 2033 (USD Million)
Fig. 52 KSA Enterprise Metaverse Market estimates and forecasts, 2021 – 2033 (USD Million)
Fig. 53 UAE Enterprise Metaverse Market estimates and forecasts, 2021 – 2033 (USD Million)
Fig. 54 South Africa Enterprise Metaverse Market estimates and forecasts, 2021 – 2033 (USD Million)
Fig. 55 Company Categorization
Fig. 56 Company Market Positioning
Fig. 57 Strategy framework