e-fuel(合成燃料)市場 - 製品別 [E-Diesel (合成軽油)、E-Gasoline (合成ガソリン)]、州別(液体、ガス)、製造方法別、技術別、最終用途別、炭素源別、炭素回収方式別、地域、セグメント別予測による市場規模、成長と動向分析レポート 2026-2033年
E-fuel Market Size, Share & Trends Analysis Report By Product (E-Diesel, E-Gasoline), By State (Liquid, Gas), By Production Method, By Technology, By End Use, By Carbon Source, By Carbon Capture Type, By Region, and Segment Forecasts, 2026 - 2050
| 出版 | Grand View Research |
| 出版年月 | 2026年01月 |
| ページ数 | 150 |
| 価格 | 記載以外のライセンスについてはお問合せください |
| シングルユーザ | USD 5,950 |
| 種別 | 英文調査報告書 |
| 商品番号 | SMR-1598915989 |

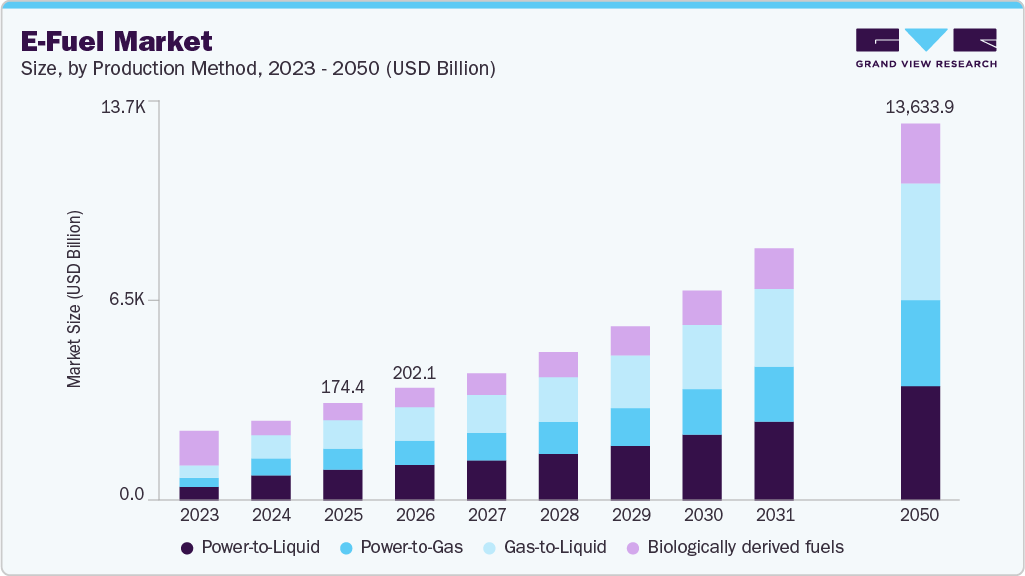
世界のe-fuel(合成燃料)市場規模は、2025年には約1,743億8,000万米ドルと推定され、2050年には13兆6,339億5,000万米ドルに達すると予測されています。2026年から2050年までの年平均成長率(CAGR)は19.2%です。市場は今後数年間、脱炭素化規制の強化、持続可能な航空燃料および船舶燃料の採用拡大、再生可能エネルギーおよびグリーン水素生産能力の急速な拡大、そして排出削減が困難な運輸・産業部門における排出量削減に向けた政府および業界関係者による投資の増加を背景に、着実な成長が見込まれています。
e-fuel(合成燃料)市場は、特に航空、海運、大型輸送といった排出削減が困難な分野において、世界の脱炭素化への取り組みに重要な役割を果たします。再生可能電力、グリーン水素、回収二酸化炭素を利用するe-fuelは、クリーンエネルギー源を用いて大規模生産された場合、ライフサイクル全体でほぼカーボンニュートラルな排出量を実現する可能性を秘めています。既存のエンジンや燃料インフラとの互換性が高いため、大規模な設備更新を必要とせずに排出量を削減でき、持続可能性の価値をさらに高めます。各国政府が炭素排出削減義務を強化し、持続可能な燃料混合目標を導入するにつれ、e燃料は長期的なネットゼロ目標達成のための電化やバイオ燃料を補完するソリューションとしてますます注目されています。
e-fuel(合成燃料)の商業化とコスト削減には、技術革新が不可欠です。バリューチェーン全体で、グリーン水素製造のための高効率電解、高度な炭素回収技術、Power-to-Liquidやフィッシャー・トロプシュ法などの拡張性の高い合成経路といった重要なイノベーションが生まれています。触媒性能、システム統合、再生可能エネルギー利用の継続的な改善により、プロセス全体の効率と生産量が向上しています。これらの技術が成熟し、規模の経済効果が得られるにつれて、生産コストは低下し、中長期的に輸送および産業エネルギー用途におけるe燃料の普及を促進すると予想されます。
本レポートは、世界、地域、国レベルでの収益と販売量の成長を予測し、2021年から2050年までの各サブセグメントにおける最新の業界動向を分析しています。本調査において、Grand View Researchは、製品、州、製造方法、技術、最終用途、炭素源、炭素回収タイプ、地域に基づいてe-fuel(合成燃料)市場レポートをセグメント化しました。
E-fuel Market Summary
The global e-fuel market size was estimated at approximately USD 174.38 billion in 2025 and is projected to reach USD 13,633.95 billion by 2050, at a CAGR of 19.2% from 2026 to 2050. The market is expected to experience steady growth over the next several years, driven by tightening decarbonization regulations, increasing adoption of sustainable aviation and marine fuels, rapid expansion of renewable energy and green hydrogen capacity, and rising investments from governments and industry players to address emissions in hard-to-abate transport and industrial sectors.
The market plays a critical role in global decarbonization efforts, particularly for hard-to-abate sectors such as aviation, maritime shipping, and heavy-duty transport. By utilizing renewable electricity, green hydrogen, and captured carbon dioxide, e-fuel offers the potential for near-carbon-neutral lifecycle emissions when produced at scale using clean energy sources. Their drop-in compatibility with existing engines and fuel infrastructure further enhances their sustainability value, as it enables emissions reduction without requiring large-scale asset replacement. As governments strengthen carbon-reduction mandates and introduce sustainable fuel blending targets, e-fuels are increasingly viewed as a complementary solution to electrification and biofuels in achieving long-term net-zero goals.
Technological advancements are central to the commercialization and cost reduction of e-fuel. Key innovations are emerging across the value chain, including higher-efficiency electrolyzes for green hydrogen production, enhanced carbon capture technologies, and more scalable synthesis pathways, such as Power-to-Liquid and Fischer-Tropsch processes. Continuous improvements in catalyst performance, system integration, and renewable energy utilization are enhancing overall process efficiency and output yields. As these technologies mature and benefit from economies of scale, production costs are expected to decline, supporting broader adoption of e-fuel across transportation and industrial energy applications over the medium to long term.
E-Fuel Market Report Scope
| Report Attribute | Details |
| Market size value in 2026 | USD 202.12 billion |
| Revenue forecast in 2050 | USD 13,633.95 billion |
| Growth rate | CAGR of 19.2% from 2026 to 2050 |
| Base year for estimation | 2025 |
| Historical data | 2021 – 2024 |
| Forecast period | 2026 – 2050 |
| Quantitative Units | Revenue in USD billion/million, Volume in Million Tons, and CAGR from 2026 to 2050 |
| Report coverage | Revenue forecast, volume forecast, company ranking, competitive landscape, growth factors, and trends |
| Segments covered | Product, state, production method, technology, end use, carbon source, carbon capture type, region |
| Regional scope | North America; Europe; Asia Pacific; Latin America; Middle East & Africa |
| Country scope | U.S.; Canada; Mexico; Netherlands; UK; Germany; France; Italy; Spain; Russia; China; Indonesia; Thailand; India; Japan; South Korea; Australia; Brazil; Colombia; Paraguay; Argentina; Saudi Arabia; UAE; South Africa; Egypt |
| Key companies profiled | Arcadia eFuels; Electrochaea GmbH; ExxonMobil Corporation; HIF Global; LanzaJet, Inc.; Liquid Wind AB; Norsk e-Fuel AS; Sunfire GmbH; Synhelion SA; Zero Petroleum |
| Customization scope | Free report customization (equivalent to up to 8 analysts working days) with purchase. Addition or alteration to country, regional & segment scope. |
Global E-Fuel Market Report Segmentation
This report forecasts revenue and volume growth at global, regional, and country levels and provides an analysis of the latest industry trends in each of the sub-segments from 2021 to 2050. For this study, Grand View Research has segmented the e-fuel market report based on product, state, production method, technology, end use, carbon source, carbon capture type, and region:
- Product Outlook (Revenue, USD Million; Volume, Million Tons; 2021 – 2050)
- E-diesel
- E-Gasoline
- Ethanol
- Hydrogen
- E-kerosene
- E-methane
- E-methanol
- Others
- State Outlook (Revenue, USD Million; Volume, Million Tons; 2021 – 2050)
- Liquid
- Gas
- Production Method Outlook (Revenue, USD Million; Volume, Million Tons; 2021 – 2050)
- Power-to-Liquid
- Power-to-Gas
- Gas-to-Liquid
- Biologically Derived Fuels
- Technology Outlook (Revenue, USD Million; Volume, Million Tons; 2021 – 2050)
- Hydrogen Technology (Electrolysis)
- Fischer-Tropsch
- Reverse-Water-Gas-Shift (RWGS)
- End Use Outlook (Revenue, USD Million; Volume, Million Tons; 2021 – 2050)
- Automotive
- Marine
- Industrial
- Railway
- Aviation
- Others
- Carbon Source Outlook (Revenue, USD Million; Volume, Million Tons; 2021 – 2050)
- Point Source
o Smokestack
o Gas Well
- Direct Air Capture
- Carbon Capture Type Outlook (Revenue, USD Million; Volume, Million Tons; 2021 – 2050)
- Post-combustion
- Pre-combustion
- Regional Outlook (Revenue, USD Million; Volume, Million Tons; 2021 – 2050)
- North America
o U.S.
o Canada
o Mexico
- Europe
o Netherlands
o UK
o Germany
o France
o Italy
o Spain
o Russia
- Asia Pacific
o China
o Indonesia
o Thailand
o India
o Japan
o South Korea
o Australia
- Latin America
o Brazil
o Colombia
o Paraguay
o Argentina
- Middle East & Africa
o Saudi Arabia
o UAE
o South Africa
o Egypt
Table of Contents
Chapter 1. Methodology and Scope
1.1. Market Segmentation & Scope
1.2. Market Definition
1.3. Information Procurement
1.3.1. Information Analysis
1.3.2. Market Formulation & Data Visualization
1.3.3. Data Validation & Publishing
1.4. Research Scope and Assumptions
1.4.1. List of Data Types
Chapter 2. Executive Summary
2.1. Market Snapshot
2.2. Segmental Outlook
2.3. Competitive Outlook
Chapter 3. Market Variables, Trends, and Scope
3.1. Market Outlook
3.2. Value Chain Analysis
3.2.1. Raw Material Analysis
3.3. Regulatory Framework
3.3.1. Standards & Compliance
3.3.2. Regulatory Impact Analysis
3.4. Market Dynamics
3.4.1. Market Driver Analysis
3.4.2. Market Restraint Analysis
3.4.3. Market Opportunities
3.4.4. Market Challenges
3.5. Porter’s Five Forces Analysis
3.5.1. Bargaining Power of Suppliers
3.5.2. Bargaining Power of Buyers
3.5.3. Threat of Substitution
3.5.4. Threat of New Entrants
3.5.5. Competitive Rivalry
3.6. PESTLE Analysis
3.6.1. Political
3.6.2. Economic
3.6.3. Social Landscape
3.6.4. Technology
3.6.5. Environmental
3.6.6. Legal
Chapter 4. E-Fuels Market: Product Estimates & Trend Analysis
4.1. Product Movement Analysis & Revenue Market Share, 2025 & 2050
4.2. E-fuels Market Estimates & Forecast, By Product (USD Million) (Million Tons)
4.2.1. E-Diesel
4.2.2. E-Gasoline
4.2.3. Ethanol
4.2.4. Hydrogen (Green Hydrogen)
4.2.5. E-Kerosene
4.2.6. E-Methane
4.2.7. E-Methanol
4.2.8. Others
Chapter 5. E-Fuels Market: State Estimates & Trend Analysis
5.1. State Movement Analysis & Revenue Market Share, 2025 & 2050
5.2. E-Fuels Market Estimates & Forecast, By State (USD Million) (Million Tons)
5.2.1. Liquid
5.2.2. Gas
Chapter 6. E-Fuels Market: Production Method Estimates & Trend Analysis
6.1. Production Method Movement Analysis & Revenue Market Share, 2025 & 2050
6.2. E-fuels Market Estimates & Forecast, By Production Method (USD Million) (Million Tons)
6.2.1. Power-To-Liquid
6.2.2. Power-To-Gas
6.2.3. Gas-To-Liquid
6.2.4. Biologically Derived Fuels
Chapter 7. E-Fuels Market: Technology Estimates & Trend Analysis
7.1. Technology Movement Analysis & Revenue Market Share, 2025 & 2050
7.2. E-fuels Market Estimates & Forecast, By Technology (USD Million) (Million Tons)
7.2.1. Hydrogen Technology (Electrolysis)
7.2.2. Fischer-Tropsch
7.2.3. Reverse-Water-Gas-Shift (RWGS)
Chapter 8. E-Fuels Market: End Use Estimates & Trend Analysis
8.1. End Use Movement Analysis & Revenue Market Share, 2025 & 2050
8.2. E-fuels Market Estimates & Forecast, By End Use (USD Million) (Million Tons)
8.2.1. Automotive
8.2.2. Marine
8.2.3. Industrial
8.2.4. Railway
8.2.5. Aviation
8.2.6. Others
Chapter 9. E-Fuels Market: Carbon Source Estimates & Trend Analysis
9.1. Carbon Source Movement Analysis & Revenue Market Share, 2025 & 2050
9.2. E-fuels Market Estimates & Forecast, By Carbon Source (USD Million) (Million Tons)
9.2.1. Point Source
9.2.1.1. Smokestack
9.2.1.2. Gas Well
9.2.2. Direct Air Capture
Chapter 10. E-Fuels Market: Carbon Capture Type Estimates & Trend Analysis
10.1. Carbon Capture Type Movement Analysis & Revenue Market Share, 2025 & 2050
10.2. E-Fuels Market Estimates & Forecast, By Carbon Capture Type (USD Million) (Million Tons)
10.2.1. Post-Combustion
10.2.2. Pre-Combustion
Chapter 11. E-Fuel Market: Regional Estimates & Trend Analysis
11.1. Regional Analysis, 2025 & 2050
11.2. North America
11.2.1. Market estimates and forecasts, 2021 – 2050 (USD Million) (Million Tons)
11.2.2. Market estimates and forecasts, by product, 2021 – 2050 (USD Million) (Million Tons)
11.2.3. Market estimates and forecasts, by state, 2021 – 2050 (USD Million) (Million Tons)
11.2.4. Market estimates and forecasts, by production method, 2021 – 2050 (USD Million) (Million Tons)
11.2.5. Market estimates and forecasts, by technology, 2021 – 2050 (USD Million) (Million Tons)
11.2.6. Market estimates and forecasts, by end use, 2021 – 2050 (USD Million) (Million Tons)
11.2.7. Market estimates and forecasts, by carbon source, 2021 – 2050 (USD Million) (Million Tons)
11.2.8. Market estimates and forecasts, by carbon capture, 2021 – 2050 (USD Million) (Million Tons)
11.2.9. U.S.
11.2.9.1. Market estimates and forecasts, 2021 – 2050 (USD Million) (Million Tons)
11.2.9.2. Market estimates and forecasts, by product, 2021 – 2050 (USD Million) (Million Tons)
11.2.9.3. Market estimates and forecasts, by state, 2021 – 2050 (USD Million) (Million Tons)
11.2.9.4. Market estimates and forecasts, by production method, 2021 – 2050 (USD Million) (Million Tons)
11.2.9.5. Market estimates and forecasts, by technology, 2021 – 2050 (USD Million) (Million Tons)
11.2.9.6. Market estimates and forecasts, by end use, 2021 – 2050 (USD Million) (Million Tons)
11.2.9.7. Market estimates and forecasts, by carbon source, 2021 – 2050 (USD Million) (Million Tons)
11.2.9.8. Market estimates and forecasts, by carbon capture, 2021 – 2050 (USD Million) (Million Tons)
11.2.10. Canada
11.2.10.1. Market estimates and forecasts, 2021 – 2050 (USD Million) (Million Tons)
11.2.10.2. Market estimates and forecasts, by product, 2021 – 2050 (USD Million) (Million Tons)
11.2.10.3. Market estimates and forecasts, by state, 2021 – 2050 (USD Million) (Million Tons)
11.2.10.4. Market estimates and forecasts, by production method, 2021 – 2050 (USD Million) (Million Tons)
11.2.10.5. Market estimates and forecasts, by technology, 2021 – 2050 (USD Million) (Million Tons)
11.2.10.6. Market estimates and forecasts, by end use, 2021 – 2050 (USD Million) (Million Tons)
11.2.10.7. Market estimates and forecasts, by carbon source, 2021 – 2050 (USD Million) (Million Tons)
11.2.10.8. Market estimates and forecasts, by carbon capture, 2021 – 2050 (USD Million) (Million Tons)
11.2.11. Mexico
11.2.11.1. Market estimates and forecasts, 2021 – 2050 (USD Million) (Million Tons)
11.2.11.2. Market estimates and forecasts, by product, 2021 – 2050 (USD Million) (Million Tons)
11.2.11.3. Market estimates and forecasts, by state, 2021 – 2050 (USD Million) (Million Tons)
11.2.11.4. Market estimates and forecasts, by production method, 2021 – 2050 (USD Million) (Million Tons)
11.2.11.5. Market estimates and forecasts, by technology, 2021 – 2050 (USD Million) (Million Tons)
11.2.11.6. Market estimates and forecasts, by end use, 2021 – 2050 (USD Million) (Million Tons)
11.2.11.7. Market estimates and forecasts, by carbon source, 2021 – 2050 (USD Million) (Million Tons)
11.2.11.8. Market estimates and forecasts, by carbon capture, 2021 – 2050 (USD Million) (Million Tons)
11.3. Europe
11.3.1. Market estimates and forecasts, 2021 – 2050 (USD Million) (Million Tons)
11.3.2. Market estimates and forecasts, 2021 – 2050 (USD Million) (Million Tons)
11.3.3. Market estimates and forecasts, by product, 2021 – 2050 (USD Million) (Million Tons)
11.3.4. Market estimates and forecasts, by state, 2021 – 2050 (USD Million) (Million Tons)
11.3.5. Market estimates and forecasts, by production method, 2021 – 2050 (USD Million) (Million Tons)
11.3.6. Market estimates and forecasts, by technology, 2021 – 2050 (USD Million) (Million Tons)
11.3.7. Market estimates and forecasts, by end use, 2021 – 2050 (USD Million) (Million Tons)
11.3.8. Market estimates and forecasts, by carbon source, 2021 – 2050 (USD Million) (Million Tons)
11.3.9. Market estimates and forecasts, by carbon capture, 2021 – 2050 (USD Million) (Million Tons)
11.3.10. Netherlands
11.3.10.1. Market estimates and forecasts, 2021 – 2050 (USD Million) (Million Tons)
11.3.10.2. Market estimates and forecasts, by product, 2021 – 2050 (USD Million) (Million Tons)
11.3.10.3. Market estimates and forecasts, by state, 2021 – 2050 (USD Million) (Million Tons)
11.3.10.4. Market estimates and forecasts, by production method, 2021 – 2050 (USD Million) (Million Tons)
11.3.10.5. Market estimates and forecasts, by technology, 2021 – 2050 (USD Million) (Million Tons)
11.3.10.6. Market estimates and forecasts, by end use, 2021 – 2050 (USD Million) (Million Tons)
11.3.10.7. Market estimates and forecasts, by carbon source, 2021 – 2050 (USD Million) (Million Tons)
11.3.10.8. Market estimates and forecasts, by carbon capture, 2021 – 2050 (USD Million) (Million Tons)
11.3.11. Germany
11.3.11.1. Market estimates and forecasts, 2021 – 2050 (USD Million) (Million Tons)
11.3.11.2. Market estimates and forecasts, by product, 2021 – 2050 (USD Million) (Million Tons)
11.3.11.3. Market estimates and forecasts, by state, 2021 – 2050 (USD Million) (Million Tons)
11.3.11.4. Market estimates and forecasts, by production method, 2021 – 2050 (USD Million) (Million Tons)
11.3.11.5. Market estimates and forecasts, by technology, 2021 – 2050 (USD Million) (Million Tons)
11.3.11.6. Market estimates and forecasts, by end use, 2021 – 2050 (USD Million) (Million Tons)
11.3.11.7. Market estimates and forecasts, by carbon source, 2021 – 2050 (USD Million) (Million Tons)
11.3.11.8. Market estimates and forecasts, by carbon capture, 2021 – 2050 (USD Million) (Million Tons)
11.3.12. UK
11.3.12.1. Market estimates and forecasts, 2021 – 2050 (USD Million) (Million Tons)
11.3.12.2. Market estimates and forecasts, by product, 2021 – 2050 (USD Million) (Million Tons)
11.3.12.3. Market estimates and forecasts, by state, 2021 – 2050 (USD Million) (Million Tons)
11.3.12.4. Market estimates and forecasts, by production method, 2021 – 2050 (USD Million) (Million Tons)
11.3.12.5. Market estimates and forecasts, by technology, 2021 – 2050 (USD Million) (Million Tons)
11.3.12.6. Market estimates and forecasts, by end use, 2021 – 2050 (USD Million) (Million Tons)
11.3.12.7. Market estimates and forecasts, by carbon source, 2021 – 2050 (USD Million) (Million Tons)
11.3.12.8. Market estimates and forecasts, by carbon capture, 2021 – 2050 (USD Million) (Million Tons)
11.3.13. France
11.3.13.1. Market estimates and forecasts, 2021 – 2050 (USD Million) (Million Tons)
11.3.13.2. Market estimates and forecasts, by product, 2021 – 2050 (USD Million) (Million Tons)
11.3.13.3. Market estimates and forecasts, by state, 2021 – 2050 (USD Million) (Million Tons)
11.3.13.4. Market estimates and forecasts, by production method, 2021 – 2050 (USD Million) (Million Tons)
11.3.13.5. Market estimates and forecasts, by technology, 2021 – 2050 (USD Million) (Million Tons)
11.3.13.6. Market estimates and forecasts, by end use, 2021 – 2050 (USD Million) (Million Tons)
11.3.13.7. Market estimates and forecasts, by carbon source, 2021 – 2050 (USD Million) (Million Tons)
11.3.13.8. Market estimates and forecasts, by carbon capture, 2021 – 2050 (USD Million) (Million Tons)
11.3.14. Italy
11.3.14.1. Market estimates and forecasts, 2021 – 2050 (USD Million) (Million Tons)
11.3.14.2. Market estimates and forecasts, by product, 2021 – 2050 (USD Million) (Million Tons)
11.3.14.3. Market estimates and forecasts, by state, 2021 – 2050 (USD Million) (Million Tons)
11.3.14.4. Market estimates and forecasts, by production method, 2021 – 2050 (USD Million) (Million Tons)
11.3.14.5. Market estimates and forecasts, by technology, 2021 – 2050 (USD Million) (Million Tons)
11.3.14.6. Market estimates and forecasts, by end use, 2021 – 2050 (USD Million) (Million Tons)
11.3.14.7. Market estimates and forecasts, by carbon source, 2021 – 2050 (USD Million) (Million Tons)
11.3.14.8. Market estimates and forecasts, by carbon capture, 2021 – 2050 (USD Million) (Million Tons)
11.3.15. Russia
11.3.15.1. Market estimates and forecasts, 2021 – 2050 (USD Million) (Million Tons)
11.3.15.2. Market estimates and forecasts, by product, 2021 – 2050 (USD Million) (Million Tons)
11.3.15.3. Market estimates and forecasts, by state, 2021 – 2050 (USD Million) (Million Tons)
11.3.15.4. Market estimates and forecasts, by production method, 2021 – 2050 (USD Million) (Million Tons)
11.3.15.5. Market estimates and forecasts, by technology, 2021 – 2050 (USD Million) (Million Tons)
11.3.15.6. Market estimates and forecasts, by end use, 2021 – 2050 (USD Million) (Million Tons)
11.3.15.7. Market estimates and forecasts, by carbon source, 2021 – 2050 (USD Million) (Million Tons)
11.3.15.8. Market estimates and forecasts, by carbon capture, 2021 – 2050 (USD Million) (Million Tons)
11.3.16. Spain
11.3.16.1. Market estimates and forecasts, 2021 – 2050 (USD Million) (Million Tons)
11.3.16.2. Market estimates and forecasts, by product, 2021 – 2050 (USD Million) (Million Tons)
11.3.16.3. Market estimates and forecasts, by state, 2021 – 2050 (USD Million) (Million Tons)
11.3.16.4. Market estimates and forecasts, by production method, 2021 – 2050 (USD Million) (Million Tons)
11.3.16.5. Market estimates and forecasts, by technology, 2021 – 2050 (USD Million) (Million Tons)
11.3.16.6. Market estimates and forecasts, by end use, 2021 – 2050 (USD Million) (Million Tons)
11.3.16.7. Market estimates and forecasts, by carbon source, 2021 – 2050 (USD Million) (Million Tons)
11.3.16.8. Market estimates and forecasts, by carbon capture, 2021 – 2050 (USD Million) (Million Tons)
11.4. Asia Pacific
11.4.1. Market estimates and forecasts, 2021 – 2050 (USD Million) (Million Tons)
11.4.2. Market estimates and forecasts, 2021 – 2050 (USD Million) (Million Tons)
11.4.3. Market estimates and forecasts, by product, 2021 – 2050 (USD Million) (Million Tons)
11.4.4. Market estimates and forecasts, by state, 2021 – 2050 (USD Million) (Million Tons)
11.4.5. Market estimates and forecasts, by production method, 2021 – 2050 (USD Million) (Million Tons)
11.4.6. Market estimates and forecasts, by technology, 2021 – 2050 (USD Million) (Million Tons)
11.4.7. Market estimates and forecasts, by end use, 2021 – 2050 (USD Million) (Million Tons)
11.4.8. Market estimates and forecasts, by carbon source, 2021 – 2050 (USD Million) (Million Tons)
11.4.9. Market estimates and forecasts, by carbon capture, 2021 – 2050 (USD Million) (Million Tons)
11.4.10. China
11.4.10.1. Market estimates and forecasts, 2021 – 2050 (USD Million) (Million Tons)
11.4.10.2. Market estimates and forecasts, by product, 2021 – 2050 (USD Million) (Million Tons)
11.4.10.3. Market estimates and forecasts, by state, 2021 – 2050 (USD Million) (Million Tons)
11.4.10.4. Market estimates and forecasts, by production method, 2021 – 2050 (USD Million) (Million Tons)
11.4.10.5. Market estimates and forecasts, by technology, 2021 – 2050 (USD Million) (Million Tons)
11.4.10.6. Market estimates and forecasts, by end use, 2021 – 2050 (USD Million) (Million Tons)
11.4.10.7. Market estimates and forecasts, by carbon source, 2021 – 2050 (USD Million) (Million Tons)
11.4.10.8. Market estimates and forecasts, by carbon capture, 2021 – 2050 (USD Million) (Million Tons)
11.4.11. India
11.4.11.1. Market estimates and forecasts, 2021 – 2050 (USD Million) (Million Tons)
11.4.11.2. Market estimates and forecasts, by product, 2021 – 2050 (USD Million) (Million Tons)
11.4.11.3. Market estimates and forecasts, by state, 2021 – 2050 (USD Million) (Million Tons)
11.4.11.4. Market estimates and forecasts, by production method, 2021 – 2050 (USD Million) (Million Tons)
11.4.11.5. Market estimates and forecasts, by technology, 2021 – 2050 (USD Million) (Million Tons)
11.4.11.6. Market estimates and forecasts, by end use, 2021 – 2050 (USD Million) (Million Tons)
11.4.11.7. Market estimates and forecasts, by carbon source, 2021 – 2050 (USD Million) (Million Tons)
11.4.11.8. Market estimates and forecasts, by carbon capture, 2021 – 2050 (USD Million) (Million Tons)
11.4.12. Japan
11.4.12.1. Market estimates and forecasts, 2021 – 2050 (USD Million) (Million Tons)
11.4.12.2. Market estimates and forecasts, by product, 2021 – 2050 (USD Million) (Million Tons)
11.4.12.3. Market estimates and forecasts, by state, 2021 – 2050 (USD Million) (Million Tons)
11.4.12.4. Market estimates and forecasts, by production method, 2021 – 2050 (USD Million) (Million Tons)
11.4.12.5. Market estimates and forecasts, by technology, 2021 – 2050 (USD Million) (Million Tons)
11.4.12.6. Market estimates and forecasts, by end use, 2021 – 2050 (USD Million) (Million Tons)
11.4.12.7. Market estimates and forecasts, by carbon source, 2021 – 2050 (USD Million) (Million Tons)
11.4.12.8. Market estimates and forecasts, by carbon capture, 2021 – 2050 (USD Million) (Million Tons)
11.4.13. South Korea
11.4.13.1. Market estimates and forecasts, 2021 – 2050 (USD Million) (Million Tons)
11.4.13.2. Market estimates and forecasts, by product, 2021 – 2050 (USD Million) (Million Tons)
11.4.13.3. Market estimates and forecasts, by state, 2021 – 2050 (USD Million) (Million Tons)
11.4.13.4. Market estimates and forecasts, by production method, 2021 – 2050 (USD Million) (Million Tons)
11.4.13.5. Market estimates and forecasts, by technology, 2021 – 2050 (USD Million) (Million Tons)
11.4.13.6. Market estimates and forecasts, by end use, 2021 – 2050 (USD Million) (Million Tons)
11.4.13.7. Market estimates and forecasts, by carbon source, 2021 – 2050 (USD Million) (Million Tons)
11.4.13.8. Market estimates and forecasts, by carbon capture, 2021 – 2050 (USD Million) (Million Tons)
11.4.14. Australia
11.4.14.1. Market estimates and forecasts, 2021 – 2050 (USD Million) (Million Tons)
11.4.14.2. Market estimates and forecasts, by product, 2021 – 2050 (USD Million) (Million Tons)
11.4.14.3. Market estimates and forecasts, by state, 2021 – 2050 (USD Million) (Million Tons)
11.4.14.4. Market estimates and forecasts, by production method, 2021 – 2050 (USD Million) (Million Tons)
11.4.14.5. Market estimates and forecasts, by technology, 2021 – 2050 (USD Million) (Million Tons)
11.4.14.6. Market estimates and forecasts, by end use, 2021 – 2050 (USD Million) (Million Tons)
11.4.14.7. Market estimates and forecasts, by carbon source, 2021 – 2050 (USD Million) (Million Tons)
11.4.14.8. Market estimates and forecasts, by carbon capture, 2021 – 2050 (USD Million) (Million Tons)
11.4.15. Indonesia
11.4.15.1. Market estimates and forecasts, 2021 – 2050 (USD Million) (Million Tons)
11.4.15.2. Market estimates and forecasts, by product, 2021 – 2050 (USD Million) (Million Tons)
11.4.15.3. Market estimates and forecasts, by state, 2021 – 2050 (USD Million) (Million Tons)
11.4.15.4. Market estimates and forecasts, by production method, 2021 – 2050 (USD Million) (Million Tons)
11.4.15.5. Market estimates and forecasts, by technology, 2021 – 2050 (USD Million) (Million Tons)
11.4.15.6. Market estimates and forecasts, by end use, 2021 – 2050 (USD Million) (Million Tons)
11.4.15.7. Market estimates and forecasts, by carbon source, 2021 – 2050 (USD Million) (Million Tons)
11.4.15.8. Market estimates and forecasts, by carbon capture, 2021 – 2050 (USD Million) (Million Tons)
11.4.16. Thailand
11.4.16.1. Market estimates and forecasts, 2021 – 2050 (USD Million) (Million Tons)
11.4.16.2. Market estimates and forecasts, by product, 2021 – 2050 (USD Million) (Million Tons)
11.4.16.3. Market estimates and forecasts, by state, 2021 – 2050 (USD Million) (Million Tons)
11.4.16.4. Market estimates and forecasts, by production method, 2021 – 2050 (USD Million) (Million Tons)
11.4.16.5. Market estimates and forecasts, by technology, 2021 – 2050 (USD Million) (Million Tons)
11.4.16.6. Market estimates and forecasts, by end use, 2021 – 2050 (USD Million) (Million Tons)
11.4.16.7. Market estimates and forecasts, by carbon source, 2021 – 2050 (USD Million) (Million Tons)
11.4.16.8. Market estimates and forecasts, by carbon capture, 2021 – 2050 (USD Million) (Million Tons)
11.4.17. Australia
11.4.17.1. Market estimates and forecasts, 2021 – 2050 (USD Million) (Million Tons)
11.4.17.2. Market estimates and forecasts, by product, 2021 – 2050 (USD Million) (Million Tons)
11.4.17.3. Market estimates and forecasts, by state, 2021 – 2050 (USD Million) (Million Tons)
11.4.17.4. Market estimates and forecasts, by production method, 2021 – 2050 (USD Million) (Million Tons)
11.4.17.5. Market estimates and forecasts, by technology, 2021 – 2050 (USD Million) (Million Tons)
11.4.17.6. Market estimates and forecasts, by end use, 2021 – 2050 (USD Million) (Million Tons)
11.4.17.7. Market estimates and forecasts, by carbon source, 2021 – 2050 (USD Million) (Million Tons)
11.5. Market estimates and forecasts, by carbon capture, 2021 – 2050 (USD Million) (Million Tons)Latin America
11.5.1. Market estimates and forecasts, 2021 – 2050 (USD Million) (Million Tons)
11.5.2. Market estimates and forecasts, 2021 – 2050 (USD Million) (Million Tons)
11.5.3. Market estimates and forecasts, by product, 2021 – 2050 (USD Million) (Million Tons)
11.5.4. Market estimates and forecasts, by state, 2021 – 2050 (USD Million) (Million Tons)
11.5.5. Market estimates and forecasts, by production method, 2021 – 2050 (USD Million) (Million Tons)
11.5.6. Market estimates and forecasts, by technology, 2021 – 2050 (USD Million) (Million Tons)
11.5.7. Market estimates and forecasts, by end use, 2021 – 2050 (USD Million) (Million Tons)
11.5.8. Market estimates and forecasts, by carbon source, 2021 – 2050 (USD Million) (Million Tons)
11.5.9. Market estimates and forecasts, by carbon capture, 2021 – 2050 (USD Million) (Million Tons)
11.5.10. Brazil
11.5.10.1. Market estimates and forecasts, 2021 – 2050 (USD Million) (Million Tons)
11.5.10.2. Market estimates and forecasts, by product, 2021 – 2050 (USD Million) (Million Tons)
11.5.10.3. Market estimates and forecasts, by state, 2021 – 2050 (USD Million) (Million Tons)
11.5.10.4. Market estimates and forecasts, by production method, 2021 – 2050 (USD Million) (Million Tons)
11.5.10.5. Market estimates and forecasts, by technology, 2021 – 2050 (USD Million) (Million Tons)
11.5.10.6. Market estimates and forecasts, by end use, 2021 – 2050 (USD Million) (Million Tons)
11.5.10.7. Market estimates and forecasts, by carbon source, 2021 – 2050 (USD Million) (Million Tons)
11.5.10.8. Market estimates and forecasts, by carbon capture, 2021 – 2050 (USD Million) (Million Tons)
11.5.11. Colombia
11.5.11.1. Market estimates and forecasts, 2021 – 2050 (USD Million) (Million Tons)
11.5.11.2. Market estimates and forecasts, by product, 2021 – 2050 (USD Million) (Million Tons)
11.5.11.3. Market estimates and forecasts, by state, 2021 – 2050 (USD Million) (Million Tons)
11.5.11.4. Market estimates and forecasts, by production method, 2021 – 2050 (USD Million) (Million Tons)
11.5.11.5. Market estimates and forecasts, by technology, 2021 – 2050 (USD Million) (Million Tons)
11.5.11.6. Market estimates and forecasts, by end use, 2021 – 2050 (USD Million) (Million Tons)
11.5.11.7. Market estimates and forecasts, by carbon source, 2021 – 2050 (USD Million) (Million Tons)
11.5.11.8. Market estimates and forecasts, by carbon capture, 2021 – 2050 (USD Million) (Million Tons)
11.5.12. Paraguay
11.5.12.1. Market estimates and forecasts, 2021 – 2050 (USD Million) (Million Tons)
11.5.12.2. Market estimates and forecasts, by product, 2021 – 2050 (USD Million) (Million Tons)
11.5.12.3. Market estimates and forecasts, by state, 2021 – 2050 (USD Million) (Million Tons)
11.5.12.4. Market estimates and forecasts, by production method, 2021 – 2050 (USD Million) (Million Tons)
11.5.12.5. Market estimates and forecasts, by technology, 2021 – 2050 (USD Million) (Million Tons)
11.5.12.6. Market estimates and forecasts, by end use, 2021 – 2050 (USD Million) (Million Tons)
11.5.12.7. Market estimates and forecasts, by carbon source, 2021 – 2050 (USD Million) (Million Tons)
11.5.12.8. Market estimates and forecasts, by carbon capture, 2021 – 2050 (USD Million) (Million Tons)
11.5.13. Argentina
11.5.13.1. Market estimates and forecasts, 2021 – 2050 (USD Million) (Million Tons)
11.5.13.2. Market estimates and forecasts, by product, 2021 – 2050 (USD Million) (Million Tons)
11.5.13.3. Market estimates and forecasts, by state, 2021 – 2050 (USD Million) (Million Tons)
11.5.13.4. Market estimates and forecasts, by production method, 2021 – 2050 (USD Million) (Million Tons)
11.5.13.5. Market estimates and forecasts, by technology, 2021 – 2050 (USD Million) (Million Tons)
11.5.13.6. Market estimates and forecasts, by end use, 2021 – 2050 (USD Million) (Million Tons)
11.5.13.7. Market estimates and forecasts, by carbon source, 2021 – 2050 (USD Million) (Million Tons)
11.5.13.8. Market estimates and forecasts, by carbon capture, 2021 – 2050 (USD Million) (Million Tons)
11.6. Middle East & Africa
11.6.1. Market estimates and forecasts, 2021 – 2050 (USD Million) (Million Tons)
11.6.2. Market estimates and forecasts, 2021 – 2050 (USD Million) (Million Tons)
11.6.3. Market estimates and forecasts, by product, 2021 – 2050 (USD Million) (Million Tons)
11.6.4. Market estimates and forecasts, by state, 2021 – 2050 (USD Million) (Million Tons)
11.6.5. Market estimates and forecasts, by production method, 2021 – 2050 (USD Million) (Million Tons)
11.6.6. Market estimates and forecasts, by technology, 2021 – 2050 (USD Million) (Million Tons)
11.6.7. Market estimates and forecasts, by end use, 2021 – 2050 (USD Million) (Million Tons)
11.6.8. Market estimates and forecasts, by carbon source, 2021 – 2050 (USD Million) (Million Tons)
11.6.9. Market estimates and forecasts, by carbon capture, 2021 – 2050 (USD Million) (Million Tons)
11.6.10. Saudi Arabia
11.6.10.1. Market estimates and forecasts, 2021 – 2050 (USD Million) (Million Tons)
11.6.10.2. Market estimates and forecasts, by product, 2021 – 2050 (USD Million) (Million Tons)
11.6.10.3. Market estimates and forecasts, by state, 2021 – 2050 (USD Million) (Million Tons)
11.6.10.4. Market estimates and forecasts, by production method, 2021 – 2050 (USD Million) (Million Tons)
11.6.10.5. Market estimates and forecasts, by technology, 2021 – 2050 (USD Million) (Million Tons)
11.6.10.6. Market estimates and forecasts, by end use, 2021 – 2050 (USD Million) (Million Tons)
11.6.10.7. Market estimates and forecasts, by carbon source, 2021 – 2050 (USD Million) (Million Tons)
11.6.10.8. Market estimates and forecasts, by carbon capture, 2021 – 2050 (USD Million) (Million Tons)
11.6.11. UAE
11.6.11.1. Market estimates and forecasts, 2021 – 2050 (USD Million) (Million Tons)
11.6.11.2. Market estimates and forecasts, by product, 2021 – 2050 (USD Million) (Million Tons)
11.6.11.3. Market estimates and forecasts, by state, 2021 – 2050 (USD Million) (Million Tons)
11.6.11.4. Market estimates and forecasts, by production method, 2021 – 2050 (USD Million) (Million Tons)
11.6.11.5. Market estimates and forecasts, by technology, 2021 – 2050 (USD Million) (Million Tons)
11.6.11.6. Market estimates and forecasts, by end use, 2021 – 2050 (USD Million) (Million Tons)
11.6.11.7. Market estimates and forecasts, by carbon source, 2021 – 2050 (USD Million) (Million Tons)
11.6.11.8. Market estimates and forecasts, by carbon capture, 2021 – 2050 (USD Million) (Million Tons)
11.6.12. South Africa
11.6.12.1. Market estimates and forecasts, 2021 – 2050 (USD Million) (Million Tons)
11.6.12.2. Market estimates and forecasts, by product, 2021 – 2050 (USD Million) (Million Tons)
11.6.12.3. Market estimates and forecasts, by state, 2021 – 2050 (USD Million) (Million Tons)
11.6.12.4. Market estimates and forecasts, by production method, 2021 – 2050 (USD Million) (Million Tons)
11.6.12.5. Market estimates and forecasts, by technology, 2021 – 2050 (USD Million) (Million Tons)
11.6.12.6. Market estimates and forecasts, by end use, 2021 – 2050 (USD Million) (Million Tons)
11.6.12.7. Market estimates and forecasts, by carbon source, 2021 – 2050 (USD Million) (Million Tons)
11.6.12.8. Market estimates and forecasts, by carbon capture, 2021 – 2050 (USD Million) (Million Tons)
11.6.13. Egypt
11.6.13.1. Market estimates and forecasts, 2021 – 2050 (USD Million) (Million Tons)
11.6.13.2. Market estimates and forecasts, by product, 2021 – 2050 (USD Million) (Million Tons)
11.6.13.3. Market estimates and forecasts, by state, 2021 – 2050 (USD Million) (Million Tons)
11.6.13.4. Market estimates and forecasts, by production method, 2021 – 2050 (USD Million) (Million Tons)
11.6.13.5. Market estimates and forecasts, by technology, 2021 – 2050 (USD Million) (Million Tons)
11.6.13.6. Market estimates and forecasts, by end use, 2021 – 2050 (USD Million) (Million Tons)
11.6.13.7. Market estimates and forecasts, by carbon source, 2021 – 2050 (USD Million) (Million Tons)
11.6.13.8. Market estimates and forecasts, by carbon capture, 2021 – 2050 (USD Million) (Million Tons)
Chapter 12. Competitive Landscape
12.1. Recent Developments by Key Market Participants
12.2. Company Categorization
12.3. List of Key Component Suppliers & Channel Partners
12.4. Company Market Share & Positioning Analysis, 2024
12.5. Heat Map Analysis
12.6. Vendor Landscape
12.6.1. List of Raw Material Suppliers
12.6.2. List of Distributors/Traders
12.6.3. List of Other Prominent Manufacturers
12.7. List of Prospective End Users
12.8. Strategy Mapping
12.9. Company Profiles/Listing
12.9.1. Arcadia eFuels
12.9.1.1. Company Overview
12.9.1.2. Financial Performance
12.9.1.3. Product Benchmarking
12.9.2. Electrochaea GmbH
12.9.2.1. Company Overview
12.9.2.2. Financial Performance
12.9.2.3. Product Benchmarking
12.9.3. ExxonMobil Corporation
12.9.3.1. Company Overview
12.9.3.2. Financial Performance
12.9.3.3. Product Benchmarking
12.9.4. HIF Global
12.9.4.1. Company Overview
12.9.4.2. Financial Performance
12.9.4.3. Product Benchmarking
12.9.5. LanzaJet, Inc.
12.9.5.1. Company Overview
12.9.5.2. Financial Performance
12.9.5.3. Product Benchmarking
12.9.6. Liquid Wind AB
12.9.6.1. Company Overview
12.9.6.2. Financial Performance
12.9.6.3. Product Benchmarking
12.9.7. Norsk e-Fuel AS
12.9.7.1. Company Overview
12.9.7.2. Financial Performance
12.9.7.3. Product Benchmarking
12.9.8. Sunfire GmbH
12.9.8.1. Company Overview
12.9.8.2. Financial Performance
12.9.8.3. Product Benchmarking
12.9.9. Synhelion SA
12.9.9.1. Company Overview
12.9.9.2. Financial Performance
12.9.9.3. Product Benchmarking
12.9.10. Zero Petroleum
12.9.10.1. Company Overview
12.9.10.2. Financial Performance
12.9.10.3. Product Benchmarking
List of Tables
Table 1 Global E-fuels market estimates & forecasts, 2021 – 2050 (USD Million) (Million Tons)
Table 2 E-fuels Market Estimates and Forecast, By Product, 2021 – 2050 (USD Million) (Million Tons)
Table 3 E-Fuel Market Estimates and Forecast, By State, 2021 – 2050 (USD Million) (Million Tons)
Table 4 E-fuels Market Estimates and Forecast, By Application, 2021 – 2050 (USD Million) (Million Tons)
Table 5 E-fuels Market Estimates and Forecast, By Technology, 2021 – 2050 (USD Million) (Million Tons)
Table 6 E-fuels Market Estimates and Forecast, By End Use, 2021 – 2050 (USD Million) (Million Tons)
Table 7 E-fuels Market Estimates and Forecast, By Carbon Source, 2021 – 2050 (USD Million) (Million Tons)
Table 8 E-Fuel Market Estimates and Forecast, By Carbon Capture Type, 2021 – 2050 (USD Million) (Million Tons)
List of Figures
Fig. 1 Market Segmentation
Fig. 2 Information Procurement
Fig. 3 Data Analysis Models
Fig. 4 Market Formulation and Validation
Fig. 5 Data Validating & Publishing
Fig. 6 Market Snapshot
Fig. 7 Segmental Outlook – Product, State, Application, Technology, End Use, Carbon Source, Carbon Capture Type
Fig. 8 Competitive Outlook
Fig. 9 E-Fuel Market Outlook, 2021 – 2050 (USD Million) (Million Tons)
Fig. 10 Value Chain Analysis
Fig. 11 Market Dynamics
Fig. 12 Porter’s Analysis
Fig. 13 Pestel Analysis
Fig. 14 E-Fuel Market, By Product: Key Takeaways
Fig. 15 E-fuels Market, By Product: Revenue Market Share, 2025 & 2050
Fig. 16 E-Fuel Market, By State: Key Takeaways
Fig. 17 E-Fuel Market, By State: Market Share, 2025 & 2050
Fig. 18 E-Fuel Market, By Application: Key Takeaways
Fig. 19 E-Fuel Market, By Application: Market Share, 2025 & 2050
Fig. 20 E-Fuel Market, By Technology: Key Takeaways
Fig. 21 E-Fuel Market, By Technology: Market Share, 2025 & 2050
Fig. 22 E-Fuel Market, By End Use: Key Takeaways
Fig. 23 E-Fuel Market, By End Use: Market Share, 2025 & 2050
Fig. 24 E-Fuel Market, By Carbon Source: Key Takeaways
Fig. 25 E-Fuel Market, By Carbon Source: Market Share, 2025 & 2050
Fig. 26 E-Fuel Market, By Carbon Capture Type: Key Takeaways
Fig. 27 E-Fuel Market, By Carbon Capture Type: Market Share, 2025 & 2050
Fig. 28 E-Fuel Market: Regional Analysis, 2025 & 2050
Fig. 29 E-Fuel Market, By Region: Key Takeaways