デジタル油田市場 - ソリューション(ハードウェアソリューション、ソフトウェア&サービスソリューション)、用途別(陸上、海上)、プロセス別、地域、セグメント別予測による市場規模、成長と動向分析レポート 2026-2033年
Digital Oilfield Market Size, Share & Trends Analysis Report By Solution (Hardware Solution, Software & Service Solutions), By Application (Onshore, Offshore), By Process, By Region, And Segment Forecasts, 2026 - 2033
| 出版 | Grand View Research |
| 出版年月 | 2026年02月 |
| ページ数 | 120 |
| 価格 | 記載以外のライセンスについてはお問合せください |
| シングルユーザ | USD 5,950 |
| 種別 | 英文調査報告書 |
| 商品番号 | SMR-1625116251 |

世界のデジタル油田市場規模は、2025年には307億8000万米ドルと推定され、2033年には478億5000万米ドルに達すると予測されており、2026年から2033年にかけて年平均成長率(CAGR)5.6%で成長すると見込まれています。上流工程におけるリアルタイムデータ収集技術の急速な普及が、この業界を大きく牽引しています。
主要市場動向とインサイト
- 北米のデジタル油田市場は、2025年時点で世界市場の34%以上を占め、最大のシェアを獲得しました。
- 米国のデジタル油田市場は、予測期間中に高い年平均成長率(CAGR)で成長すると予想されています。
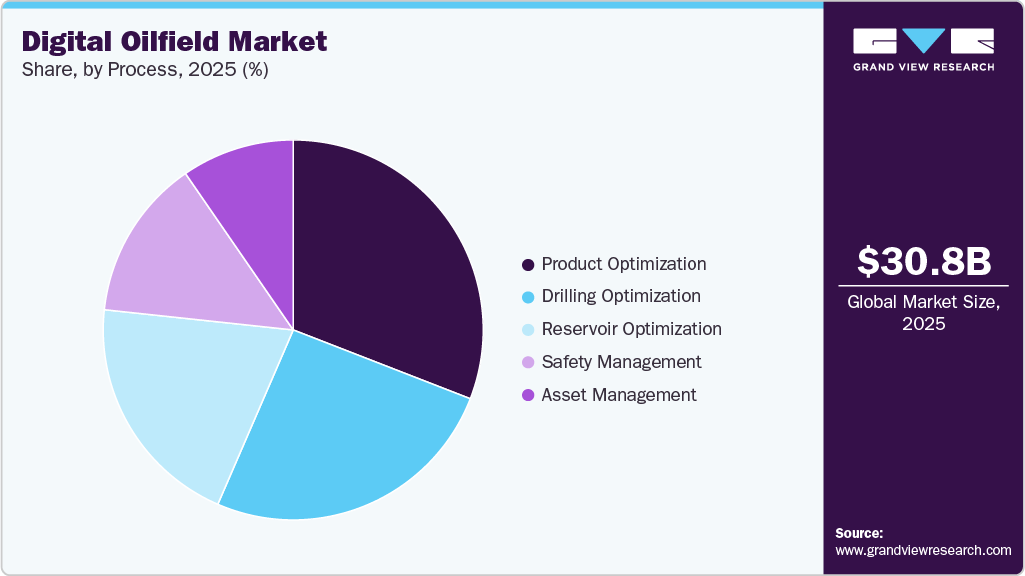
- プロセス別に見ると、製品最適化セグメントが2025年時点で30%以上の最大の市場シェアを占めました。
- ソリューション別に見ると、ハードウェアソリューションセグメントが2025年時点で最大の市場シェアを占めました。
- 用途別に見ると、陸上油田セグメントが2025年時点で最大の市場シェアを占めました。
石油・ガス事業者は、坑井、掘削リグ、パイプライン、処理施設全体に高度なセンサー、スマートメーター、コネクテッド制御システムを導入し、圧力、温度、流量、機器性能データを継続的に収集しています。この継続的なデータフローにより、油田の可視性が向上し、事業者は資産を遠隔監視できるようになり、手動検査への依存度を低減できます。遠隔監視は、物理的なアクセスが費用と時間を要する洋上プラットフォームや地理的に孤立した油田において特に重要です。事業者が操業の透明性と迅速な意思決定を優先するにつれ、デジタル油田アーキテクチャへの投資は加速し続けています。
高度な分析、人工知能、機械学習は、生の操業データを実用的な洞察へと変換する上で中心的な役割を果たします。予測分析モデルは、機器故障の早期兆候を特定するのに役立ち、保守チームが故障が発生する前に介入して、高額な生産損失を回避することを可能にします。AIを活用した貯留層モデリングと生産最適化ツールは、より適切な坑井配置、増産、エネルギーと化学薬品のより効率的な使用を支援します。これらの技術は、稼働時間の向上、メンテナンスコストの削減、回収率の向上など、目に見える性能改善をもたらし、新規開発と成熟した資産の両方において、デジタル油田ソリューションのビジネス上の妥当性を強化します。
本レポートは、世界、地域、国レベルでの収益成長を予測し、2021年から2033年までの各サブセグメントにおける最新の業界動向を分析しています。本調査の目的のため、Grand View Researchは、世界のデジタル油田市場レポートをソリューション、用途、プロセス、地域に基づいてセグメント化しました。
Digital Oilfield Market Summary
The global digital oilfield market size was estimated at USD 30.78 billion in 2025 and is projected to reach USD 47.85 billion by 2033, growing at a CAGR of 5.6% from 2026 to 2033. The rapid adoption of real-time data-acquisition technologies across upstream operations is strongly driving the industry.

digital-oilfield-market-size
Key Market Trends & Insights
- The North America digital oilfield market held the largest share of over 34% of the global market in 2025.
- The digital oilfield market in the U.S. is expected to grow at a significant CAGR over the forecast period.
- Based on process, the product optimization segment held the largest market share of over 30% in 2025.
- Based on the solution, the hardware solutions segment held the largest market share in 2025.
- Based on application, the onshore segment held the largest market share in 2025.
Market Size & Forecast
- 2025 Market Size: USD 30.78 Billion
- 2033 Projected Market Size: USD 47.85 Billion
- CAGR (2026-2033): 5.6%
- North America: Largest market in 2025
- Asia Pacific: Fastest growing market
Oil and gas operators are deploying advanced sensors, smart meters, and connected control systems across wells, drilling rigs, pipelines, and processing facilities to continuously capture pressure, temperature, flow rate, and equipment performance data. This continuous data flow enhances field visibility and enables operators to monitor assets remotely, reducing reliance on manual inspections. Remote monitoring is particularly critical for offshore platforms and geographically isolated fields where physical access is expensive and time-consuming. As operators prioritize operational transparency and faster decision-making, investments in digital oilfield architectures continue to accelerate.
Advanced analytics, artificial intelligence, and machine learning are central to transforming raw operational data into actionable insights. Predictive analytics models help identify early warning signs of equipment failure, allowing maintenance teams to intervene before breakdowns occur and avoid costly production losses. AI-driven reservoir modeling and production optimization tools support better well placement, enhanced recovery, and more efficient use of energy and chemicals. These technologies deliver tangible performance improvements, such as higher uptime, lower maintenance costs, and improved recovery rates, strengthening the business case for digital oilfield solutions across both new developments and mature assets.
The shift toward cloud-based infrastructure is another major growth driver, enabling scalable, cost-effective data management for oilfield operations. Cloud platforms allow operators to store vast volumes of seismic data, drilling logs, and production histories while providing high-speed access to analytics tools across geographically dispersed teams. This model reduces capital expenditure on in-house data centers and shortens deployment timelines for digital solutions. Cloud integration also supports collaboration among operators, service providers, and technology vendors, improving workflow efficiency and accelerating innovation across the value chain.
Cost pressure and the need for operational efficiency continue to push oil and gas companies toward digital transformation. Volatile commodity prices and rising development costs have forced operators to focus on maximizing productivity from existing assets while tightly controlling operating expenses. Digital oilfield technologies support the automation of routine tasks, the reduction of non-productive time, and the optimization of labor deployment. Remote operations and automated workflows also improve safety by limiting human exposure to hazardous environments, while helping companies meet stricter environmental and regulatory requirements through better monitoring and reporting.
Solution Insights
Hardware solutions segment held the largest revenue share of over 49% in 2025. Hardware solutions under the solution segment of the digital oilfield market are witnessing steady growth as operators invest in robust field-level infrastructure to enable real-time data capture and automation. Advanced sensors, smart meters, downhole tools, and control systems form the backbone of digital oilfield architectures by continuously collecting high-resolution data on pressure, temperature, flow rates, and equipment health.
Software and service solutions are expanding rapidly as operators prioritize data-driven decision-making and integrated field management. Advanced software platforms aggregate data from drilling, production, and reservoir operations to deliver real-time insights through analytics, AI models, and visualization tools. These solutions support predictive maintenance, production forecasting, and operational optimization, allowing operators to respond quickly to changing reservoir conditions while improving recovery rates and reducing cost per barrel.
Application Insights
Onshore segment held the revenue share of over 64.0% in 2025, as operators focus on maximizing efficiency across large, geographically dispersed asset bases. Onshore fields, particularly shale and tight oil plays, involve high well counts and frequent drilling and completion activity, which creates significant demand for real-time monitoring, automation, and data analytics. Digital oilfield solutions enable operators to standardize workflows, optimize drilling and production performance, and rapidly identify underperforming wells, thereby reducing operating costs and improving capital productivity across mature and unconventional onshore assets.
The offshore segment is witnessing accelerated growth as operators prioritize operational efficiency and risk reduction in high-cost, technically complex environments. Offshore fields involve significant capital investment and harsh operating conditions, which heighten the need for real-time monitoring, advanced analytics, and automation to ensure stable production and asset integrity. Digital oilfield solutions support continuous surveillance of wells, subsea equipment, and surface facilities, enabling early detection of anomalies and optimized production control that helps reduce unplanned downtime and costly offshore interventions.
Process Insights
Product optimization held the largest revenue share of over 30% in 2025.Product optimization is expanding as operators increasingly rely on real-time production data and advanced analytics to maximize output from existing assets. The integration of sensors, automation systems, and AI-driven analytics enables continuous monitoring of well performance, early identification of production losses, and rapid corrective actions such as optimizing lift systems or adjusting flow parameters. This data-centric approach improves recovery rates and reduces operating costs, which is critical for mature and marginal fields where incremental efficiency gains directly impact profitability.
Drilling optimization is gaining strong momentum as operators seek to reduce non-productive time and drilling costs while improving well placement accuracy. Advanced drilling analytics integrate real-time data from downhole sensors, mud logging systems, and surface equipment to optimize parameters such as weight on bit, rotary speed, and mud flow in real time. These capabilities help prevent stuck pipe, kicks, and premature bit wear, leading to faster drilling cycles and consistent well quality, particularly in complex shale and deepwater formations.
Regional Insights
North America held over 34% revenue share of the global digital oilfield market, driven by the relentless pursuit of operational efficiency and cost reduction in a highly competitive, market-driven environment. The region’s dominance in unconventional shale plays, particularly in the Permian Basin, necessitates granular, real-time data to manage complex, fast-declining wells and optimize hydraulic fracturing operations. Initiatives like The Open Group’s Open Subsurface Data Universe (OSDU) data platform, heavily backed by major operators, are critical drivers, as they break down data silos and enable cloud-based analytics across the asset lifecycle. Leading operators leveraging advanced analytics and digital twins have achieved production increases of up to 10% and reductions in downtime by up to 30%. This data-centric approach is essential for maintaining profitability amid price volatility and investor pressure for capital discipline and free cash flow.
U.S. Digital Oilfield Market Trends
The digital oilfield industry in the U.S. has gained from robust investments in and adoption of advanced technologies. For instance, the U.S. Environmental Protection Agency’s (EPA) final rule on methane emissions (December 2023) mandates rigorous leak detection and repair (LDAR) using advanced technologies like continuous aerial screeners and ground-based sensors. This creates a direct market for digital oilfield solutions that generate verifiable, auditable data streams. Consequently, investment is soaring; Pioneer Natural Resources reported deploying over 15,000 continuous methane monitors across its Permian operations.
Asia Pacific Digital Oilfield Market Trends
The digital oilfield industry in the Asia Pacific is witnessing a surge in demand for oil and gas. With the Asia Pacific region accounting for over 36% of global oil and gas demand (IEA), countries like China and India are aggressively pursuing digital transformation to bolster energy security. For instance, China’s “Made in China 2025” initiative and India’s “Digital India” campaign provide policy frameworks that incentivize the adoption of Industrial IoT and big data analytics in the energy sector. This is translating into tangible projects; major NOCs like ONGC in India have implemented integrated operations centers that use real-time data from thousands of wellhead sensors to optimize production, reportedly improving asset utilization by 15-20% and reducing operational costs significantly.
Europe Digital Oilfield Market Trends
The digital oilfield industry in Europe is driven by a unique mix of mature, high-cost assets and the world’s most ambitious decarbonization agenda. The region is fundamentally gearing toward extending field life, ensuring safe decommissioning, and achieving net-zero operations. The region’s offshore basins in the North Sea and Norwegian Continental Shelf are characterized by complex, aging infrastructure where maximizing recovery and optimizing operational expenditure (OPEX) are critical.
Middle East & Africa Digital Oilfield Market Trends
The digital oilfield industry in the Middle East & Africa (MEA) region is fueled by the strategic objective of maximizing the long-term value and sustainability of the world’s largest and most prolific hydrocarbon reserves. For the major national oil companies (NOCs) in the Gulf Cooperation Council (GCC) countries, such as Saudi Aramco, ADNOC, and QatarEnergy, digitalization is a core pillar of ambitious national transformation plans, such as Saudi Vision 2030 and the UAE’s “Operation 300bn” industrial strategy. These NOCs are deploying massive, integrated digital programs to achieve unprecedented operational efficiency, cost reduction, and reservoir recovery rates.
Key Digital Oilfield Company Insights
Some of the key players operating in the global market include SLB, Weatherford, Halliburton, Baker Hughes Company, and NOV, among others. These companies are actively expanding their market footprint through product innovation, strategic acquisitions, and collaborations to enhance their global distribution networks and technology capabilities.
Key Digital Oilfield Companies:
The following key companies have been profiled for this study on the digital oilfield market
- SLB
- Weatherford
- Halliburton
- Baker Hughes Company
- NOV
- Pason Systems Corp.
- Kongsberg Digital
- Viridien (CGG)
- Honeywell International Inc.
- Nabors Industries Ltd.
Recent Developments
- In June 2025, Huawei advanced its AI-driven initiatives in the oil and gas sector, notably through collaborations highlighted in industry discussions on digital oilfields. Efforts focused on integrating AI, 5G, cloud computing, and big data to transform traditional upstream operations into intelligent systems, as seen in partnerships with major players such as Changqing Oilfield to enable unstaffed wellsites and real-time data analysis.
Digital Oilfield Market Report Scope
| Report Attribute | Details |
| Market Definition | The digital oilfield market refers to the revenue generated from digital solutions used to optimize upstream oil & gas operations. |
| Market size value in 2026 | USD 32.66 billion |
| Revenue forecast in 2033 | USD 47.85 billion |
| Growth rate | CAGR of 5.6% from 2026 to 2033 |
| Base year for estimation | 2025 |
| Historical data | 2021 – 2024 |
| Forecast period | 2026 – 2033 |
| Quantitative Units | Revenue in USD million/billion, and CAGR from 2026 to 2033 |
| Report coverage | Revenue forecast, competitive landscape, growth factors, and trends |
| Segments covered | Solution, application, process, region |
| Regional scope | North America; Europe; Asia Pacific; Latin America; Middle East & Africa |
| Country scope | U.S.; Canada; Mexico; Germany; UK; France; Spain; Italy; China; India; Japan; South Korea; Brazil; Argentina; Saudi Arabia; UAE; South Africa |
| Key companies profiled | SLB; Weatherford; Halliburton; Baker Hughes Company; NOV; Pason Systems Corp.; Kongsberg Digital; Viridien (CGG); Honeywell International Inc.; Nabors Industries Ltd. |
| Customization scope | Free report customization (equivalent up to 8 analysts working days) with purchase. Addition or alteration to country, regional & segment scope. |
Global Digital Oilfield Market Report Segmentation
This report forecasts revenue growth at global, regional, and country levels and provides an analysis of the latest industry trends in each of the sub-segments from 2021 to 2033. For the purpose of this study, Grand View Research has segmented the global digital oilfield market report on the basis of solution, application, process, and region.
- Process Outlook (Revenue, USD Million, 2021 – 2033)
- Product Optimization
- Drilling Optimization
- Reservoir Optimization
- Safety Management
- Asset Management
- Solution Outlook (Revenue, USD Million, 2021 – 2033)
- Hardware Solution
- Software & Service Solutions
- Data Storage Solutions
- Application Outlook (Revenue, USD Million, 2021 – 2033)
- Onshore
- Offshore
- Regional Outlook (Revenue, USD Million, 2021 – 2033)
- North America
- U.S.
- Canada
- Mexico
- Europe
- Germany
- UK
- France
- Spain
- Italy
- Asia Pacific
- China
- India
- Japan
- South Korea
- Latin America
- Brazil
- Argentina
- Middle East & Africa
- Saudi Arabia
- UAE
- South Africa
- North America
Table of Contents
Chapter 1. Methodology and Scope
1.1. Market Segmentation & Scope
1.2. Market Definition
1.3. Information Procurement
1.3.1. Information Analysis
1.3.2. Market Formulation & Data Visualization
1.3.3. Data Validation & Publishing
1.4. Research Scope and Assumptions
1.4.1. List of Data Sources
Chapter 2. Executive Summary
2.1. Market Snapshot
2.2. Segmental Outlook
2.3. Competitive Outlook
Chapter 3. Market Variables, Trends, and Scope
3.1. Market Outlook
3.2. Value Chain Analysis
3.3. Regulatory Framework
3.3.1. Standards & Compliance
3.3.2. Regulatory Impact Analysis
3.4. Market Dynamics
3.4.1. Market Driver Analysis
3.4.2. Market Restraint Analysis
3.4.3. Market Opportunities
3.5. Porter’s Five Forces Analysis
3.5.1. Bargaining Power of Suppliers
3.5.2. Bargaining Power of Buyers
3.5.3. Threat of Substitution
3.5.4. Threat of New Entrants
3.5.5. Competitive Rivalry
3.6. PESTLE Analysis
3.6.1. Political
3.6.2. Economic
3.6.3. Social Landscape
3.6.4. Process
3.6.5. Environmental
3.6.6. Legal
Chapter 4. Digital Oilfield Market: Process Estimates & Trend Analysis
4.1. Digital Oilfield Market: Application Movement Analysis, 2025 & 2033
4.2. Product Optimization
4.2.1. Market estimates and forecasts, 2021 – 2033 (USD Million)
4.3. Drilling Optimization
4.3.1. Market estimates and forecasts, 2021 – 2033 (USD Million)
4.4. Reservoir Optimization
4.4.1. Market estimates and forecasts, 2021 – 2033 (USD Million)
4.5. Safety Management
4.5.1. Market estimates and forecasts, 2021 – 2033 (USD Million)
4.6. Asset Management
4.6.1. Market estimates and forecasts, 2021 – 2033 (USD Million)
Chapter 5. Digital Oilfield Market: Solution Estimates & Trend Analysis
5.1. Digital Oilfield Market: Solution Movement Analysis, 2025 & 2033
5.2. Hardware Solution
5.2.1. Market estimates and forecasts, 2021 – 2033 (USD Million)
5.3. Software & Service Solutions
5.3.1. Market estimates and forecasts, 2021 – 2033 (USD Million)
5.4. Data Storage Solutions
5.4.1. Market estimates and forecasts, 2021 – 2033 (USD Million)
Chapter 6. Digital Oilfield Market: Application Estimates & Trend Analysis
6.1. Digital Oilfield Market: Application Movement Analysis, 2025 & 2033
6.2. Onshore
6.2.1. Market estimates and forecasts, 2021 – 2033 (USD Million)
6.3. Offshore
6.3.1. Market estimates and forecasts, 2021 – 2033 (USD Million)
Chapter 7. Digital Oilfield Market: Regional Estimates & Trend Analysis
7.1. Regional Analysis, 2025 & 2033
7.2. North America
7.2.1. Market estimates and forecasts, 2021 – 2033 (USD Million)
7.2.2. Market estimates and forecasts, by solution, 2021 – 2033 (USD Million)
7.2.3. Market estimates and forecasts, by application, 2021 – 2033 (USD Million)
7.2.4. Market estimates and forecasts, by process, 2021 – 2033 (USD Million)
7.2.5. U.S.
7.2.5.1. Market estimates and forecasts, 2021 – 2033 (USD Million)
7.2.5.2. Market estimates and forecasts, by solution, 2021 – 2033 (USD Million)
7.2.5.3. Market estimates and forecasts, by application, 2021 – 2033 (USD Million)
7.2.5.4. Market estimates and forecasts, by process, 2021 – 2033 (USD Million)
7.2.6. Canada
7.2.6.1. Market estimates and forecasts, 2021 – 2033 (USD Million)
7.2.6.2. Market estimates and forecasts, by solution, 2021 – 2033 (USD Million)
7.2.6.3. Market estimates and forecasts, by application, 2021 – 2033 (USD Million)
7.2.6.4. Market estimates and forecasts, by process, 2021 – 2033 (USD Million)
7.2.7. Mexico
7.2.7.1. Market estimates and forecasts, 2021 – 2033 (USD Million)
7.2.7.2. Market estimates and forecasts, by solution, 2021 – 2033 (USD Million)
7.2.7.3. Market estimates and forecasts, by application, 2021 – 2033 (USD Million)
7.2.7.4. Market estimates and forecasts, by process, 2021 – 2033 (USD Million)
7.3. Europe
7.3.1. Market estimates and forecasts, 2021 – 2033 (USD Million)
7.3.2. Market estimates and forecasts, by solution, 2021 – 2033 (USD Million)
7.3.3. Market estimates and forecasts, by application, 2021 – 2033 (USD Million)
7.3.3.1. Market estimates and forecasts, by process, 2021 – 2033 (USD Million)
7.3.4. Germany
7.3.4.1. Market estimates and forecasts, 2021 – 2033 (USD Million)
7.3.4.2. Market estimates and forecasts, by solution, 2021 – 2033 (USD Million)
7.3.4.3. Market estimates and forecasts, by application, 2021 – 2033 (USD Million)
7.3.4.4. Market estimates and forecasts, by process, 2021 – 2033 (USD Million)
7.3.5. UK
7.3.5.1. Market estimates and forecasts, 2021 – 2033 (USD Million)
7.3.5.2. Market estimates and forecasts, by solution, 2021 – 2033 (USD Million)
7.3.5.3. Market estimates and forecasts, by application, 2021 – 2033 (USD Million)
7.3.5.4. Market estimates and forecasts, by process, 2021 – 2033 (USD Million)
7.3.6. France
7.3.6.1. Market estimates and forecasts, 2021 – 2033 (USD Million)
7.3.6.2. Market estimates and forecasts, by solution, 2021 – 2033 (USD Million)
7.3.6.3. Market estimates and forecasts, by application, 2021 – 2033 (USD Million)
7.3.6.4. Market estimates and forecasts, by process, 2021 – 2033 (USD Million)
7.3.7. Italy
7.3.7.1. Market estimates and forecasts, 2021 – 2033 (USD Million)
7.3.7.2. Market estimates and forecasts, by solution, 2021 – 2033 (USD Million)
7.3.7.3. Market estimates and forecasts, by application, 2021 – 2033 (USD Million)
7.3.7.4. Market estimates and forecasts, by process, 2021 – 2033 (USD Million)
7.3.8. Spain
7.3.8.1. Market estimates and forecasts, 2021 – 2033 (USD Million)
7.3.8.2. Market estimates and forecasts, by solution, 2021 – 2033 (USD Million)
7.3.8.3. Market estimates and forecasts, by application, 2021 – 2033 (USD Million)
7.3.8.4. Market estimates and forecasts, by process, 2021 – 2033 (USD Million)
7.4. Asia Pacific
7.4.1. Market estimates and forecasts, 2021 – 2033 (USD Million)
7.4.2. Market estimates and forecasts, by solution, 2021 – 2033 (USD Million)
7.4.3. Market estimates and forecasts, by application, 2021 – 2033 (USD Million)
7.4.3.1. Market estimates and forecasts, by process, 2021 – 2033 (USD Million)
7.4.4. China
7.4.4.1. Market estimates and forecasts, 2021 – 2033 (USD Million)
7.4.4.2. Market estimates and forecasts, by solution, 2021 – 2033 (USD Million)
7.4.4.3. Market estimates and forecasts, by application, 2021 – 2033 (USD Million)
7.4.4.4. Market estimates and forecasts, by process, 2021 – 2033 (USD Million)
7.4.5. India
7.4.5.1. Market estimates and forecasts, 2021 – 2033 (USD Million)
7.4.5.2. Market estimates and forecasts, by solution, 2021 – 2033 (USD Million)
7.4.5.3. Market estimates and forecasts, by application, 2021 – 2033 (USD Million)
7.4.5.4. Market estimates and forecasts, by process, 2021 – 2033 (USD Million)
7.4.6. Japan
7.4.6.1. Market estimates and forecasts, 2021 – 2033 (USD Million)
7.4.6.2. Market estimates and forecasts, by solution, 2021 – 2033 (USD Million)
7.4.6.3. Market estimates and forecasts, by application, 2021 – 2033 (USD Million)
7.4.6.4. Market estimates and forecasts, by process, 2021 – 2033 (USD Million)
7.4.7. South Korea
7.4.7.1. Market estimates and forecasts, 2021 – 2033 (USD Million)
7.4.7.2. Market estimates and forecasts, by solution, 2021 – 2033 (USD Million)
7.4.7.3. Market estimates and forecasts, by application, 2021 – 2033 (USD Million)
7.4.7.4. Market estimates and forecasts, by process, 2021 – 2033 (USD Million)
7.5. Latin America
7.5.1. Market estimates and forecasts, 2021 – 2033 (USD Million)
7.5.2. Market estimates and forecasts, by solution, 2021 – 2033 (USD Million)
7.5.3. Market estimates and forecasts, by application, 2021 – 2033 (USD Million)
7.5.3.1. Market estimates and forecasts, by process, 2021 – 2033 (USD Million)
7.5.4. Brazil
7.5.4.1. Market estimates and forecasts, 2021 – 2033 (USD Million)
7.5.4.2. Market estimates and forecasts, by solution, 2021 – 2033 (USD Million)
7.5.4.3. Market estimates and forecasts, by application, 2021 – 2033 (USD Million)
7.5.4.4. Market estimates and forecasts, by process, 2021 – 2033 (USD Million)
7.5.5. Argentina
7.5.5.1. Market estimates and forecasts, 2021 – 2033 (USD Million)
7.5.5.2. Market estimates and forecasts, by solution, 2021 – 2033 (USD Million)
7.5.5.3. Market estimates and forecasts, by application, 2021 – 2033 (USD Million)
7.5.5.4. Market estimates and forecasts, by process, 2021 – 2033 (USD Million)
7.6. Middle East & Africa
7.6.1. Market estimates and forecasts, 2021 – 2033 (USD Million)
7.6.2. Market estimates and forecasts, by solution, 2021 – 2033 (USD Million)
7.6.3. Market estimates and forecasts, by application, 2021 – 2033 (USD Million)
7.6.4. Market estimates and forecasts, by process, 2021 – 2033 (USD Million)
7.6.5. Saudi Arabia
7.6.5.1. Market estimates and forecasts, 2021 – 2033 (USD Million)
7.6.5.2. Market estimates and forecasts, by solution, 2021 – 2033 (USD Million)
7.6.5.3. Market estimates and forecasts, by application, 2021 – 2033 (USD Million)
7.6.5.4. Market estimates and forecasts, by process, 2021 – 2033 (USD Million)
7.6.6. UAE
7.6.6.1. Market estimates and forecasts, 2021 – 2033 (USD Million)
7.6.6.2. Market estimates and forecasts, by solution, 2021 – 2033 (USD Million)
7.6.6.3. Market estimates and forecasts, by application, 2021 – 2033 (USD Million)
7.6.6.4. Market estimates and forecasts, by process, 2021 – 2033 (USD Million)
7.6.7. South Africa
7.6.7.1. Market estimates and forecasts, 2021 – 2033 (USD Million)
7.6.7.2. Market estimates and forecasts, by solution, 2021 – 2033 (USD Million)
7.6.7.3. Market estimates and forecasts, by application, 2021 – 2033 (USD Million)
7.6.7.4. Market estimates and forecasts, by process, 2021 – 2033 (USD Million)
Chapter 8. Competitive Landscape
8.1. Recent Developments By Key Market Participants
8.2. Company Categorization
8.3. Company Market Share & Positioning Analysis, 2025
8.4. Heat Map Analysis
8.5. Vendor Landscape
8.5.1. List of Suppliers
8.5.2. List of Distributors/Traders
8.5.3. List of Other Prominent Manufacturers
8.6. List of Prospective End Users
8.7. Strategy Mapping
8.8. Company Profiles/Listing
8.8.1. SLB
8.8.1.1. Company Overview
8.8.1.2. Financial Performance
8.8.1.3. Product Benchmarking
8.8.2. Weatherford
8.8.2.1. Company Overview
8.8.2.2. Financial Performance
8.8.2.3. Product Benchmarking
8.8.3. Halliburton
8.8.3.1. Company Overview
8.8.3.2. Financial Performance
8.8.3.3. Product Benchmarking
8.8.4. Baker Hughes Company
8.8.4.1. Company Overview
8.8.4.2. Financial Performance
8.8.4.3. Product Benchmarking
8.8.5. NOV
8.8.5.1. Company Overview
8.8.5.2. Financial Performance
8.8.5.3. Product Benchmarking
8.8.6. Pason Systems Corp.
8.8.6.1. Company Overview
8.8.6.2. Financial Performance
8.8.6.3. Product Benchmarking
8.8.7. Kongsberg Digital
8.8.7.1. Company Overview
8.8.7.2. Financial Performance
8.8.7.3. Product Benchmarking
8.8.8. Viridien (CGG)
8.8.8.1. Company Overview
8.8.8.2. Financial Performance
8.8.8.3. Product Benchmarking
8.8.9. Honeywell International Inc.
8.8.9.1. Company Overview
8.8.9.2. Financial Performance
8.8.9.3. Product Benchmarking
8.8.10. Nabors Industries Ltd.
8.8.10.1. Company Overview
8.8.10.2. Financial Performance
8.8.10.3. Product Benchmarking
List of Tables
Table 1 Digital oilfield market estimates & forecasts, 2021 – 2033 (USD Million)
Table 2 Digital oilfield market estimates & forecasts, by Hardware Solution, 2021 – 2033 (USD Million)
Table 3 Digital oilfield market estimates & forecasts, in Software & Service Solutions, 2021 – 2033 (USD Million)
Table 4 Digital oilfield market estimates & forecasts, in Data Storage Solutions, 2021 – 2033 (USD Million)
Table 5 Digital oilfield market estimates & forecasts, in Onshore, 2021 – 2033 (USD Million)
Table 6 Digital oilfield market estimates & forecasts, in Offshore, 2021 – 2033 (USD Million)
Table 7 Digital oilfield market estimates & forecasts, in Product Optimization, 2021 – 2033 (USD Million)
Table 8 Digital oilfield market estimates & forecasts, in Drilling Optimization, 2021 – 2033 (USD Million)
Table 9 Digital oilfield market estimates & forecasts, in Reservoir Optimization, 2021 – 2033 (USD Million)
Table 10 Digital oilfield market estimates & forecasts, in Safety Management, 2021 – 2033 (USD Million)
Table 11 Digital oilfield market estimates & forecasts, in Asset Management, 2021 – 2033 (USD Million)
Table 12 North America Digital oilfield market estimates & forecast, 2021 – 2033 (USD Million)
Table 13 North America Digital oilfield market estimates & forecasts by solution, 2021 – 2033 (USD Million)
Table 14 North America Digital oilfield market estimates & forecasts by application, 2021 – 2033 (USD Million)
Table 15 North America Digital oilfield market estimates & forecasts by process, 2021 – 2033 (USD Million)
Table 16 U.S. Digital oilfield market estimates & forecasts, 2021 – 2033 (USD Million)
Table 17 U.S. Digital oilfield market estimates & forecasts by solution, 2021 – 2033 (USD Million)
Table 18 U.S. Digital oilfield market estimates & forecasts by application, 2021 – 2033 (USD Million)
Table 19 U.S. Digital oilfield market estimates & forecasts by process, 2021 – 2033 (USD Million)
Table 20 Canada Digital oilfield market estimates & forecasts, 2021 – 2033 (USD Million)
Table 21 Canada Digital oilfield market estimates & forecasts by solution, 2021 – 2033 (USD Million)
Table 22 Canada Digital oilfield market estimates & forecasts by application, 2021 – 2033 (USD Million)
Table 23 Canada Digital oilfield market estimates & forecasts by process, 2021 – 2033 (USD Million)
Table 24 Mexico Digital oilfield market estimates & forecasts, 2021 – 2033 (USD Million)
Table 25 Mexico Digital oilfield market estimates & forecasts by solution, 2021 – 2033 (USD Million)
Table 26 Mexico Digital oilfield market estimates & forecasts by application, 2021 – 2033 (USD Million)
Table 27 Mexico Digital oilfield market estimates & forecasts by process, 2021 – 2033 (USD Million)
Table 28 Europe Digital oilfield market estimates & forecasts, 2021 – 2033 (USD Million)
Table 29 Europe Digital oilfield market estimates & forecasts by solution, 2021 – 2033 (USD Million)
Table 30 Europe Digital oilfield market estimates & forecasts by application, 2021 – 2033 (USD Million)
Table 31 Europe Digital oilfield market estimates & forecasts by process, 2021 – 2033 (USD Million)
Table 32 Germany Digital oilfield market estimates & forecasts, 2021 – 2033 (USD Million)
Table 33 Germany Digital oilfield market estimates & forecasts by solution, 2021 – 2033 (USD Million)
Table 34 Germany Digital oilfield market estimates & forecasts by application, 2021 – 2033 (USD Million)
Table 35 Germany Digital oilfield market estimates & forecasts by process, 2021 – 2033 (USD Million)
Table 36 France Digital oilfield market estimates & forecasts, 2021 – 2033 (USD Million)
Table 37 France Digital oilfield market estimates & forecasts by solution, 2021 – 2033 (USD Million)
Table 38 France Digital oilfield market estimates & forecasts by application, 2021 – 2033 (USD Million)
Table 39 France Digital oilfield market estimates & forecasts by process, 2021 – 2033 (USD Million)
Table 40 Spain Digital oilfield market estimates & forecast, 2021 – 2033 (USD Million)
Table 41 Spain Digital oilfield market estimates & forecasts by solution, 2021 – 2033 (USD Million)
Table 42 Spain Digital oilfield market estimates & forecasts by application, 2021 – 2033 (USD Million)
Table 43 Spain Digital oilfield market estimates & forecasts by process, 2021 – 2033 (USD Million)
Table 44 UK Digital oilfield market estimates & forecast, 2021 – 2033 (USD Million)
Table 45 UK Digital oilfield market estimates & forecasts by solution, 2021 – 2033 (USD Million)
Table 46 UK Digital oilfield market estimates & forecasts by application, 2021 – 2033 (USD Million)
Table 47 UK Digital oilfield market estimates & forecasts by process, 2021 – 2033 (USD Million)
Table 48 Italy Digital oilfield market estimates & forecast, 2021 – 2033 (USD Million)
Table 49 Italy Digital oilfield market estimates & forecasts by solution, 2021 – 2033 (USD Million)
Table 50 Italy Digital oilfield market estimates & forecasts by application, 2021 – 2033 (USD Million)
Table 51 Italy Digital oilfield market estimates & forecasts by process, 2021 – 2033 (USD Million)
Table 52 Asia Pacific Digital oilfield market estimates & forecast, 2021 – 2033 (USD Million)
Table 53 Asia Pacific Digital oilfield market estimates & forecasts by solution, 2021 – 2033 (USD Million)
Table 54 Asia Pacific Digital oilfield market estimates & forecasts by application, 2021 – 2033 (USD Million)
Table 55 Asia Pacific Digital oilfield market estimates & forecasts by process, 2021 – 2033 (USD Million)
Table 56 China Digital oilfield market estimates & forecast, 2021 – 2033 (USD Million)
Table 57 China Digital oilfield market estimates & forecasts by solution, 2021 – 2033 (USD Million)
Table 58 China Digital oilfield market estimates & forecasts by application, 2021 – 2033 (USD Million)
Table 59 China Digital oilfield market estimates & forecasts by process, 2021 – 2033 (USD Million)
Table 60 Japan Digital oilfield market estimates & forecast, 2021 – 2033 (USD Million)
Table 61 Japan Digital oilfield market estimates & forecasts by solution, 2021 – 2033 (USD Million)
Table 62 Japan Digital oilfield market estimates & forecasts by application, 2021 – 2033 (USD Million)
Table 63 Japan Digital oilfield market estimates & forecasts by process, 2021 – 2033 (USD Million)
Table 64 South Korea Digital oilfield market estimates & forecast, 2021 – 2033 (USD Million)
Table 65 South Korea Digital oilfield market estimates & forecasts by solution, 2021 – 2033 (USD Million)
Table 66 South Korea Digital oilfield market estimates & forecasts by application, 2021 – 2033 (USD Million)
Table 67 South Korea Digital oilfield market estimates & forecasts by process, 2021 – 2033 (USD Million)
Table 68 India Digital oilfield market estimates & forecast, 2021 – 2033 (USD Million)
Table 69 India Digital oilfield market estimates & forecasts by solution, 2021 – 2033 (USD Million)
Table 70 India Digital oilfield market estimates & forecasts by application, 2021 – 2033 (USD Million)
Table 71 India Digital oilfield market estimates & forecasts by process, 2021 – 2033 (USD Million)
Table 72 Latin America Digital oilfield market estimates & forecasts, 2021 – 2033 (USD Million)
Table 73 Latin America Digital oilfield market estimates & forecasts by solution, 2021 – 2033 (USD Million)
Table 74 Latin America Digital oilfield market estimates & forecasts by application, 2021 – 2033 (USD Million)
Table 75 Latin America Digital oilfield market estimates & forecasts by process, 2021 – 2033 (USD Million)
Table 76 Brazil Digital oilfield market estimates & forecasts, 2021 – 2033 (USD Million)
Table 77 Brazil Digital oilfield market estimates & forecasts by solution, 2021 – 2033 (USD Million)
Table 78 Brazil Digital oilfield market estimates & forecasts by application, 2021 – 2033 (USD Million)
Table 79 Brazil Digital oilfield market estimates & forecasts by process, 2021 – 2033 (USD Million)
Table 80 Argentina Digital oilfield market estimates & forecasts, 2021 – 2033 (USD Million)
Table 81 Argentina Digital oilfield market estimates & forecasts by solution, 2021 – 2033 (USD Million)
Table 82 Argentina Digital oilfield market estimates & forecasts by application, 2021 – 2033 (USD Million)
Table 83 Argentina Digital oilfield market estimates & forecasts by process, 2021 – 2033 (USD Million)
Table 84 Middle East & Africa Digital oilfield market estimates & forecast, 2021 – 2033 (USD Million)
Table 85 Middle East & Africa Digital oilfield market estimates & forecasts by solution, 2021 – 2033 (USD Million)
Table 86 Middle East & Africa Digital oilfield market estimates & forecasts by application, 2021 – 2033 (USD Million)
Table 87 Middle East & Africa Digital oilfield market estimates & forecasts by process, 2021 – 2033 (USD Million)
Table 88 Saudi Arabia Digital oilfield market estimates & forecasts, 2021 – 2033 (USD Million)
Table 89 Saudi Arabia Digital oilfield market estimates & forecasts by solution, 2021 – 2033 (USD Million)
Table 90 Saudi Arabia Digital oilfield market estimates & forecasts by application, 2021 – 2033 (USD Million)
Table 91 Saudi Arabia Digital oilfield market estimates & forecasts by process, 2021 – 2033 (USD Million)
Table 92 UAE Digital oilfield market estimates & forecast, 2021 – 2033 (USD Million)
Table 93 UAE Digital oilfield market estimates & forecasts by solution, 2021 – 2033 (USD Million)
Table 94 UAE Digital oilfield market estimates & forecasts by application, 2021 – 2033 (USD Million)
Table 95 UAE Digital oilfield market estimates & forecasts by process, 2021 – 2033 (USD Million)
Table 96 South Africa Digital oilfield market estimates & forecast, 2021 – 2033 (USD Million)
Table 97 South Africa Digital oilfield market estimates & forecasts by solution, 2021 – 2033 (USD Million)
Table 98 South Africa Digital oilfield market estimates & forecasts by application, 2021 – 2033 (USD Million)
Table 99 South Africa Digital oilfield market estimates & forecasts by process, 2021 – 2033 (USD Million)
List of Figures
Fig. 1 Market segmentation
Fig. 2 Information procurement
Fig. 3 Data analysis models
Fig. 4 Market formulation and validation
Fig. 5 Data validating & publishing
Fig. 6 Market snapshot
Fig. 7 Segmental outlook – Application, Solution & Process
Fig. 8 Competitive Outlook
Fig. 9 Digital oilfield market outlook, 2021 – 2033 (USD Million)
Fig. 10 Value chain analysis
Fig. 11 Market dynamics
Fig. 12 Porter’s Analysis
Fig. 13 PESTEL Analysis
Fig. 14 Digital oilfield market, by solution: Key takeaways
Fig. 15 Digital oilfield market, by solution: Market share, 2025 & 2033
Fig. 16 Digital oilfield market, by application: Key takeaways
Fig. 17 Digital oilfield market, by application: Market share, 2025 & 2033
Fig. 18 Digital oilfield market, by process: Key takeaways
Fig. 19 Digital oilfield market, by process: Market share, 2025 & 2033
Fig. 20 Digital oilfield market: Regional analysis, 2025 & 2033
Fig. 21 Digital oilfield market, by region: Key takeaways