Contact Lenses Market Size, Share & Trends Analysis Report By Product (Soft Contact Lenses, Rigid Gas Permeable, Specialty Contact Lens), By Modality, By Application, By Replacement Schedule, By Distribution Channel, By Region, And Segment Forecasts, 2026 - 2033
コンタクトレンズ市場 - 製品(ソフトコンタクトレンズ、ハードコンタクトレンズ、特殊コンタクトレンズ)、種類別、用途別、交換時期別、流通チャネル別、地域、セグメント別予測による市場規模、成長と動向分析レポート 2026-2033年
| 出版 | Grand View Research |
| 出版年月 | 2026年02月 |
| ページ数 | 150 |
| 価格 | 記載以外のライセンスについてはお問合せください |
| シングルユーザ | USD 5,950 |
| 種別 | 英文調査報告書 |
| 商品番号 | SMR-1639516395 |

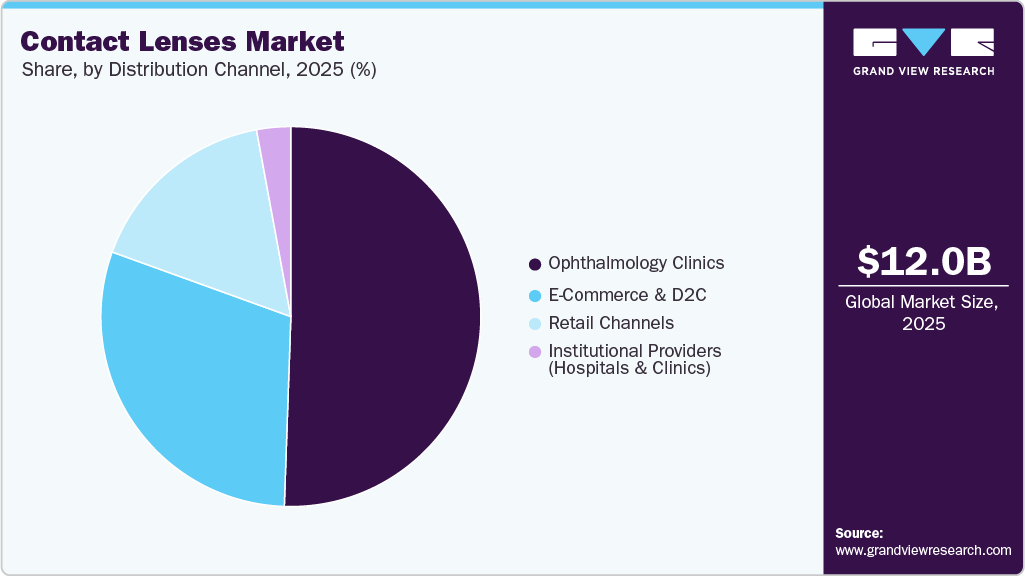
世界のコンタクトレンズ市場規模は、2025年には120億米ドルと評価され、2033年までに162億米ドルに達すると予測されており、2026年から2033年にかけて年平均成長率(CAGR)3.9%に達するとGrand View Researchでは予測しています。近視、遠視、老眼、乱視といった屈折異常の増加は、世界的なコンタクトレンズ需要を牽引する主要因となっています。
主要市場動向とインサイト
- 北米のコンタクトレンズ市場は、2025年時点で世界市場の45.2%を占め、最大のシェアを獲得しました。
- アジア太平洋地域のコンタクトレンズ市場は、予測期間中に大幅な成長が見込まれています。
- 製品別に見ると、ソフトコンタクトレンズが2025年時点で88.8%と最大の市場シェアを占めました。
- レンズの種類別に見ると、球面レンズが2025年時点で最大の市場シェアを占めました。
- 用途別に見ると、矯正レンズが2025年時点で最大の市場シェアを占めました。
高齢化が進み、眼疾患のリスクが高まるにつれ、コンタクトレンズの需要も増加しています。2023年5月の視力健康月間には、カナダ眼科学会(COS)が、特に高齢者における視力ケアの重要性を強調しました。さらに、世界の保健機関は、近視の有病率が世界的に上昇しており、2050年までに世界人口の半数以上が影響を受ける可能性があると指摘しており、矯正レンズと近視進行抑制レンズの両方に対する長期的な需要が見込まれます。加えて、利便性、審美性、そしてアクティブでデジタルなライフスタイルとの適合性といった理由から、コンタクトレンズを選択する人が増えています。
光学および検眼分野における数多くの研究開発が、技術向上に向けて進められてきました。先進的な機能を備えたダイナミックソフトコンタクトレンズの導入といったイノベーションが、市場の成長を牽引しています。例えば、2022年7月、Mojo Vision社は、片眼用として設計された最新のMojo Lensのプロトタイプの試験に成功したと発表しました。この革新的な拡張現実(AR)コンタクトレンズは、医療グレードのマイクロバッテリー、マイクロLEDディスプレイ、アップグレードされたハードウェアなどの高度な機能を搭載しています。さらに、通信機能、視線追跡、専用ソフトウェアなど、さまざまな技術を統合しています。片目に1枚のレンズを装着した状態でのテストは既に実施されていますが、同社は2枚のレンズをペアで動作させ、ARや仮想現実(VR)と同様の3Dビューをユーザーに提供することを目指しています。
Contact Lenses Market Summary
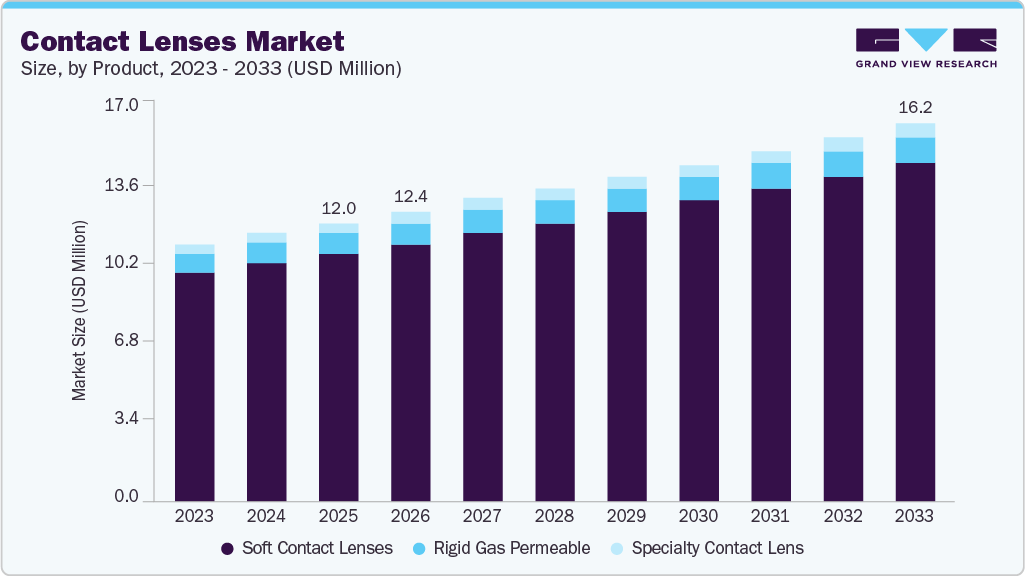
The global contact lenses market size was valued at USD 12.0 billion in 2025 and is estimated to reach USD 16.2 billion by 2033, growing at a CAGR of 3.9% from 2026 to 2033. The increasing cases of refractive errors, such as myopia, hyperopia, presbyopia, and astigmatism, are the major factors driving the demand for contact lenses globally.
contact-lenses-market-size
Key Market Trends & Insights
- North America’s contact lenses market held the largest share of 45.2% of the global market in 2025.
- The Asia Pacific contact lenses industry is expected to grow significantly over the forecast period.
- By product, the soft contact lenses segment held the highest market share of 88.8% in 2025.
- By modality, the sphere segment held a leading market share in 2025.
- By application, the corrective segment held a leading market share in 2025.
Market Size & Forecast
- 2025 Market Size: USD 12.0 Billion
- 2033 Projected Market Size: USD 16.2 Billion
- CAGR (2026-2033): 3.9%
- North America: Largest market in 2025
- Asia Pacific: Fastest growing market
The growing aging population, which is prone to eye disease, has also created the demand for contact lenses. In May 2023, during Vision Health Month, the Canadian Ophthalmological Society (COS) emphasized the significance of vision health care, especially among the country’s senior citizens. Moreover, global health authorities note that myopia prevalence is rising worldwide and may affect more than half of the global population by 2050, creating long-term demand for both corrective and myopia-management lenses. In addition, the rising number of people choosing contact lenses due to their convenience, aesthetics, and compatibility with active and digital lifestyles.
Numerous research and development initiatives in optics and optometry have been undertaken to enhance technology. Innovations like introducing dynamic soft contact lenses with advanced features have driven market growth. For instance, in July 2022, Mojo Vision announced that it had successfully performed testing on its newest prototype of the Mojo Lens, which is designed for one eye. This innovative augmented reality (AR) contact lens incorporates advanced features such as medical-grade micro batteries, a micro-LED display, and upgraded hardware. Additionally, it integrates various technologies, including communication capabilities, eye tracking, and specialized software. Testing has been conducted for one lens in one eye. However, the company aims to have two lenses operating as a pair, allowing users to obtain a 3D view similar to AR and virtual reality (VR).
Similarly, in October 2025, XPANCEO presented several smart contact lens prototypes featuring integrated microbatteries, biosensing technologies, and health-monitoring capabilities. The prototypes included lenses designed for real-time health readings and intraocular pressure monitoring, showing how R&D is advancing toward medical diagnostic applications. These innovations illustrate increasing convergence between optometry, digital health, and wearable electronics. Moreover, contact lenses are more appropriate for individuals seeking convenient, non-surgical vision correction for refractive errors and active lifestyles, while intraocular lenses are primarily used in cataract surgeries and presbyopia correction. Increasing awareness coupled with supportive government initiatives, technological advancements in multifocal and toric lenses, and growing preference for effective and long-term vision solutions will further drive contact and intraocular lenses market growth. In December 2022, the U.S. government announced that USD 6.5 million would be allocated for vision and eye health programs conducted by the Centers for Disease Control and Prevention (CDC). The fund comes as a part of the government’s initiative toward the prevalence of vision impairment and eye disease across the country.
The expansion of the contact lens market is significantly influenced by the rising trend of cosmetic and colored lenses, which are increasingly sought after for aesthetic purposes. Additionally, individuals who lead active lifestyles, including athletes and those participating in various physical activities, are turning to contact lenses for their enhanced convenience and comfort. These users favor contact lenses over traditional glasses for their advantages, such as unrestricted vision and greater freedom of movement and drives the growth of cosmetic contact lenses market. In addition, demand for bandage contact lenses is rising due to increasing cases of eye injuries, surgeries, and dry eye conditions. These lenses help protect the cornea, reduce pain, and support faster healing. Growing awareness among patients and improved access to eye care services are further driving the growth of bandage contact lenses market globally.
Moreover, the appeal of contact lenses continues to grow among those with dynamic lifestyles, as these lenses provide a practical solution that aligns with their needs. The ongoing innovation from market players also contributes to this trend, as new product launches are expected to stimulate demand within the sector further.
Key Contact Lenses Company Insight
The contact lenses market is highly competitive and has several key players. The major market players are focusing on expanding their geographical presence, forming strategic partnerships with eye care providers and retail channels to enhance accessibility and patient experience, leveraging collaborations to advance lens materials and smart vision technologies, and pursuing mergers and acquisitions to strengthen product portfolios and market positioning.
Key Contact Lenses Companies:
The following key companies have been profiled for this study on the contact lenses market.
- Johnson & Johnson Services, Inc. (Johnson & Johnson Vision Care, Inc.)
- Bausch + Lomb
- ALCON INC.
- CooperCompanies (CooperVision)
- Contamac
- HOYA CORPORATION (HOYA Corporation Contact Lens Division)
- SEED Co., Ltd.
- EssilorLuxottica
- Menicon Co., Ltd.
- Euclid Vision Group
Recent Development
- In june 2025, Johnson & Johnson announced the launch of its first daily disposable multifocal toric contact lens under its vision care segment, marking a significant innovation for patients with both astigmatism and presbyopia. The product expands the company’s premium soft contact lens portfolio, addressing unmet vision correction needs with improved comfort and visual clarity.
- In October 2023, XPANCEO, a deep tech startup, raised USD 40 million in a seed funding round to develop the first contact lenses featuring augmented reality (AR) capabilities. Opportunity Ventures (Asia), based in Hong Kong, led this funding round. The capital will be utilized to advance the next prototype, which aims to integrate multiple features into a single device.
- In January 2023, Carter Ledyard’s client CooperVision, Inc. finalized its acquisition of SynergEyes, Inc., which offers a diverse array of specialty contact lenses, including unique hybrid lenses. These products enhance CooperVision’s portfolio, particularly its Onefit scleral lenses.
Contact Lenses Market Report Scope
| Report Attribute | Details |
| Market size value in 2026 | USD 12.4 billion |
| Revenue forecast in 2033 | USD 16.2 billion |
| Growth rate | CAGR of 3.9% from 2026 to 2033 |
| Base year for estimation | 2025 |
| Historical data | 2021 – 2024 |
| Forecast period | 2026 – 2033 |
| Quantitative units | Revenue in USD million and CAGR from 2026 to 2033 |
| Report coverage | Revenue forecast, company ranking, competitive landscape, growth factors, and trends |
| Segments covered | Product, modality, application, replacement schedule, distribution channel,region |
| Regional scope | North America; Europe; Asia Pacific; Latin America; MEA |
| Country scope | U.S.; Canada; UK; Germany; France; Italy; Spain; Denmark; Sweden; Norway: Japan; China India; Australia; Thailand; South Korea; Brazil; Argentina; Mexico; South Africa; Saudi Arabia; UAE; Kuwait |
| Key companies profiled | Johnson & Johnson Services, Inc. (Johnson & Johnson Vision Care, Inc.); Bausch + Lomb; ALCON INC.; CooperCompanies (CooperVision); Contamac; HOYA CORPORATION (HOYA Corporation Contact Lens Division); SEED Co., Ltd.; EssilorLuxottica; Menicon Co., Ltd.; Euclid Vision Group |
| Customization scope | Free report customization (equivalent up to 8 analyst’s working days) with purchase. Addition or alteration to country, regional, and segment scope |
Global Contact Lenses Market Report Segmentation
This report forecasts revenue growth at global, regional, and country levels and provides an analysis of the latest industry trends in each of the sub-segments from 2021 to 2033. For the purpose of this study, Grand View Research has segmented the global contact lenses market report based on product, modality, application, replacement schedule, distribution channel, and region:
- Product Outlook (Revenue, USD Unit, 2021 – 2033)
- Soft Contact Lenses
- Hyrdogel
- Silicone Hydrogel
- Rigid Gas Permeable
- Specialty Contact Lens
- Soft Contact Lenses
- Modality Outlook (Revenue, USD Unit, 2021 – 2033)
- Sphere
- Toric
- Multifocal
- Application Outlook (Revenue, USD Unit, 2021 – 2033)
- Corrective
- Non-Corrective
- Replacement Schedule Outlook (Revenue, USD Unit, 2021 – 2033)
- Reusable
- Disposables
- Distribution Channel Outlook (Revenue, USD Unit, 2021 – 2033)
- Institutional Providers (Hospitals & Clinics)
- E-Commerce & D2C
- Ophthalmology Clinics
- Retail Channels
- Region Outlook (Revenue, USD Unit, 2021 – 2033)
- North America
- U.S.
- Canada
- Mexico
- Europe
- UK
- Germany
- France
- Italy
- Spain
- Norway
- Denmark
- Sweden
- Asia Pacific
- China
- Japan
- South Korea
- Thailand
- Australia
- India
- Latin America
- Brazil
- Argentina
- MEA
- South Africa
- Saudi Arabia
- UAE
- Kuwait
- North America
Table of Contents
Chapter 1. Methodology and Scope
1.1. Market Segmentation and Scope
1.2. Segment Definitions
1.2.1. Product
1.2.2. Modality
1.2.3. Application
1.2.4. Replacement Schedule
1.2.5. Distribution Channel
1.2.6. Regional scope
1.2.7. Estimates and forecasts timeline
1.3. Research Methodology
1.4. Information Procurement
1.4.1. Purchased database
1.4.2. GVR’s internal database
1.4.3. Secondary sources
1.4.4. Primary research
1.4.5. Details of primary research
1.4.5.1. Data for primary interviews in North America
1.4.5.2. Data for primary interviews in Europe
1.4.5.3. Data for primary interviews in Asia Pacific
1.4.5.4. Data for primary interviews in Latin America
1.4.5.5. Data for Primary interviews in MEA
1.5. Information or Data Analysis
1.5.1. Data analysis models
1.6. Market Formulation & Validation
1.7. Model Details
1.7.1. Commodity flow analysis (Model 1)
1.7.2. Approach 1: Commodity flow approach
1.7.3. Volume price analysis (Model 2)
1.7.4. Approach 2: Volume price analysis
1.8. List of Secondary Sources
1.9. List of Primary Sources
1.10. Objectives
Chapter 2. Executive Summary
2.1. Market Outlook
2.2. Segment Outlook
2.2.1. Product outlook
2.2.2. Modality outlook
2.2.3. Application outlook
2.2.4. Replacement schedule outlook
2.2.5. Distribution channel outlook
2.2.6. Regional outlook
2.3. Competitive Insights
Chapter 3. Contact Lenses Market Variables, Trends & Scope
3.1. Market Lineage Outlook
3.1.1. Parent Market Outlook
3.1.2. Related/ancillary market outlook
3.2. Market Dynamics
3.2.1. Market Driver Analysis
3.2.2. Market Restraint Analysis
3.3. 3.Contact Lenses Market Analysis Tools
3.3.1. Industry Analysis – Porter’s
3.3.1.1. Bargaining power of suppliers
3.3.1.2. Bargaining power of buyers
3.3.1.3. Threat of substitutes
3.3.1.4. Threat of new entrants
3.3.1.5. Competitive rivalry
3.3.2. PESTEL Analysis
3.3.2.1. Political landscape
3.3.2.2. Economic landscape
3.3.2.3. Social landscape
3.3.2.4. Technological landscape
3.3.2.5. Environmental landscape
3.3.2.6. Legal landscape
Chapter 4. Contact Lenses Market: Product Estimates & Trend Analysis
4.1. Segment Dashboard
4.2. Contact Lenses Market: Product Movement Analysis
4.3. Contact Lenses Market by Product Outlook (USD Million)
4.4. Market Size & Forecasts and Trend Analyses, 2021 to 2033 for the following
4.5. Soft Contact Lenses
4.5.1. Soft Contact Lenses Market Revenue Estimates and Forecasts, 2021 – 2033 (USD Million)
4.5.2. Hyrdogel
4.5.2.1. Hydrogel Market Revenue Estimates and Forecasts, 2021 – 2033 (USD Million)
4.5.3. Silicone Hydrogel
4.5.3.1. Silicone Hydrogel Market Revenue Estimates and Forecasts, 2021 – 2033 (USD Million)
4.6. Rigid Gas Permeable
4.6.1. Rigid Gas Permeable Market Revenue Estimates and Forecasts, 2021 – 2033 (USD Million)
4.7. Specialty Contact Lens
4.7.1. Specialty Contact Lens Market Revenue Estimates and Forecasts, 2021 – 2033 (USD Million)
Chapter 5. Contact Lenses Market: Modality Estimates & Trend Analysis
5.1. Segment Dashboard
5.2. Contact Lenses Market: Modality Movement Analysis
5.3. Contact Lenses Market by Modality Outlook (USD Million)
5.4. Market Size & Forecasts and Trend Analyses, 2021 to 2033 for the following
5.5. Sphere
5.5.1. Sphere Market Revenue Estimates and Forecasts, 2021 – 2033 (USD Million)
5.6. Toric
5.6.1. Toric Market Revenue Estimates and Forecasts, 2021 – 2033 (USD Million)
5.7. Multifocal
5.7.1. Multifocal Market Revenue Estimates and Forecasts, 2021 – 2033 (USD Million)
Chapter 6. Contact Lenses Market: Application Estimates & Trend Analysis
6.1. Segment Dashboard
6.2. Contact Lenses Market: Application Movement Analysis
6.3. Contact Lenses Market by Application Outlook (USD Million)
6.4. Market Size & Forecasts and Trend Analyses, 2021 to 2033 for the following
6.5. Corrective
6.5.1. Corrective Market Revenue Estimates and Forecasts, 2021 – 2033 (USD Million)
6.6. Non-Corrective
6.6.1. Non-Corrective Market Revenue Estimates and Forecasts, 2021 – 2033 (USD Million)
Chapter 7. Contact Lenses Market: Replacement Schedule Estimates & Trend Analysis
7.1. Segment Dashboard
7.2. Contact Lenses Market: Replacement Schedule Movement Analysis
7.3. Contact Lenses Market by Replacement Schedule Outlook (USD Million)
7.4. Market Size & Forecasts and Trend Analyses, 2021 to 2033 for the following
7.5. Reusable
7.5.1. Reusable Market Revenue Estimates and Forecasts, 2021 – 2033 (USD Million)
7.6. Disposables
7.6.1. Disposable Market Revenue Estimates and Forecasts, 2021 – 2033 (USD Million)
Chapter 8. Contact Lenses Market: Distribution Channel Estimates & Trend Analysis
8.1. Segment Dashboard
8.2. Contact Lenses Market: Distribution Channel Movement Analysis
8.3. Contact Lenses Market by Distribution Channel Outlook (USD Million)
8.4. Market Size & Forecasts and Trend Analyses, 2021 to 2033 for the following
8.5. Institutional Providers (Hospitals & Clinics)
8.5.1. Institutional Providers (Hospitals & Clinics) Market Revenue Estimates and Forecasts, 2021 – 2033 (USD Million)
8.6. E-Commerce & D2C
8.6.1. E-Commerce & D2C Market Revenue Estimates and Forecasts, 2021 – 2033 (USD Million)
8.7. Ophthalmology Clinics
8.7.1. Ophthalmology Clinics Market Revenue Estimates and Forecasts, 2021 – 2033 (USD Million)
8.8. Retail Channels
8.8.1. Retail Channels Market Revenue Estimates and Forecasts, 2021 – 2033 (USD Million)
Chapter 9. Contact Lenses Market: Regional Estimates & Trend Analysis
9.1. Regional Dashboard
9.2. Regional Contact Lenses Market Movement Analysis
9.3. Contact Lenses Market: Regional Estimates & Trend Analysis by Product & application
9.4. Market Size & Forecasts and Trend Analyses, 2021 to 2033 for the following
9.5. North America
9.5.1. North America Contact Lenses Market Estimates and Forecasts, 2021 – 2033 (USD Million)
9.5.2. U.S.
9.5.2.1. Key Country Dynamics
9.5.2.2. Competitive Scenario
9.5.2.3. Regulatory Framework
9.5.2.4. Reimbursement scenario
9.5.2.5. U.S. Contact Lenses Market Estimates and Forecasts, 2021 – 2033 (USD Million)
9.5.3. Canada
9.5.3.1. Key Country Dynamics
9.5.3.2. Competitive Scenario
9.5.3.3. Regulatory Framework
9.5.3.4. Reimbursement scenario
9.5.3.5. Canada Contact Lenses Market Estimates and Forecasts, 2021 – 2033 (USD Million)
9.5.4. Mexico
9.5.4.1. Key Country Dynamics
9.5.4.2. Competitive Scenario
9.5.4.3. Regulatory Framework
9.5.4.4. Reimbursement scenario
9.5.4.5. Mexico Contact Lenses Market Estimates and Forecasts, 2021 – 2033 (USD Million)
9.6. Europe
9.6.1. Europe Contact Lenses Market Estimates and Forecasts, 2021 – 2033 (USD Million)
9.6.2. UK
9.6.2.1. Key Country Dynamics
9.6.2.2. Competitive Scenario
9.6.2.3. Regulatory Framework
9.6.2.4. Reimbursement scenario
9.6.2.5. UK Contact Lenses Market Estimates and Forecasts, 2021 – 2033 (USD Million)
9.6.3. Germany
9.6.3.1. Key Country Dynamics
9.6.3.2. Competitive Scenario
9.6.3.3. Regulatory Framework
9.6.3.4. Reimbursement scenario
9.6.3.5. Germany Contact Lenses Market Estimates and Forecasts, 2021 – 2033 (USD Million)
9.6.4. France
9.6.4.1. Key Country Dynamics
9.6.4.2. Competitive Scenario
9.6.4.3. Regulatory Framework
9.6.4.4. Reimbursement scenario
9.6.4.5. France Contact Lenses Market Estimates and Forecasts, 2021 – 2033 (USD Million)
9.6.5. Italy
9.6.5.1. Key Country Dynamics
9.6.5.2. Competitive Scenario
9.6.5.3. Regulatory Framework
9.6.5.4. Reimbursement scenario
9.6.5.5. Italy Contact Lenses Market Estimates and Forecasts, 2021 – 2033 (USD Million)
9.6.6. Spain
9.6.6.1. Key Country Dynamics
9.6.6.2. Competitive Scenario
9.6.6.3. Regulatory Framework
9.6.6.4. Reimbursement scenario
9.6.6.5. Spain Contact Lenses Market Estimates and Forecasts, 2021 – 2033 (USD Million)
9.6.7. Denmark
9.6.7.1. Key Country Dynamics
9.6.7.2. Competitive Scenario
9.6.7.3. Regulatory Framework
9.6.7.4. Reimbursement scenario
9.6.7.5. Denmark Contact Lenses Market Estimates and Forecasts, 2021 – 2033 (USD Million)
9.6.8. Sweden
9.6.8.1. Key Country Dynamics
9.6.8.2. Competitive Scenario
9.6.8.3. Regulatory Framework
9.6.8.4. Reimbursement scenario
9.6.8.5. Sweden Contact Lenses Market Estimates and Forecasts, 2021 – 2033 (USD Million)
9.6.9. Norway
9.6.9.1. Key Country Dynamics
9.6.9.2. Competitive Scenario
9.6.9.3. Regulatory Framework
9.6.9.4. Reimbursement scenario
9.6.9.5. Norway Contact Lenses Market Estimates and Forecasts, 2021 – 2033 (USD Million)
9.7. Asia Pacific
9.7.1. Asia Pacific Contact Lenses Market Estimates and Forecasts, 2021 – 2033 (USD Million)
9.7.2. Japan
9.7.2.1. Key Country Dynamics
9.7.2.2. Competitive Scenario
9.7.2.3. Regulatory Framework
9.7.2.4. Reimbursement scenario
9.7.2.5. Japan Contact Lenses Market Estimates and Forecasts, 2021 – 2033 (USD Million)
9.7.3. China
9.7.3.1. Key Country Dynamics
9.7.3.2. Competitive Scenario
9.7.3.3. Regulatory Framework
9.7.3.4. Reimbursement scenario
9.7.3.5. China Contact Lenses Market Estimates and Forecasts, 2021 – 2033 (USD Million)
9.7.4. India
9.7.4.1. Key Country Dynamics
9.7.4.2. Competitive Scenario
9.7.4.3. Regulatory Framework
9.7.4.4. Reimbursement scenario
9.7.4.5. India Contact Lenses Market Estimates and Forecasts, 2021 – 2033 (USD Million)
9.7.5. South Korea
9.7.5.1. Key Country Dynamics
9.7.5.2. Competitive Scenario
9.7.5.3. Regulatory Framework
9.7.5.4. Reimbursement scenario
9.7.5.5. South Korea Contact Lenses Market Estimates and Forecasts, 2021 – 2033 (USD Million)
9.7.6. Australia
9.7.6.1. Key Country Dynamics
9.7.6.2. Competitive Scenario
9.7.6.3. Regulatory Framework
9.7.6.4. Reimbursement scenario
9.7.6.5. Australia Contact Lenses Market Estimates and Forecasts, 2021 – 2033 (USD Million)
9.7.7. Thailand
9.7.7.1. Key Country Dynamics
9.7.7.2. Competitive Scenario
9.7.7.3. Regulatory Framework
9.7.7.4. Reimbursement scenario
9.7.7.5. Thailand Contact Lenses Market Estimates and Forecasts, 2021 – 2033 (USD Million)
9.8. Latin America
9.8.1. Latin America Contact Lenses Market Estimates and Forecasts, 2021 – 2033 (USD Million)
9.8.2. Brazil
9.8.2.1. Key Country Dynamics
9.8.2.2. Competitive Scenario
9.8.2.3. Regulatory Framework
9.8.2.4. Reimbursement scenario
9.8.2.5. Brazil Contact Lenses Market Estimates and Forecasts, 2021 – 2033 (USD Million)
9.8.3. Argentina
9.8.3.1. Key Country Dynamics
9.8.3.2. Competitive Scenario
9.8.3.3. Regulatory Framework
9.8.3.4. Reimbursement scenario
9.8.3.5. Argentina Contact Lenses Market Estimates and Forecasts, 2021 – 2033 (USD Million)
9.9. Middle East & Africa
9.9.1. Middle East & Africa Contact Lenses Market Estimates and Forecasts, 2021 – 2033 (USD Million)
9.9.2. South Africa
9.9.2.1. Key Country Dynamics
9.9.2.2. Competitive Scenario
9.9.2.3. Regulatory Framework
9.9.2.4. Reimbursement scenario
9.9.2.5. South Africa Contact Lenses Market Estimates and Forecasts, 2021 – 2033 (USD Million)
9.9.3. Saudi Arabia
9.9.3.1. Key Country Dynamics
9.9.3.2. Competitive Scenario
9.9.3.3. Regulatory Framework
9.9.3.4. Reimbursement scenario
9.9.3.5. Saudi Arabia Contact Lenses Market Estimates and Forecasts, 2021 – 2033 (USD Million)
9.9.4. UAE
9.9.4.1. Key Country Dynamics
9.9.4.2. Competitive Scenario
9.9.4.3. Regulatory Framework
9.9.4.4. Reimbursement scenario
9.9.4.5. UAE Contact Lenses Market Estimates and Forecasts, 2021 – 2033 (USD Million)
9.9.5. Kuwait
9.9.5.1. Key Country Dynamics
9.9.5.2. Competitive Scenario
9.9.5.3. Regulatory Framework
9.9.5.4. Reimbursement scenario
9.9.5.5. Kuwait Contact Lenses Market Estimates and Forecasts, 2021 – 2033 (USD Million)
Chapter 10. Competitive Landscape
10.1. Market Participant Categorization
10.2. Key Company Profiles
10.2.1. Johnson & Johnson Services, Inc. (Johnson & Johnson Vision Care, Inc.)
10.2.1.1. Company Overview
10.2.1.2. Financial Performance
10.2.1.3. Product Benchmarking
10.2.1.4. Strategic Initiatives
10.2.2. Bausch + Lomb
10.2.2.1. Company Overview
10.2.2.2. Financial Performance
10.2.2.3. Product Benchmarking
10.2.2.4. Strategic Initiatives
10.2.3. ALCON INC.
10.2.3.1. Company Overview
10.2.3.2. Financial Performance
10.2.3.3. Product Benchmarking
10.2.3.4. Strategic Initiatives
10.2.4. CooperCompanies (CooperVision)
10.2.4.1. Company Overview
10.2.4.2. Financial Performance
10.2.4.3. Product Benchmarking
10.2.4.4. Strategic Initiatives
10.2.5. Contamac
10.2.5.1. Company Overview
10.2.5.2. Financial Performance
10.2.5.3. Product Benchmarking
10.2.5.4. Strategic Initiatives
10.2.6. HOYA CORPORATION (HOYA Corporation Contact Lens Division)
10.2.6.1. Company Overview
10.2.6.2. Financial Performance
10.2.6.3. Product Benchmarking
10.2.6.4. Strategic Initiatives
10.2.7. SEED Co., Ltd.
10.2.7.1. Company Overview
10.2.7.2. Financial Performance
10.2.7.3. Product Benchmarking
10.2.7.4. Strategic Initiatives
10.2.8. EssilorLuxottica
10.2.8.1. Company Overview
10.2.8.2. Financial Performance
10.2.8.3. Product Benchmarking
10.2.8.4. Strategic Initiatives
10.2.9. Menicon Co., Ltd.
10.2.9.1. Company Overview
10.2.9.2. Financial Performance
10.2.9.3. Product Benchmarking
10.2.9.4. Strategic Initiatives
10.2.10. Euclid Vision Group
10.2.10.1. Company Overview
10.2.10.2. Financial Performance
10.2.10.3. Product Benchmarking
10.2.10.4. Strategic Initiatives
List of Tables
Table 1 List of secondary sources
Table 2 List of abbreviations
Table 3 Global Contact Lenses Market, by Product, 2021 – 2033 (USD Million)
Table 4 Global Contact Lenses Market, by Modality, 2021 – 2033 (USD Million)
Table 5 Global Contact Lenses Market, by Application, 2021 – 2033 (USD Million)
Table 6 Global Contact Lenses Market, by Replacement Schedule, 2021 – 2033 (USD Million)
Table 7 Global Contact Lenses Market, by Distribution Channel, 2021 – 2033 (USD Million)
Table 8 North America Contact Lenses Market, by Country, 2021 – 2033 (USD Million)
Table 9 North America Contact Lenses Market, by Product, 2021 – 2033 (USD Million)
Table 10 North America Contact Lenses Market, by Modality, 2021 – 2033 (USD Million)
Table 11 North America Contact Lenses Market, by Application, 2021 – 2033 (USD Million)
Table 12 North America Contact Lenses Market, by Replacement Schedule, 2021 – 2033 (USD Million)
Table 13 North America Contact Lenses Market, by Distribution Channel, 2021 – 2033 (USD Million)
Table 14 U.S. Contact Lenses Market, by Product, 2021 – 2033 (USD Million)
Table 15 U.S. Contact Lenses Market, by Modality, 2021 – 2033 (USD Million)
Table 16 U.S. Contact Lenses Market, by Application, 2021 – 2033 (USD Million)
Table 17 U.S. Contact Lenses Market, by Replacement Schedule, 2021 – 2033 (USD Million)
Table 18 U.S. Contact Lenses Market, by Distribution Channel, 2021 – 2033 (USD Million)
Table 19 Canada Contact Lenses Market, by Product, 2021 – 2033 (USD Million)
Table 20 Canada Contact Lenses Market, by Modality, 2021 – 2033 (USD Million)
Table 21 Canada Contact Lenses Market, by Application, 2021 – 2033 (USD Million)
Table 22 Canada Contact Lenses Market, by Replacement Schedule, 2021 – 2033 (USD Million)
Table 23 Canada Contact Lenses Market, by Distribution Channel, 2021 – 2033 (USD Million)
Table 24 Mexico Contact Lenses Market, by Product, 2021 – 2033 (USD Million)
Table 25 Mexico Contact Lenses Market, by Modality, 2021 – 2033 (USD Million)
Table 26 Mexico Contact Lenses Market, by Application, 2021 – 2033 (USD Million)
Table 27 Mexico Contact Lenses Market, by Replacement Schedule, 2021 – 2033 (USD Million)
Table 28 Mexico Contact Lenses Market, by Distribution Channel, 2021 – 2033 (USD Million)
Table 29 Europe Contact Lenses Market, by Country, 2021 – 2033 (USD Million)
Table 30 Europe Contact Lenses Market, by Product, 2021 – 2033 (USD Million)
Table 31 Europe Contact Lenses Market, by Modality, 2021 – 2033 (USD Million)
Table 32 Europe Contact Lenses Market, by Application, 2021 – 2033 (USD Million)
Table 33 Europe Contact Lenses Market, by Replacement Schedule, 2021 – 2033 (USD Million)
Table 34 Europe Contact Lenses Market, by Distribution Channel, 2021 – 2033 (USD Million)
Table 35 UK Contact Lenses Market, by Product, 2021 – 2033 (USD Million)
Table 36 UK Contact Lenses Market, by Modality, 2021 – 2033 (USD Million)
Table 37 UK Contact Lenses Market, by Application, 2021 – 2033 (USD Million)
Table 38 UK Contact Lenses Market, by Replacement Schedule, 2021 – 2033 (USD Million)
Table 39 UK Contact Lenses Market, by Distribution Channel, 2021 – 2033 (USD Million)
Table 40 Germany Contact Lenses Market, by Product, 2021 – 2033 (USD Million)
Table 41 Germany Contact Lenses Market, by Modality, 2021 – 2033 (USD Million)
Table 42 Germany Contact Lenses Market, by Application, 2021 – 2033 (USD Million)
Table 43 Germany Contact Lenses Market, by Replacement Schedule, 2021 – 2033 (USD Million)
Table 44 Germany Contact Lenses Market, by Distribution Channel, 2021 – 2033 (USD Million)
Table 45 France Contact Lenses Market, by Product, 2021 – 2033 (USD Million)
Table 46 France Contact Lenses Market, by Modality, 2021 – 2033 (USD Million)
Table 47 France Contact Lenses Market, by Application, 2021 – 2033 (USD Million)
Table 48 France Contact Lenses Market, by Replacement Schedule, 2021 – 2033 (USD Million)
Table 49 France Contact Lenses Market, by Distribution Channel, 2021 – 2033 (USD Million)
Table 50 Italy Contact Lenses Market, by Product, 2021 – 2033 (USD Million)
Table 51 Italy Contact Lenses Market, by Modality, 2021 – 2033 (USD Million)
Table 52 Italy Contact Lenses Market, by Application, 2021 – 2033 (USD Million)
Table 53 Italy Contact Lenses Market, by Replacement Schedule, 2021 – 2033 (USD Million)
Table 54 Italy Contact Lenses Market, by Distribution Channel, 2021 – 2033 (USD Million)
Table 55 Spain Contact Lenses Market, by Product, 2021 – 2033 (USD Million)
Table 56 Spain Contact Lenses Market, by Modality, 2021 – 2033 (USD Million)
Table 57 Spain Contact Lenses Market, by Application, 2021 – 2033 (USD Million)
Table 58 Spain Contact Lenses Market, by Replacement Schedule, 2021 – 2033 (USD Million)
Table 59 Spain Contact Lenses Market, by Distribution Channel, 2021 – 2033 (USD Million)
Table 60 Norway Contact Lenses Market, by Product, 2021 – 2033 (USD Million)
Table 61 Norway Contact Lenses Market, by Modality, 2021 – 2033 (USD Million)
Table 62 Norway Contact Lenses Market, by Application, 2021 – 2033 (USD Million)
Table 63 Norway Contact Lenses Market, by Replacement Schedule, 2021 – 2033 (USD Million)
Table 64 Norway Contact Lenses Market, by Distribution Channel, 2021 – 2033 (USD Million)
Table 65 Sweden Contact Lenses Market, by Product, 2021 – 2033 (USD Million)
Table 66 Sweden Contact Lenses Market, by Modality, 2021 – 2033 (USD Million)
Table 67 Sweden Contact Lenses Market, by Application, 2021 – 2033 (USD Million)
Table 68 Sweden Contact Lenses Market, by Replacement Schedule, 2021 – 2033 (USD Million)
Table 69 Sweden Contact Lenses Market, by Distribution Channel, 2021 – 2033 (USD Million)
Table 70 Denmark Contact Lenses Market, by Product, 2021 – 2033 (USD Million)
Table 71 Denmark Contact Lenses Market, by Modality, 2021 – 2033 (USD Million)
Table 72 Denmark Contact Lenses Market, by Application, 2021 – 2033 (USD Million)
Table 73 Denmark Contact Lenses Market, by Replacement Schedule, 2021 – 2033 (USD Million)
Table 74 Denmark Contact Lenses Market, by Distribution Channel, 2021 – 2033 (USD Million)
Table 75 Asia Pacific Contact Lenses Market, by Country, 2021 – 2033 (USD Million)
Table 76 Asia Pacific Contact Lenses Market, by Product, 2021 – 2033 (USD Million)
Table 77 Asia Pacific Contact Lenses Market, by Modality, 2021 – 2033 (USD Million)
Table 78 Asia Pacific Contact Lenses Market, by Application, 2021 – 2033 (USD Million)
Table 79 Asia Pacific Contact Lenses Market, by Replacement Schedule, 2021 – 2033 (USD Million)
Table 80 Asia Pacific Contact Lenses Market, by Distribution Channel, 2021 – 2033 (USD Million)
Table 81 China Contact Lenses Market, by Product, 2021 – 2033 (USD Million)
Table 82 China Contact Lenses Market, by Modality, 2021 – 2033 (USD Million)
Table 83 China Contact Lenses Market, by Application, 2021 – 2033 (USD Million)
Table 84 China Contact Lenses Market, by Replacement Schedule, 2021 – 2033 (USD Million)
Table 85 China Contact Lenses Market, by Distribution Channel, 2021 – 2033 (USD Million)
Table 86 Japan Contact Lenses Market, by Product, 2021 – 2033 (USD Million)
Table 87 Japan Contact Lenses Market, by Modality, 2021 – 2033 (USD Million)
Table 88 Japan Contact Lenses Market, by Application, 2021 – 2033 (USD Million)
Table 89 Japan Contact Lenses Market, by Replacement Schedule, 2021 – 2033 (USD Million)
Table 90 Japan Contact Lenses Market, by Distribution Channel, 2021 – 2033 (USD Million)
Table 91 India Contact Lenses Market, by Product, 2021 – 2033 (USD Million)
Table 92 India Contact Lenses Market, by Modality, 2021 – 2033 (USD Million)
Table 93 India Contact Lenses Market, by Application, 2021 – 2033 (USD Million)
Table 94 India Contact Lenses Market, by Replacement Schedule, 2021 – 2033 (USD Million)
Table 95 India Contact Lenses Market, by Distribution Channel, 2021 – 2033 (USD Million)
Table 96 Australia Contact Lenses Market, by Product, 2021 – 2033 (USD Million)
Table 97 Australia Contact Lenses Market, by Modality, 2021 – 2033 (USD Million)
Table 98 Australia Contact Lenses Market, by Application, 2021 – 2033 (USD Million)
Table 99 Australia Contact Lenses Market, by Replacement Schedule, 2021 – 2033 (USD Million)
Table 100 Australia Contact Lenses Market, by Distribution Channel, 2021 – 2033 (USD Million)
Table 101 South Korea Contact Lenses Market, by Product, 2021 – 2033 (USD Million)
Table 102 South Korea Contact Lenses Market, by Modality, 2021 – 2033 (USD Million)
Table 103 South Korea Contact Lenses Market, by Application, 2021 – 2033 (USD Million)
Table 104 South Korea Contact Lenses Market, by Replacement Schedule, 2021 – 2033 (USD Million)
Table 105 South Korea Contact Lenses Market, by Distribution Channel, 2021 – 2033 (USD Million)
Table 106 Thailand Contact Lenses Market, by Product, 2021 – 2033 (USD Million)
Table 107 Thailand Contact Lenses Market, by Modality, 2021 – 2033 (USD Million)
Table 108 Thailand Contact Lenses Market, by Application, 2021 – 2033 (USD Million)
Table 109 Thailand Contact Lenses Market, by Replacement Schedule, 2021 – 2033 (USD Million)
Table 110 Thailand Contact Lenses Market, by Distribution Channel, 2021 – 2033 (USD Million)
Table 111 Latin America Contact Lenses Market, by Country, 2021 – 2033 (USD Million)
Table 112 Latin America Contact Lenses Market, by Product, 2021 – 2033 (USD Million)
Table 113 Latin America Contact Lenses Market, by Modality, 2021 – 2033 (USD Million)
Table 114 Latin America Contact Lenses Market, by Application, 2021 – 2033 (USD Million)
Table 115 Latin America Contact Lenses Market, by Replacement Schedule, 2021 – 2033 (USD Million)
Table 116 Latin America Contact Lenses Market, by Distribution Channel, 2021 – 2033 (USD Million)
Table 117 Brazil Contact Lenses Market, by Product, 2021 – 2033 (USD Million)
Table 118 Brazil Contact Lenses Market, by Modality, 2021 – 2033 (USD Million)
Table 119 Brazil Contact Lenses Market, by Application, 2021 – 2033 (USD Million)
Table 120 Brazil Contact Lenses Market, by Replacement Schedule, 2021 – 2033 (USD Million)
Table 121 Brazil Contact Lenses Market, by Distribution Channel, 2021 – 2033 (USD Million)
Table 122 Argentina Contact Lenses Market, by Product, 2021 – 2033 (USD Million)
Table 123 Argentina Contact Lenses Market, by Modality, 2021 – 2033 (USD Million)
Table 124 Argentina Contact Lenses Market, by Application, 2021 – 2033 (USD Million)
Table 125 Argentina Contact Lenses Market, by Replacement Schedule, 2021 – 2033 (USD Million)
Table 126 Argentina Contact Lenses Market, by Distribution Channel, 2021 – 2033 (USD Million)
Table 127 Middle East & Africa Contact Lenses Market, by Country, 2021 – 2033 (USD Million)
Table 128 Middle East & Africa Contact Lenses Market, by Product, 2021 – 2033 (USD Million)
Table 129 Middle East & Africa Contact Lenses Market, by Modality, 2021 – 2033 (USD Million)
Table 130 Middle East & Africa Contact Lenses Market, by Application, 2021 – 2033 (USD Million)
Table 131 Middle East & Africa Contact Lenses Market, by Replacement Schedule, 2021 – 2033 (USD Million)
Table 132 Middle East & Africa Contact Lenses Market, by Distribution Channel, 2021 – 2033 (USD Million)
Table 133 Saudi Arabia Contact Lenses Market, by Product, 2021 – 2033 (USD Million)
Table 134 Saudi Arabia Contact Lenses Market, by Modality, 2021 – 2033 (USD Million)
Table 135 Saudi Arabia Contact Lenses Market, by Application, 2021 – 2033 (USD Million)
Table 136 Saudi Arabia Contact Lenses Market, by Replacement Schedule, 2021 – 2033 (USD Million)
Table 137 Saudi Arabia Contact Lenses Market, by Distribution Channel, 2021 – 2033 (USD Million)
Table 138 South Africa Contact Lenses Market, by Product, 2021 – 2033 (USD Million)
Table 139 South Africa Contact Lenses Market, by Modality, 2021 – 2033 (USD Million)
Table 140 South Africa Contact Lenses Market, by Application, 2021 – 2033 (USD Million)
Table 141 South Africa Contact Lenses Market, by Replacement Schedule, 2021 – 2033 (USD Million)
Table 142 South Africa Contact Lenses Market, by Distribution Channel, 2021 – 2033 (USD Million)
Table 143 UAE Contact Lenses Market, by Product, 2021 – 2033 (USD Million)
Table 144 UAE Contact Lenses Market, by Modality, 2021 – 2033 (USD Million)
Table 145 UAE Contact Lenses Market, by Application, 2021 – 2033 (USD Million)
Table 146 UAE Contact Lenses Market, by Replacement Schedule, 2021 – 2033 (USD Million)
Table 147 UAE Contact Lenses Market, by Distribution Channel, 2021 – 2033 (USD Million)
Table 148 Kuwait Contact Lenses Market, by Product, 2021 – 2033 (USD Million)
Table 149 Kuwait Contact Lenses Market, by Modality, 2021 – 2033 (USD Million)
Table 150 Kuwait Contact Lenses Market, by Application, 2021 – 2033 (USD Million)
Table 151 Kuwait Contact Lenses Market, by Replacement Schedule, 2021 – 2033 (USD Million)
Table 152 Kuwait Contact Lenses Market, by Distribution Channel, 2021 – 2033 (USD Million)
List of Figures
Fig. 1 Information procurement
Fig. 2 Primary research pattern
Fig. 3 Market research approaches
Fig. 4 Value chain-based sizing & forecasting
Fig. 5 Market formulation & validation
Fig. 6 Contact lenses market segmentation
Fig. 7 Market driver analysis (Current & future impact)
Fig. 8 Market restraint analysis (Current & future impact)
Fig. 9 SWOT Analysis, By Factor (Political & Legal, Economic and Technological)
Fig. 10 Porter’s Five Forces Analysis
Fig. 11 Contact lenses market, product outlook key takeaways (USD Million)
Fig. 12 Contact lenses market: product movement analysis, 2025 & 2033 (USD Million)
Fig. 13 Soft contact lenses market revenue estimates and forecasts, 2021 – 2033 (USD Million)
Fig. 14 Hydrogel contact lenses market revenue estimates and forecasts, 2021 – 2033 (USD Million)
Fig. 15 Silicone hydrogel contact lenses market revenue estimates and forecasts, 2021 – 2033 (USD Million)
Fig. 16 Rigid gas permeable contact lenses market revenue estimates and forecasts, 2021 – 2033 (USD Million)
Fig. 17 Specialty contact lens market revenue estimates and forecasts, 2021 – 2033 (USD Million)
Fig. 18 Contact lenses market, modality outlook key takeaways (USD Million)
Fig. 19 Contact lenses market: modality movement analysis, 2025 & 2033 (USD Million)
Fig. 20 Sphere contact lenses market revenue estimates and forecasts, 2021 – 2033 (USD Million)
Fig. 21 Toric contact lenses market revenue estimates and forecasts, 2021 – 2033 (USD Million)
Fig. 22 Multifocal contact lenses market revenue estimates and forecasts, 2021 – 2033 (USD Million)
Fig. 23 Contact lenses market, application outlook key takeaways (USD Million)
Fig. 24 Contact lenses market: application movement analysis, 2025 & 2033 (USD Million)
Fig. 25 Corrective contact lenses market revenue estimates and forecasts, 2021 – 2033 (USD Million)
Fig. 26 Non-corrective contact lenses market revenue estimates and forecasts, 2021 – 2033 (USD Million)
Fig. 27 Contact lenses market, replacement schedule outlook key takeaways (USD Million)
Fig. 28 Contact lenses market: replacement schedule movement analysis, 2025 & 2033 (USD Million)
Fig. 29 Reusable contact lenses market revenue estimates and forecasts, 2021 – 2033 (USD Million)
Fig. 30 Disposable contact lenses market revenue estimates and forecasts, 2021 – 2033 (USD Million)
Fig. 31 Contact lenses market, distribution channel outlook key takeaways (USD Million)
Fig. 32 Contact lenses market: distribution channel movement analysis, 2025 & 2033 (USD Million)
Fig. 33 Institutional providers (Hospitals & Clinics) market revenue estimates and forecasts, 2021 – 2033 (USD Million)
Fig. 34 E-Commerce & D2C market revenue estimates and forecasts, 2021 – 2033 (USD Million)
Fig. 35 Ophthalmology clinics market revenue estimates and forecasts, 2021 – 2033 (USD Million)
Fig. 36 Retail channels market revenue estimates and forecasts, 2021 – 2033 (USD Million)
Fig. 37 Contact lenses market, regional key takeaways (USD Million)
Fig. 38 Contact lenses market regional outlook, 2025 & 2033 (USD Million)
Fig. 39 North America contact lenses market estimates and forecasts, 2021 – 2033 (USD Million)
Fig. 40 US contact lenses market estimates and forecasts, 2021 – 2033 (USD Million)
Fig. 41 Canada contact lenses market estimates and forecasts, 2021 – 2033 (USD Million)
Fig. 42 Mexico contact lenses market estimates and forecasts, 2021 – 2033 (USD Million)
Fig. 43 Europe contact lenses market estimates and forecasts, 2021 – 2033 (USD Million)
Fig. 44 Germany contact lenses market estimates and forecasts, 2021 – 2033 (USD Million)
Fig. 45 UK contact lenses market estimates and forecasts, 2021 – 2033 (USD Million)
Fig. 46 France contact lenses market estimates and forecasts, 2021 – 2033 (USD Million)
Fig. 47 Italy contact lenses market estimates and forecasts, 2021 – 2033 (USD Million)
Fig. 48 Spain contact lenses market estimates and forecasts, 2021 – 2033 (USD Million)
Fig. 49 Sweden contact lenses market estimates and forecasts, 2021 – 2033 (USD Million)
Fig. 50 Denmark contact lenses market estimates and forecasts, 2021 – 2033 (USD Million)
Fig. 51 Norway contact lenses market estimates and forecasts, 2021 – 2033 (USD Million)
Fig. 52 Asia Pacific contact lenses market estimates and forecasts, 2021 – 2033 (USD Million)
Fig. 53 Japan contact lenses market estimates and forecasts, 2021 – 2033 (USD Million)
Fig. 54 China contact lenses market estimates and forecasts, 2021 – 2033 (USD Million)
Fig. 55 India contact lenses market estimates and forecasts, 2021 – 2033 (USD Million)
Fig. 56 Australia contact lenses market estimates and forecasts, 2021 – 2033 (USD Million)
Fig. 57 South Korea contact lenses market estimates and forecasts, 2021 – 2033 (USD Million)
Fig. 58 Thailand contact lenses market estimates and forecasts, 2021 – 2033 (USD Million)
Fig. 59 Latin America contact lenses market estimates and forecasts, 2021 – 2033 (USD Million)
Fig. 60 Brazil contact lenses market estimates and forecasts, 2021 – 2033 (USD Million)
Fig. 61 Argentina contact lenses market estimates and forecasts, 2021 – 2033 (USD Million)
Fig. 62 Middle East & Africa contact lenses market estimates and forecasts, 2021 – 2033 (USD Million)
Fig. 63 South Africa contact lenses market estimates and forecasts, 2021 – 2033 (USD Million)
Fig. 64 Saudi Arabia contact lenses market estimates and forecasts, 2021 – 2033 (USD Million)
Fig. 65 UAE contact lenses market estimates and forecasts, 2021 – 2033 (USD Million)
Fig. 66 Kuwait contact lenses market estimates and forecasts, 2021 – 2033 (USD Million)
Fig. 67 List of key emerging company’s/indication disruptors/innovators