Coated Glass Market Size, Share & Trend Analysis Report By Coating (Hard, Soft), By Application (Architecture, Automotive, Optical), By Region (North America, Europe, Asia Pacific, Latin America, Middle East & Africa), And Segment Forecasts, 2026 - 2033
コーティングガラス市場 - コーティング(硬質、軟質)、用途別(建築、自動車、光学)、地域別(北米、欧州、アジア太平洋、ラテンアメリカ、中東・アフリカ)、およびセグメント別予測による市場規模、成長と動向分析レポート 2026-2033年
| 出版 | Grand View Research |
| 出版年月 | 2026年02月 |
| ページ数 | 110 |
| 価格 | 記載以外のライセンスについてはお問合せください |
| シングルユーザ | USD 5,950 |
| 種別 | 英文調査報告書 |
| 商品番号 | SMR-16576 |

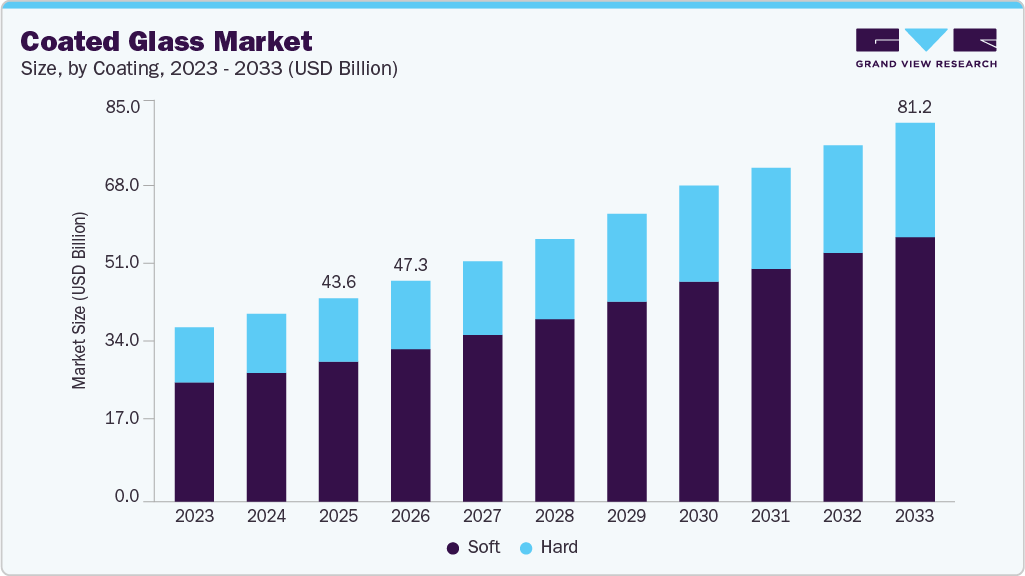
世界のコーティングガラス市場規模は、2025年には436億1000万米ドルと評価され、2026年から2033年までの年平均成長率(CAGR)8.0%で、2033年には812億5000万米ドルに達するとGrand View Researchでは予測しています。コーティングガラス市場は、エネルギー効率の高い建物やグリーン建築基準への注目の高まりを主な要因として、力強い成長を遂げています。
主要市場動向と洞察
- 欧州はコーティングガラス市場を牽引し、2025年には市場収益の38%以上を占める最大の市場シェアを獲得しました。
- コーティングの種類別に見ると、ソフトコーティングガラスが2025年に市場収益の68.0%以上を占める最大の市場シェアを占めました。
- 用途別に見ると、光学分野が予測期間において最も高い年平均成長率(CAGR)で成長すると予測されています。
主要経済国政府は、エネルギー消費削減のため、より厳格な建築基準を施行しており、低放射率・遮熱コーティングガラスの採用を促進しています。これらのコーティングは熱伝達を最小限に抑え、空調コストを削減するため、現代の住宅および商業インフラプロジェクトにおいて非常に好まれています。特に新興国における急速な都市化と大規模インフラ開発も、需要を押し上げる重要な要因となっています。高層ビル、空港、ショッピングモール、オフィスビルなどの建設増加に伴い、ファサードやカーテンウォールにおけるコーティングガラスの使用が大幅に拡大しています。建築トレンドが高級ガラス外装へと移行し続ける中、美観と機能性を兼ね備えたコーティングガラス製品への需要は着実に増加しています。
自動車業界も市場拡大を牽引する重要な役割を担っています。自動車メーカーは、断熱性の向上、眩しさの軽減、乗員の快適性向上を目的として、コーティングガラスの使用をますます増やしています。電気自動車の普及に伴い、バッテリー性能の向上と車内空調負荷の低減に熱管理が不可欠となるため、コーティングガラスの需要はさらに増加しています。
コーティングプロセスの技術革新も、市場の成長をさらに後押ししています。スパッタリングおよび成膜技術の進歩により、メーカーは耐久性、透明度、日射制御特性に優れた高性能コーティングを製造できるようになりました。これらの技術革新により、コーティングガラスの用途は、防音ガラス、反射防止ガラス、高級商業ビル向けのスマートガラスソリューションといった専門分野へと拡大しています。
快適性、省エネルギー、そして現代的な美観に対する消費者の嗜好の高まりも、コーティングガラスの普及をさらに後押ししています。住宅所有者や企業は、室内温度調節の改善と電気料金の削減を目的として、断熱・コーティングガラス窓への投資を増やしています。さらに、持続可能な建築手法と長期的なコスト削減に対する意識の高まりも需要見通しを強化し、世界のコーティングガラス市場の着実な成長を支えています。
Coated Glass Market Summary
The global coated glass market size was valued at USD 43.61 billion in 2025 and is projected to reach USD 81.25 billion by 2033, at a CAGR of 8.0% from 2026 to 2033. The coated glass market is witnessing strong growth primarily due to the rising focus on energy-efficient buildings and green construction standards.
Key Market Trends & Insights
- Europe dominated the coated glass market with the largest market revenue share of over 38% in 2025.
- By coating, soft coated glass accounted for the largest market revenue share of over 68.0% in 2025.
- By application, optical is anticipated to grow at the fastest CAGR over the forecast period.
Market Size & Forecast
- 2025 Market Size: USD 43.61 Billion
- 2033 Projected Market Size: USD 81.25 Billion
- CAGR (2026-2033): 8.0%
- Europe: Largest market in 2025
Governments across major economies are enforcing stricter building codes to reduce energy consumption, encouraging the adoption of low-emissivity and solar-control coated glass. These coatings help minimize heat transfer and lower HVAC costs, making them highly preferred for modern residential and commercial infrastructure projects. Rapid urbanization and large-scale infrastructure development, particularly in emerging economies, are another key driver boosting demand. The increasing construction of high-rise buildings, airports, shopping malls, and office complexes is significantly expanding the use of coated glass in façades and curtain wall applications. As architectural trends continue to shift toward premium glass exteriors, demand for aesthetically appealing, functional coated glass products is growing steadily.
The automotive sector is also playing an important role in driving market expansion. Vehicle manufacturers are increasingly using coated glass to enhance thermal insulation, reduce glare, and improve passenger comfort. With the growth of electric vehicles, demand for coated glass is increasing further, as thermal management has become critical for improving battery performance and reducing air conditioning loads inside vehicles.
Technological advancements in coating processes are further supporting market growth. Improved sputtering and deposition techniques have enabled manufacturers to produce high-performance coatings with better durability, clarity, and solar control properties. These innovations are expanding coated glass applications into specialized segments such as soundproof glazing, anti-reflective glass, and smart glass solutions for high-end commercial buildings.
Rising consumer preference for comfort, energy savings, and modern aesthetics is further fueling coated glass adoption. Homeowners and businesses are increasingly investing in insulated and coated glass windows to improve indoor temperature control and reduce electricity bills. Additionally, increasing awareness of sustainable construction practices and long-term cost savings is strengthening the demand outlook, supporting consistent growth for the coated glass market globally.
Coating Insights
Soft coated glass held the largest revenue share of over 68% in 2025. The soft coating segment in the coated glass market is gaining strong traction due to its superior thermal insulation and solar control performance compared to hard coatings. Soft-coated glass, typically produced using magnetron sputtering vacuum deposition technology, offers enhanced low-emissivity properties, enabling a significant reduction in heat loss during winter and limiting heat gain during summer.
Hard coated glass is expected to grow at a CAGR of 7.7% over the forecast period, driven by its high durability, scratch resistance, and ability to withstand harsh environmental conditions. Hard-coated glass is typically manufactured using pyrolytic coating technology, where the coating is applied directly during the float glass production process, resulting in a strong bond with the glass surface. This makes it suitable for applications requiring long service life and mechanical strength, such as exterior glazing, windows, and commercial building installations exposed to extreme temperatures and weather conditions.
Application Insights
Architecture segment held the largest revenue share of over 88% in 2025. Coated glass is widely adopted in architectural applications such as façades, curtain walls, skylights, and windows as it helps control solar heat gain, improves insulation, and reduces overall energy consumption. With increasing emphasis on sustainable construction and compliance with green building standards, demand for low-emissivity and solar control coated glass is expanding rapidly across developed and emerging economies.
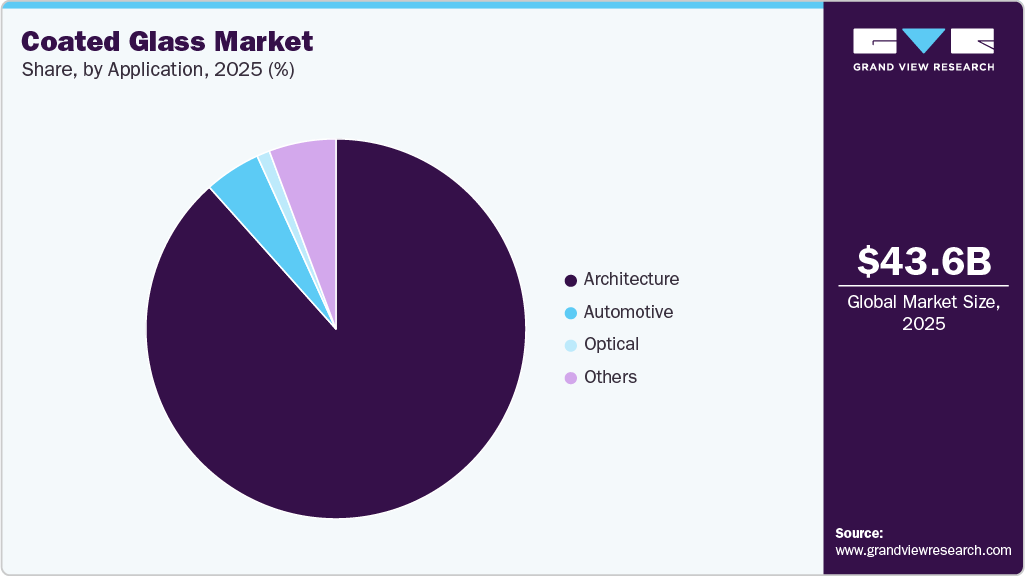
coated-glass-market-share
The optical segment in the market is gaining momentum due to the rising demand for high-precision glass used in advanced electronics, display panels, and optical instruments. Coated glass is widely used in applications such as camera lenses, microscopes, telescopes, and laser systems, as coatings help enhance light transmission, minimize reflection, and improve image clarity. The growing production of consumer electronics, including smartphones, tablets, and high-resolution display devices, is significantly supporting demand for anti-reflective and protective-coated optical glass.
Key Coated Glass Company Insights
Some of the key players operating in the market include Central Glass Co. Ltd., AGC Inc., and others.
- AGC Inc. is a glass manufacturer headquartered in Japan, with a strong global footprint across architectural, automotive, and specialty glass segments. The company has a well-established presence in the coated glass market through its advanced architectural glazing solutions designed for energy efficiency, thermal insulation, and solar control applications.
- Central Glass Co. Ltd. is a chemical and glass manufacturer known for its diversified operations in glass products, electronic materials, and fine chemicals. In the coated glass segment, the company focuses on providing high-quality coated and functional glass solutions catering to industrial and architectural applications. Central Glass offers coated glass products that support enhanced optical performance, durability, and heat control, making them suitable for modern building envelopes and specialized glazing needs.
Key Coated Glass Companies:
The following key companies have been profiled for this study on the coated glass market.
- AGC Inc.
- Central Glass Co. Ltd.
- CEVITAL GROUP
- China Glass Holding, Ltd.
- Euroglas
- Fuyao Glass Industry Group Co., Ltd.
- Guardian Industries
- Nippon Sheet Glass Co., Ltd.
- Saint-Gobain
- SCHOTT AG
Recent Developments
- In September 2025, Guardian Glass launched its new triple silver low-E coated glass, SunGuard SNX 60+, in North America, featuring advanced coating technology that delivers a consistently neutral reflected color from any viewing angle and a Light to Solar Gain (LSG) ratio of 2.41. This product offers 60% visible light transmission with low external (14%) and internal (15%) light reflection, a Solar Heat Gain Coefficient (SHGC) of 0.25, and a U-value of 0.29, helping reduce cooling loads and meet energy codes while maintaining neutral transmitted colors for true interior views.
Coated Glass Market Report Scope
| Report Attribute | Details |
| Market definition | The market size represent annual sales value of coated glass used in different applications. |
| Market size value in 2026 | USD 47.33 billion |
| Revenue forecast in 2033 | USD 81.25 billion |
| Growth rate | CAGR of 8.0% from 2026 to 2033 |
| Base year for estimation | 2025 |
| Historical data | 2021 – 2024 |
| Forecast period | 2026 – 2033 |
| Quantitative Units | Volume in Kilotons, Revenue in USD million, and CAGR from 2026 to 2033 |
| Report coverage | Volume forecast, revenue forecast, competitive landscape, growth factors, and trends |
| Segments covered | Coating, Application, and Region |
| Regional scope | North America; Europe; Asia Pacific; Latin America; Middle East & Africa |
| Country scope | U.S.; Canada; Mexico; Germany; France; Italy; Russia; China; Japan; India; Brazil; Saudi Arabia; UAE |
| Key companies profiled | AGC Inc.; Central Glass Co. Ltd.; CEVITAL GROUP; China Glass Holding, Ltd.; Euroglas; Fuyao Glass Industry Group Co., Ltd.; Guardian Industries; Nippon Sheet Glass Co., Ltd.; Saint-Gobain; SCHOTT AG |
| Customization scope | Free report customization (equivalent up to 8 analysts working days) with purchase. Addition or alteration to country, regional & segment scope. |
Global Coated Glass Market Report Segmentation
This report forecasts revenue and volume growth at global, regional, and country levels and provides an analysis of the latest industry trends in each of the sub-segments from 2021 to 2033. For the purpose of this study, Grand View Research has segmented the global coated glass market report on the basis of coating, application, and region.
- Coating Outlook (Volume, Kil0tons; Revenue, USD Million; 2021 – 2033)
- Hard
- Soft
- Application Outlook (Volume, Kil0tons; Revenue, USD Million; 2021 – 2033)
- Architecture
- Automotive
- Optical
- Others
- Regional Outlook (Volume, Kil0tons; Revenue, USD Million; 2021 – 2033)
- North America
- U.S.
- Canada
- Mexico
- Europe
- Germany
- France
- Italy
- Russia
- Asia Pacific
- China
- Japan
- India
- Latin America
- Brazil
- Middle East & Africa
- Saudi Arabia
- UAE
- North America
Table of Contents
Chapter 1. Methodology and Scope
1.1. Market Segmentation & Scope
1.2. Market Definition
1.3. Information Procurement
1.3.1. Information Analysis
1.3.2. Market Formulation & Data Visualization
1.3.3. Data Validation & Publishing
1.4. Research Scope and Assumptions
1.4.1. List of Data Sources
Chapter 2. Executive Summary
2.1. Market Snapshot
2.2. Segmental Outlook
2.3. Competitive Outlook
Chapter 3. Market Variables, Trends, and Scope
3.1. Market Lineage Outlook
3.1.1. Global Glass Market
3.2. Value Chain Analysis
3.2.1. Raw Material Trends
3.2.2. Sales Channel Analysis
3.3. Manufacturing & Technology Overview
3.4. Regulatory Framework
3.5. Price Trend Analysis
3.6. Market Dynamics
3.6.1. Market Driver Analysis
3.6.2. Market Restraint Analysis
3.7. Industry Trends
3.7.1. ESG Trends
3.7.2. Trade Outlook
3.8. Porter’s Five Forces Analysis
3.8.1. Bargaining Power of Suppliers
3.8.2. Bargaining Power of Buyers
3.8.3. Threat of Substitution
3.8.4. Threat of New Entrants
3.8.5. Competitive Rivalry
3.9. PESTLE Analysis
3.9.1. Political
3.9.2. Economic
3.9.3. Social Landscape
3.9.4. Technology
3.9.5. Environmental
3.9.6. Legal
Chapter 4. Coated Glass Market: Coating Estimates & Trend Analysis
4.1. Coated Glass Market: Coating Movement Analysis, 2025 & 2033
4.2. Hard
4.2.1. Market estimates and forecasts, 2021 – 2033 (Kilotons) (USD Million)
4.3. Soft
4.3.1. Market estimates and forecasts, 2021 – 2033 (Kilotons) (USD Million)
Chapter 5. Coated Glass Market: Application Estimates & Trend Analysis
5.1. Coated Glass Market: Application Movement Analysis, 2025 & 2033
5.2. Architecture
5.2.1. Market estimates and forecasts, 2021 – 2033 (Kilotons) (USD Million)
5.3. Automotive
5.3.1. Market estimates and forecasts, 2021 – 2033 (Kilotons) (USD Million)
5.4. Optical
5.4.1. Market estimates and forecasts, 2021 – 2033 (Kilotons) (USD Million)
5.5. Others
5.5.1. Market estimates and forecasts, 2021 – 2033 (Kilotons) (USD Million)
Chapter 6. Coated Glass Market: Regional Estimates & Trend Analysis
6.1. Regional Analysis, 2025 & 2033
6.2. North America
6.2.1. Market estimates and forecasts, 2021 – 2033 (Kilotons) (USD Million)
6.2.2. Market estimates and forecasts, by coating, 2021 – 2033 (Kilotons) (USD Million)
6.2.3. Market estimates and forecasts, by application, 2021 – 2033 (Kilotons) (USD Million)
6.2.4. U.S.
6.2.4.1. Market estimates and forecasts, 2021 – 2033 (Kilotons) (USD Million)
6.2.4.2. Market estimates and forecasts, by coating, 2021 – 2033 (Kilotons) (USD Million)
6.2.4.3. Market estimates and forecasts, by application, 2021 – 2033 (Kilotons) (USD Million)
6.2.5. Canada
6.2.5.1. Market estimates and forecasts, 2021 – 2033 (Kilotons) (USD Million)
6.2.5.2. Market estimates and forecasts, by coating, 2021 – 2033 (Kilotons) (USD Million)
6.2.5.3. Market estimates and forecasts, by application, 2021 – 2033 (Kilotons) (USD Million)
6.2.6. Mexico
6.2.6.1. Market estimates and forecasts, 2021 – 2033 (Kilotons) (USD Million)
6.2.6.2. Market estimates and forecasts, by coating, 2021 – 2033 (Kilotons) (USD Million)
6.2.6.3. Market estimates and forecasts, by application, 2021 – 2033 (Kilotons) (USD Million)
6.3. Europe
6.3.1. Market estimates and forecasts, 2021 – 2033 (Kilotons) (USD Million)
6.3.2. Market estimates and forecasts, by coating, 2021 – 2033 (Kilotons) (USD Million)
6.3.3. Market estimates and forecasts, by application, 2021 – 2033 (Kilotons) (USD Million)
6.3.4. Germany
6.3.4.1. Market estimates and forecasts, 2021 – 2033 (Kilotons) (USD Million)
6.3.4.2. Market estimates and forecasts, by coating, 2021 – 2033 (Kilotons) (USD Million)
6.3.4.3. Market estimates and forecasts, by application, 2021 – 2033 (Kilotons) (USD Million)
6.3.5. France
6.3.5.1. Market estimates and forecasts, 2021 – 2033 (Kilotons) (USD Million)
6.3.5.2. Market estimates and forecasts, by coating, 2021 – 2033 (Kilotons) (USD Million)
6.3.5.3. Market estimates and forecasts, by application, 2021 – 2033 (Kilotons) (USD Million)
6.3.6. Italy
6.3.6.1. Market estimates and forecasts, 2021 – 2033 (Kilotons) (USD Million)
6.3.6.2. Market estimates and forecasts, by coating, 2021 – 2033 (Kilotons) (USD Million)
6.3.6.3. Market estimates and forecasts, by application, 2021 – 2033 (Kilotons) (USD Million)
6.3.7. Russia
6.3.7.1. Market estimates and forecasts, 2021 – 2033 (Kilotons) (USD Million)
6.3.7.2. Market estimates and forecasts, by coating, 2021 – 2033 (Kilotons) (USD Million)
6.3.7.3. Market estimates and forecasts, by application, 2021 – 2033 (Kilotons) (USD Million)
6.4. Asia Pacific
6.4.1. Market estimates and forecasts, 2021 – 2033 (Kilotons) (USD Million)
6.4.2. Market estimates and forecasts, by coating, 2021 – 2033 (Kilotons) (USD Million)
6.4.3. Market estimates and forecasts, by application, 2021 – 2033 (Kilotons) (USD Million)
6.4.4. China
6.4.4.1. Market estimates and forecasts, 2021 – 2033 (Kilotons) (USD Million)
6.4.4.2. Market estimates and forecasts, by coating, 2021 – 2033 (Kilotons) (USD Million)
6.4.4.3. Market estimates and forecasts, by application, 2021 – 2033 (Kilotons) (USD Million)
6.4.5. Japan
6.4.5.1. Market estimates and forecasts, 2021 – 2033 (Kilotons) (USD Million)
6.4.5.2. Market estimates and forecasts, by coating, 2021 – 2033 (Kilotons) (USD Million)
6.4.5.3. Market estimates and forecasts, by application, 2021 – 2033 (Kilotons) (USD Million)
6.4.6. India
6.4.6.1. Market estimates and forecasts, 2021 – 2033 (Kilotons) (USD Million)
6.4.6.2. Market estimates and forecasts, by coating, 2021 – 2033 (Kilotons) (USD Million)
6.4.6.3. Market estimates and forecasts, by application, 2021 – 2033 (Kilotons) (USD Million)
6.5. Latin America
6.5.1. Market estimates and forecasts, 2021 – 2033 (Kilotons) (USD Million)
6.5.2. Market estimates and forecasts, by coating, 2021 – 2033 (Kilotons) (USD Million)
6.5.3. Market estimates and forecasts, by application, 2021 – 2033 (Kilotons) (USD Million)
6.5.4. Brazil
6.5.4.1. Market estimates and forecasts, 2021 – 2033 (Kilotons) (USD Million)
6.5.4.2. Market estimates and forecasts, by coating, 2021 – 2033 (Kilotons) (USD Million)
6.5.4.3. Market estimates and forecasts, by application, 2021 – 2033 (Kilotons) (USD Million)
6.6. Middle East & Africa
6.6.1. Market estimates and forecasts, 2021 – 2033 (Kilotons) (USD Million)
6.6.2. Market estimates and forecasts, by coating, 2021 – 2033 (Kilotons) (USD Million)
6.6.3. Market estimates and forecasts, by application, 2021 – 2033 (Kilotons) (USD Million)
6.6.4. Saudi Arabia
6.6.4.1. Market estimates and forecasts, 2021 – 2033 (Kilotons) (USD Million)
6.6.4.2. Market estimates and forecasts, by coating, 2021 – 2033 (Kilotons) (USD Million)
6.6.4.3. Market estimates and forecasts, by end-use, 2021 – 2033 (Kilotons) (USD Million)
6.6.5. UAE
6.6.5.1. Market estimates and forecasts, 2021 – 2033 (Kilotons) (USD Million)
6.6.5.2. Market estimates and forecasts, by coating, 2021 – 2033 (Kilotons) (USD Million)
6.6.5.3. Market estimates and forecasts, by end-use, 2021 – 2033 (Kilotons) (USD Million)
Chapter 7. Competitive Landscape
7.1. Recent Developments, By Key Market Participants
7.2. Company Categorization
7.3. Heat Map Analysis
7.4. Company Market Ranking
7.5. Vendor Landscape
7.5.1. List of Raw Material Suppliers
7.5.2. List of Distributors
7.5.3. List of Other Prominent Manufacturers
7.6. List of Prospective End Users
7.7. Strategy Mapping
7.8. Company Profiles/Listing
7.8.1. AGC Inc.
7.8.1.1. Company Overview
7.8.1.2. Financial Performance
7.8.1.3. Product Benchmarking
7.8.2. Central Glass Co. Ltd.
7.8.2.1. Company Overview
7.8.2.2. Financial Performance
7.8.2.3. Product Benchmarking
7.8.3. CEVITAL GROUP
7.8.3.1. Company Overview
7.8.3.2. Financial Performance
7.8.3.3. Product Benchmarking
7.8.4. China Glass Holding, Ltd.
7.8.4.1. Company Overview
7.8.4.2. Financial Performance
7.8.4.3. Product Benchmarking
7.8.5. Euroglas
7.8.5.1. Company Overview
7.8.5.2. Financial Performance
7.8.5.3. Product Benchmarking
7.8.6. Fuyao Glass Industry Group Co., Ltd.
7.8.6.1. Company Overview
7.8.6.2. Financial Performance
7.8.6.3. Product Benchmarking
7.8.7. Guardian Industries
7.8.7.1. Company Overview
7.8.7.2. Financial Performance
7.8.7.3. Product Benchmarking
7.8.8. Nippon Sheet Glass Co., Ltd.
7.8.8.1. Company Overview
7.8.8.2. Financial Performance
7.8.8.3. Product Benchmarking
7.8.9. Saint-Gobain
7.8.9.1. Company Overview
7.8.9.2. Financial Performance
7.8.9.3. Product Benchmarking
7.8.10. SCHOTT AG
7.8.10.1. Company Overview
7.8.10.2. Financial Performance
7.8.10.3. Product Benchmarking
List of Tables
Table 1 Coated glass market estimates & forecasts, 2021 – 2033 (Kilotons) (USD Million)
Table 2 Hard coated glass market estimates & forecasts, 2021 – 2033 (Kilotons) (USD Million)
Table 3 Soft coated glass market estimates & forecasts, 2021 – 2033 (Kilotons) (USD Million)
Table 4 Coated glass market estimates & forecasts, in architecture, 2021 – 2033 (Kilotons) (USD Million)
Table 5 Coated glass market estimates & forecasts, in automotive, 2021 – 2033 (Kilotons) (USD Million)
Table 6 Coated glass market estimates & forecasts, in optical, 2021 – 2033 (Kilotons) (USD Million)
Table 7 Coated glass market estimates & forecasts, in other applications, 2021 – 2033 (Kilotons) (USD Million)
Table 8 North America coated glass market estimates & forecast, 2021 – 2033 (Kilotons) (USD Million)
Table 9 North America coated glass market estimates & forecasts by coating, 2021 – 2033 (Kilotons)
Table 10 North America coated glass market estimates & forecasts by coating, 2021 – 2033 (USD Million)
Table 11 North America coated glass market estimates & forecasts by application, 2021 – 2033 (Kilotons)
Table 12 North America coated glass market estimates & forecasts by application, 2021 – 2033 (USD Million)
Table 13 U.S. coated glass market estimates & forecasts, 2021 – 2033 (Kilotons) (USD Million)
Table 14 U.S. coated glass market estimates & forecasts by coating, 2021 – 2033 (Kilotons)
Table 15 U.S. coated glass market estimates & forecasts by coating, 2021 – 2033 (USD Million)
Table 16 U.S. coated glass market estimates & forecasts by application, 2021 – 2033 (Kilotons)
Table 17 U.S. coated glass market estimates & forecasts by application, 2021 – 2033 (USD Million)
Table 18 Canada coated glass market estimates & forecasts, 2021 – 2033 (Kilotons) (USD Million)
Table 19 Canada coated glass market estimates & forecasts by coating, 2021 – 2033 (Kilotons)
Table 20 Canada coated glass market estimates & forecasts by coating, 2021 – 2033 (USD Million)
Table 21 Canada coated glass market estimates & forecasts by application, 2021 – 2033 (Kilotons)
Table 22 Canada coated glass market estimates & forecasts by application, 2021 – 2033 (USD Million)
Table 23 Mexico coated glass market estimates & forecast, 2021 – 2033 (Kilotons) (USD Million)
Table 24 Mexico coated glass market estimates & forecasts by coating, 2021 – 2033 (Kilotons)
Table 25 Mexico coated glass market estimates & forecasts by coating, 2021 – 2033 (USD Million)
Table 26 Mexico coated glass market estimates & forecasts by application, 2021 – 2033 (Kilotons)
Table 27 Mexico coated glass market estimates & forecasts by application, 2021 – 2033 (USD Million)
Table 28 Europe coated glass market estimates & forecasts, 2021 – 2033 (Kilotons) (USD Million)
Table 29 Europe coated glass market estimates & forecasts by coating, 2021 – 2033 (Kilotons)
Table 30 Europe coated glass market estimates & forecasts by coating, 2021 – 2033 (USD Million)
Table 31 Europe coated glass market estimates & forecasts by application, 2021 – 2033 (Kilotons)
Table 32 Europe coated glass market estimates & forecasts by application, 2021 – 2033 (USD Million)
Table 33 Germany coated glass market estimates & forecasts, 2021 – 2033 (Kilotons) (USD Million)
Table 34 Germany coated glass market estimates & forecasts by coating, 2021 – 2033 (Kilotons)
Table 35 Germany coated glass market estimates & forecasts by coating, 2021 – 2033 (USD Million)
Table 36 Germany coated glass market estimates & forecasts by application, 2021 – 2033 (Kilotons)
Table 37 Germany coated glass market estimates & forecasts by application, 2021 – 2033 (USD Million)
Table 38 Italy coated glass market estimates & forecasts, 2021 – 2033 (Kilotons) (USD Million)
Table 39 Italy coated glass market estimates & forecasts by coating, 2021 – 2033 (Kilotons)
Table 40 Italy coated glass market estimates & forecasts by coating, 2021 – 2033 (USD Million)
Table 41 Italy coated glass market estimates & forecasts by application, 2021 – 2033 (Kilotons)
Table 42 Italy coated glass market estimates & forecasts by application, 2021 – 2033 (USD Million)
Table 43 France coated glass market estimates & forecast, 2021 – 2033 (Kilotons) (USD Million)
Table 44 France coated glass market estimates & forecasts by coating, 2021 – 2033 (Kilotons)
Table 45 France coated glass market estimates & forecasts by coating, 2021 – 2033 (USD Million)
Table 46 France coated glass market estimates & forecasts by application, 2021 – 2033 (Kilotons)
Table 47 France coated glass market estimates & forecasts by application, 2021 – 2033 (USD Million)
Table 48 Russia coated glass market estimates & forecasts, 2021 – 2033 (Kilotons) (USD Million)
Table 49 Russia coated glass market estimates & forecasts by coating, 2021 – 2033 (Kilotons)
Table 50 Russia coated glass market estimates & forecasts by coating, 2021 – 2033 (USD Million)
Table 51 Russia coated glass market estimates & forecasts by application, 2021 – 2033 (Kilotons)
Table 52 Russia coated glass market estimates & forecasts by application, 2021 – 2033 (USD Million)
Table 53 Asia Pacific coated glass market estimates & forecast, 2021 – 2033 (Kilotons) (USD Million)
Table 54 Asia Pacific coated glass market estimates & forecasts by coating, 2021 – 2033 (Kilotons)
Table 55 Asia Pacific coated glass market estimates & forecasts by coating, 2021 – 2033 (USD Million)
Table 56 Asia Pacific coated glass market estimates & forecasts by application, 2021 – 2033 (Kilotons)
Table 57 Asia Pacific coated glass market estimates & forecasts by application, 2021 – 2033 (USD Million)
Table 58 China coated glass market estimates & forecast, 2021 – 2033 (Kilotons) (USD Million)
Table 59 China coated glass market estimates & forecasts by coating, 2021 – 2033 (Kilotons)
Table 60 China coated glass market estimates & forecasts by coating, 2021 – 2033 (USD Million)
Table 61 China coated glass market estimates & forecasts by application, 2021 – 2033 (Kilotons)
Table 62 China coated glass market estimates & forecasts by application, 2021 – 2033 (USD Million)
Table 63 Japan coated glass market estimates & forecast, 2021 – 2033 (Kilotons) (USD Million)
Table 64 Japan coated glass market estimates & forecasts by coating, 2021 – 2033 (Kilotons)
Table 65 Japan coated glass market estimates & forecasts by coating, 2021 – 2033 (USD Million)
Table 66 Japan coated glass market estimates & forecasts by application, 2021 – 2033 (Kilotons)
Table 67 Japan coated glass market estimates & forecasts by application, 2021 – 2033 (USD Million)
Table 68 India coated glass market estimates & forecast, 2021 – 2033 (Kilotons) (USD Million)
Table 69 India coated glass market estimates & forecasts by coating, 2021 – 2033 (Kilotons)
Table 70 India coated glass market estimates & forecasts by coating, 2021 – 2033 (USD Million)
Table 71 India coated glass market estimates & forecasts by application, 2021 – 2033 (Kilotons)
Table 72 India coated glass market estimates & forecasts by application, 2021 – 2033 (USD Million)
Table 73 Latin America coated glass market estimates & forecasts, 2021 – 2033 (Kilotons) (USD Million)
Table 74 Latin America coated glass market estimates & forecasts by coating, 2021 – 2033 (Kilotons)
Table 75 Latin America coated glass market estimates & forecasts by coating, 2021 – 2033 (USD Million)
Table 76 Latin America coated glass market estimates & forecasts by application, 2021 – 2033 (Kilotons)
Table 77 Latin America coated glass market estimates & forecasts by application, 2021 – 2033 (USD Million)
Table 78 Brazil coated glass market estimates & forecast, 2021 – 2033 (Kilotons) (USD Million)
Table 79 Brazil coated glass market estimates & forecasts by coating, 2021 – 2033 (Kilotons)
Table 80 Brazil coated glass market estimates & forecasts by coating, 2021 – 2033 (USD Million)
Table 81 Brazil coated glass market estimates & forecasts by application, 2021 – 2033 (Kilotons)
Table 82 Brazil coated glass market estimates & forecasts by application, 2021 – 2033 (USD Million)
Table 83 Middle East & Africa coated glass market estimates & forecast, 2021 – 2033 (Kilotons) (USD Million)
Table 84 Middle East & Africa coated glass market estimates & forecasts by coating, 2021 – 2033 (Kilotons)
Table 85 Middle East & Africa coated glass market estimates & forecasts by coating, 2021 – 2033 (USD Million)
Table 86 Middle East & Africa coated glass market estimates & forecasts by application, 2021 – 2033 (Kilotons)
Table 87 Middle East & Africa coated glass market estimates & forecasts by application, 2021 – 2033 (USD Million)
Table 88 Saudi Arabia coated glass market estimates & forecasts, 2021 – 2033 (Kilotons) (USD Million)
Table 89 Saudi Arabia coated glass market estimates & forecasts by coating, 2021 – 2033 (Kilotons)
Table 90 Saudi Arabia coated glass market estimates & forecasts by coating, 2021 – 2033 (USD Million)
Table 91 Saudi Arabia coated glass market estimates & forecasts by application, 2021 – 2033 (Kilotons)
Table 92 Saudi Arabia coated glass market estimates & forecasts by application, 2021 – 2033 (USD Million)
Table 93 UAE coated glass market estimates & forecasts, 2021 – 2033 (Kilotons) (USD Million)
Table 94 UAE coated glass market estimates & forecasts by coating, 2021 – 2033 (Kilotons)
Table 95 UAE coated glass market estimates & forecasts by coating, 2021 – 2033 (USD Million)
Table 96 UAE coated glass market estimates & forecasts by application, 2021 – 2033 (Kilotons)
Table 97 UAE coated glass market estimates & forecasts by application, 2021 – 2033 (USD Million)
List of Figures
Fig. 1 Market segmentation
Fig. 2 Information procurement
Fig. 3 Market formulation and validation
Fig. 4 Data validating & publishing
Fig. 5 Market snapshot
Fig. 6 Segmental outlook
Fig. 7 Competitive Outlook
Fig. 8 Coated Glass market outlook, 2021 – 2033 (USD Million) (Kilotons)
Fig. 9 Value chain analysis
Fig. 10 Market dynamics
Fig. 11 Porter’s Analysis
Fig. 12 PESTEL Analysis
Fig. 13 Coated Glass market, by coating: Key takeaways
Fig. 14 Coated Glass market, by coating: Market share, 2025 & 2033
Fig. 15 Coated Glass market, by application: Key takeaways
Fig. 16 Coated Glass market, by application: Market share, 2025 & 2033
Fig. 17 Coated Glass market: Regional analysis, 2025 & 2033
Fig. 18 Coated Glass market, by region: Key takeaways