チラー市場 - 製品(水冷式、空冷式)、用途別(産業用、業務用)、コンプレッサータイプ別(スクリューチラー、遠心式チラー、吸収式チラー)、地域、セグメント別予測による市場規模、成長と動向分析レポート 2026-2033年
Chillers Market Size, Share & Trends Analysis Report By Product (Water-Cooled, Air-Cooled), By Application (Industrial, Commercial), By Compressor Type (Screw Chillers, Centrifugal Chillers, Absorption Chillers), By Region, And Segment Forecasts, 2026 - 2033
| 出版 | Grand View Research |
| 出版年月 | 2025年12月 |
| ページ数 | 200 |
| 価格 | 記載以外のライセンスについてはお問合せください |
| シングルユーザ | USD 5,950 |
| 種別 | 英文調査報告書 |
| 商品番号 | SMR-14811 |

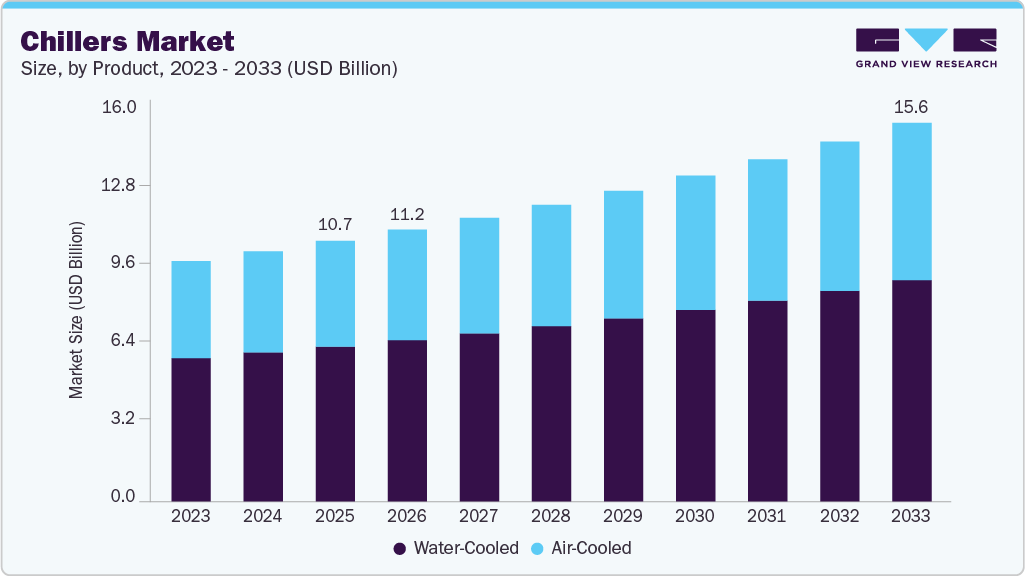
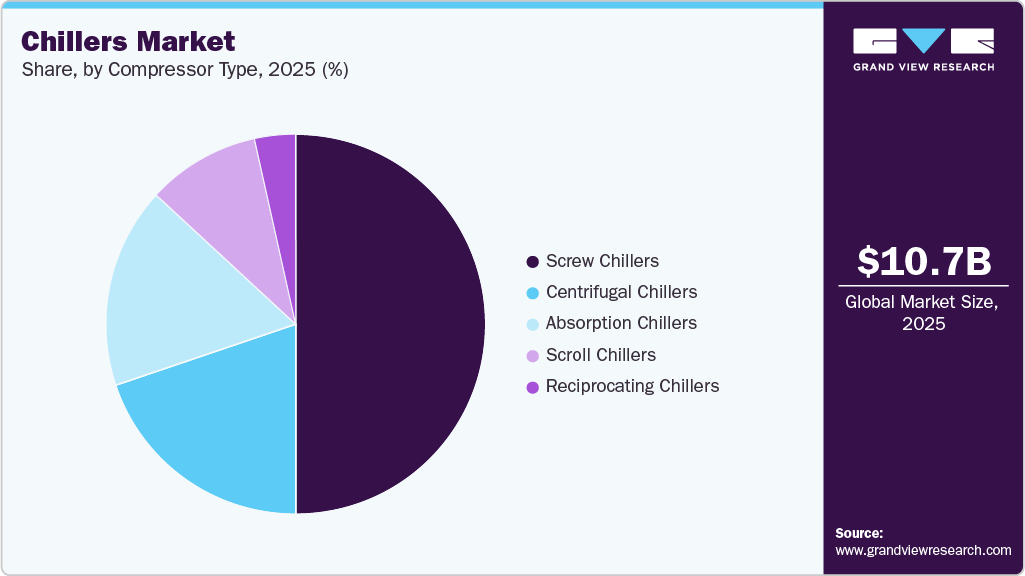
世界のチラー市場規模は2025年に107億5,860万米ドルと評価され、2026年から2033年にかけて4.9%のCAGRで成長し、2033年には156億4,310万米ドルに達すると予測されています。この市場は、商業および産業部門におけるコスト効率とエネルギー効率に優れた空間冷却アプリケーションの需要の高まりによって牽引されています。
これにより、予測期間中にチラーの需要が増加すると予想されます。米国国勢調査局によると、2024年の非住宅商業建設支出は前年比で約7%増加し、製造プロジェクトは23%の成長が顕著です。さらに、データの保管と処理のためのコンピュータシステムとサーバーの収容に不可欠なデータセンターには、引き続き多額の投資が行われています。例えば、Metaは最近、ルイジアナ州の農村部におけるデータセンタープロジェクトへの50億ドルの投資を発表しました。特に製造業とデータセンターにおける建設支出の急増は、高度なチラーシステムの需要を大きく押し上げています。どちらのセクターも、最適な運用条件を維持するために効率的で大容量の冷却ソリューションを必要としており、企業が温度に敏感な環境をサポートするインフラに投資するにつれて、チラー市場の成長をさらに促進しています。
このレポートは、世界、地域、国レベルでの収益成長を予測し、2021年から2033年までの各サブセグメントの最新の業界動向の分析を提供します。この調査では、Grand View Researchが世界のチラー市場レポートを製品、用途、コンプレッサーの種類、地域に基づいてセグメント化しました。
Chillers Market Summary
The global chillers market size was valued at USD 10,758.6 million in 2025 and is projected to reach USD 15,643.1 million by 2033, growing at a CAGR of 4.9% from 2026 to 2033. The market is driven by the rising need for cost-effective and energy-efficient space cooling applications in commercial and industrial sectors.
This, in turn, will likely augment the demand for chillers over the forecast period. According to the U.S. Census Bureau, non-residential commercial construction spending has risen nearly 7% in 2024 compared to the previous year, with manufacturing projects experiencing a notable 23% growth. Additionally, data centers, which are essential for housing computer systems and servers for data storage and processing, continue to see substantial investments. For instance, Meta recently announced a USD 5 billion investment in a data center project in rural Louisiana. This surge in construction spending, particularly in manufacturing and data centers, is significantly driving the demand for advanced chiller systems. Both sectors require efficient, high-capacity cooling solutions to maintain optimal operational conditions, further fueling the growth of the chillers market as companies invest in infrastructure that supports temperature-sensitive environments.
chillers-market-share
Chillers Market Report Scope
| Report Attribute | Details |
| Market size value in 2026 | USD 11,220.6 million |
| Revenue forecast in 2033 | USD 15,643.1 million |
| Growth rate | CAGR of 4.9% from 2026 to 2033 |
| Historical data | 2021 – 2024 |
| Forecast period | 2026 – 2033 |
| Quantitative units | Revenue in USD million and CAGR from 2025 to 2033 |
| Report coverage | Revenue forecast, company ranking, competitive landscape, growth factors, and trends |
| Segments covered | Product, Application, Compressor Type, and Region |
| Regional scope | North America; Europe; Asia Pacific; Central & South America; Middle East & Africa |
| Country scope | U.S.; Canada; Mexico; UK; Germany; France; Italy; Spain; Russia; China; Japan; India; Australia; South Korea; Thailand; Indonesia; Malaysia; Brazil; Argentina; Saudi Arabia; South Africa; UAE |
| Key companies profiled | Trane; Cold Shot Chillers; Tandem Chillers; Drake Refrigeration, Inc.; Refra; Carrier; FRIGEL FIRENZE S.p.A.; Midea; Rite-Temp; Multistack, LLC.; DAIKIN INDUSTRIES, Ltd.; General Air Product; ClimaCool Corp.; Johnson Controls; Fluid Chillers, Inc. |
| Customization scope | Free report customization (equivalent up to 8 analysts working days) with purchase. Addition or alteration to country, regional & segment scope. |
Global Chillers Market Report Segmentation
This report forecasts revenue growth at global, regional, and country levels and provides an analysis of the latest industry trends in each of the sub-segments from 2021 to 2033. For this study, Grand View Research has segmented the global chillers market report based on product, application, compressor type, and region.
- Product Outlook (Revenue, USD Million, 2021 – 2033)
- Water-Cooled
o <50kW
o 51-100kW
o 101-500kW
o 501-1000kW
o 1001-1500kW
o >1501kW
- Air-Cooled
o <50kW
o 51-100kW
o 101-500kW
o 501-1000kW
o 1001-1500kW
o >1501kW
- Application Outlook (Revenue, USD Million, 2021 – 2033)
- Commercial
o Corporate Offices
o Data Centers
o Public Buildings
o Mercantile & Service
o Healthcare
o Others
- Industrial
o Chemicals & Petrochemicals
o Food & Beverage
o Metal Manufacturing & Machining
o Medical & Pharmaceutical
o Plastics
o Others
- Residential
- Compressor Type Outlook (Revenue, USD Million, 2021 – 2033)
- Screw Chillers
- Centrifugal Chillers
- Absorption Chillers
- Scroll Chillers
- Reciprocating Chillers
- Regional Outlook (Revenue, USD Million, 2021 – 2033)
- North America
o U.S.
o Canada
o Mexico
- Europe
o Germany
o France
o UK
o Italy
o Spain
o Russia
- Asia Pacific
o China
o Japan
o India
o Australia
o Thailand
o South Korea
o Indonesia
o Malaysia
- Central & South America
o Brazil
o Argentina
- Middle East and Africa
o Saudi Arabia
o South Africa
o UAE
Table of Contents
Chapter 1. Methodology and Scope
1.1. Market Segmentation & Scope
1.2. Market Definition
1.3. Information Procurement
1.3.1. Purchased Database
1.3.2. GVR’s Internal Database
1.3.3. Secondary Sources & Third-Party Perspectives
1.3.4. Primary Research
1.4. Information Analysis
1.4.1. Data Analysis Models
1.5. Market Formulation & Data Visualization
1.6. Data Validation & Publishing
Chapter 2. Executive Summary
2.1. Market Snapshot
2.2. Segment Snapshot
2.3. Competitive Landscape Snapshot
Chapter 3. Chillers Market Variables, Trends & Scope
3.1. Market Lineage Outlook
3.2. Concentration & Growth Prospect Mapping
3.3. Industry Value Chain Analysis
3.3.1. Distribution Channel Analysis
3.3.2. Raw Material Trends
3.3.3. Technological Overview
3.4. Regulatory Framework
3.5. Technology Overview
3.6. Market Dynamics
3.6.1. Market Driver Analysis
3.6.2. Market Restraint Analysis
3.6.3. Industry Challenges
3.6.4. Industry Opportunities
3.7. Economic Mega-Trend Analysis
3.8. Industry Analysis Tools
3.8.1. Porter’s Five Forces Analysis
3.8.2. Macro-environmental Analysis
Chapter 4. Chillers Market: Product Estimates & Trend Analysis
4.1. Product Movement Analysis & Market Share, 2025 & 2033
4.2. Chillers Market Estimates & Forecast, By Product, 2021 to 2033 (USD Million)
4.3. Water-Cooled
4.3.1. Market Revenue Estimates and Forecasts, 2021 – 2033 (USD Million)
4.3.2. <50kW
4.3.2.1. Market estimates and forecasts, 2021 to 2033 (USD Million)
4.3.3. 50-100 kW
4.3.3.1. Market estimates and forecasts, 2021 to 2033 (USD Million)
4.3.4. 101-500 kW
4.3.4.1. Market estimates and forecasts, 2021 to 2033 (USD Million)
4.3.5. 501-1000 kW
4.3.5.1. Market estimates and forecasts, 2021 to 2033 (USD Million)
4.3.6. 1001-1500 kW
4.3.6.1. Market estimates and forecasts, 2021 to 2033 (USD Million)
4.3.7. >1500kW
4.3.7.1. Market estimates and forecasts, 2021 to 2033 (USD Million)
4.4. Air-Cooled
4.4.1. Market Revenue Estimates and Forecasts, 2021 – 2033 (USD Million)
4.4.2. <50kW
4.4.2.1. Market estimates and forecasts, 2021 to 2033 (USD Million)
4.4.3. 50-100 kW
4.4.3.1. Market estimates and forecasts, 2021 to 2033 (USD Million)
4.4.4. 101-500 kW
4.4.4.1. Market estimates and forecasts, 2021 to 2033 (USD Million)
4.4.5. 501-1000 kW
4.4.5.1. Market estimates and forecasts, 2021 to 2033 (USD Million)
4.4.6. 1001-1500 kW
4.4.6.1. Market estimates and forecasts, 2021 to 2033 (USD Million)
4.4.7. >1500kW
4.4.7.1. Market estimates and forecasts, 2021 to 2033 (USD Million)
Chapter 5. Chillers Market: Application Estimates & Trend Analysis
5.1. Product Movement Analysis & Market Share, 2025 & 2033
5.2. Chillers Market Estimates & Forecast, By Product, 2021 to 2033 (USD Million)
5.3. Residential
5.3.1. Market Revenue Estimates and Forecasts, 2021 – 2033 (USD Million)
5.4. Commercial
5.4.1. Market Revenue Estimates and Forecasts, 2021 – 2033 (USD Million)
5.4.2. Corporate Offices
5.4.2.1. Market estimates and forecasts, 2021 to 2033 (USD Million)
5.4.3. Data Centers
5.4.3.1. Market estimates and forecasts, 2021 to 2033 (USD Million)
5.4.4. Public Buildings
5.4.4.1. Market estimates and forecasts, 2021 to 2033 (USD Million)
5.4.5. Mercantile & Service
5.4.5.1. Market estimates and forecasts, 2021 to 2033 (USD Million)
5.4.6. Health Care
5.4.6.1. Market estimates and forecasts, 2021 to 2033 (USD Million)
5.4.7. Others
5.4.7.1. Market estimates and forecasts, 2021 to 2033 (USD Million)
5.5. Industrial
5.5.1. Market Revenue Estimates and Forecasts, 2021 – 2033 (USD Million)
5.5.2. Chemicals & Petrochemicals
5.5.2.1. Market estimates and forecasts, 2021 to 2033 (USD Million)
5.5.3. Food & beverage
5.5.3.1. Market estimates and forecasts, 2021 to 2033 (USD Million)
5.5.4. Metal Manufacturing & Machining
5.5.4.1. Market estimates and forecasts, 2021 to 2033 (USD Million)
5.5.5. Medical & Pharmaceutical
5.5.5.1. Market estimates and forecasts, 2021 to 2033 (USD Million)
5.5.6. Plastics
5.5.6.1. Market estimates and forecasts, 2021 to 2033 (USD Million)
5.5.7. Others
5.5.7.1. Market estimates and forecasts, 2021 to 2033 (USD Million)
Chapter 6. Chillers Market: Compressor Type Estimates & Trend Analysis
6.1. Compressor Type Movement Analysis & Market Share, 2025 & 2033
6.2. Chillers Market Estimates & Forecast, By Compressor Type, 2021 to 2033 (USD Million)
6.3. Screw Chillers
6.3.1. Market Revenue Estimates and Forecasts, 2021 – 2033 (USD Million)
6.4. Centrifugal Chillers
6.4.1. Market Revenue Estimates and Forecasts, 2021 – 2033 (USD Million)
6.5. Absorption Chillers
6.5.1. Market Revenue Estimates and Forecasts, 2021 – 2033 (USD Million)
6.6. Scroll Chillers
6.6.1. Market Revenue Estimates and Forecasts, 2021 – 2033 (USD Million)
6.7. Reciprocating Chillers
6.7.1. Market Revenue Estimates and Forecasts, 2021 – 2033 (USD Million)
Chapter 7. Chillers Market: Regional Estimates & Trend Analysis
7.1. Regional Movement Analysis & Market Share, 2025 & 2033
7.2. North America
7.2.1. Market Estimates & Forecast, 2021 – 2033 (USD Million)
7.2.2. Market estimates & forecast, by product 2021 – 2033 (USD Million)
7.2.3. Market estimates & forecast, by application 2021 – 2033 (USD Million)
7.2.4. Market estimates & forecast, by compressor type 2021 – 2033 (USD
7.2.5. U.S.
7.2.5.1. Key country dynamics
7.2.5.2. Market estimates & forecast, 2021 – 2033 (USD Million)
7.2.5.3. Market estimates & forecast, by product 2021 – 2033 (USD Million)
7.2.5.4. Market estimates & forecast, by application 2021 – 2033 (USD Million)
7.2.5.5. Market estimates & forecast, by compressor type 2021 – 2033 (USD Million)
7.2.6. Canada
7.2.6.1. Key country dynamics
7.2.6.2. Market estimates & forecast, 2021 – 2033 (USD Million)
7.2.6.3. Market estimates & forecast, by product 2021 – 2033 (USD Million)
7.2.6.4. Market estimates & forecast, by application 2021 – 2033 (USD Million)
7.2.6.5. Market estimates & forecast, by compressor type 2021 – 2033 (USD Million)
7.2.7. Mexico
7.2.7.1. Key country dynamics
7.2.7.2. Market estimates & forecast, 2021 – 2033 (USD Million)
7.2.7.3. Market estimates & forecast, by product 2021 – 2033 (USD Million)
7.2.7.4. Market estimates & forecast, by application 2021 – 2033 (USD Million)
7.2.7.5. Market estimates & forecast, by compressor type 2021 – 2033 (USD Million)
7.3. Europe
7.3.1. Market Estimates & Forecast, 2021 – 2033 (USD Million)
7.3.2. Market estimates & forecast, by product 2021 – 2033 (USD Million)
7.3.3. Market estimates & forecast, by application 2021 – 2033 (USD Million)
7.3.4. Market estimates & forecast, by compressor type 2021 – 2033 (USD
7.3.5. Germany
7.3.5.1. Key country dynamics
7.3.5.2. Market estimates & forecast, 2021 – 2033 (USD Million)
7.3.5.3. Market estimates & forecast, by product 2021 – 2033 (USD Million)
7.3.5.4. Market estimates & forecast, by application 2021 – 2033 (USD Million)
7.3.5.5. Market estimates & forecast, by compressor type 2021 – 2033 (USD Million)
7.3.6. France
7.3.6.1. Key country dynamics
7.3.6.2. Market estimates & forecast, 2021 – 2033 (USD Million)
7.3.6.3. Market estimates & forecast, by product 2021 – 2033 (USD Million)
7.3.6.4. Market estimates & forecast, by application 2021 – 2033 (USD Million)
7.3.6.5. Market estimates & forecast, by compressor type 2021 – 2033 (USD Million)
7.3.7. UK
7.3.7.1. Key country dynamics
7.3.7.2. Market estimates & forecast, 2021 – 2033 (USD Million)
7.3.7.3. Market estimates & forecast, by product 2021 – 2033 (USD Million)
7.3.7.4. Market estimates & forecast, by application 2021 – 2033 (USD Million)
7.3.7.5. Market estimates & forecast, by compressor type 2021 – 2033 (USD Million)
7.3.8. Italy
7.3.8.1. Key country dynamics
7.3.8.2. Market estimates & forecast, 2021 – 2033 (USD Million)
7.3.8.3. Market estimates & forecast, by product 2021 – 2033 (USD Million)
7.3.8.4. Market estimates & forecast, by application 2021 – 2033 (USD Million)
7.3.8.5. Market estimates & forecast, by compressor type 2021 – 2033 (USD Million)
7.3.9. Spain
7.3.9.1. Key country dynamics
7.3.9.2. Market estimates & forecast, 2021 – 2033 (USD Million)
7.3.9.3. Market estimates & forecast, by product 2021 – 2033 (USD Million)
7.3.9.4. Market estimates & forecast, by application 2021 – 2033 (USD Million)
7.3.9.5. Market estimates & forecast, by compressor type 2021 – 2033 (USD Million)
7.3.10. Russia
7.3.10.1. Key country dynamics
7.3.10.2. Market estimates & forecast, 2021 – 2033 (USD Million)
7.3.10.3. Market estimates & forecast, by product 2021 – 2033 (USD Million)
7.3.10.4. Market estimates & forecast, by application 2021 – 2033 (USD Million)
7.3.10.5. Market estimates & forecast, by compressor type 2021 – 2033 (USD Million)
7.4. Asia Pacific
7.4.1. Market Estimates & Forecast, 2021 – 2033 (USD Million)
7.4.2. Market estimates & forecast, by product 2021 – 2033 (USD Million)
7.4.3. Market estimates & forecast, by application 2021 – 2033 (USD Million)
7.4.4. Market estimates & forecast, by compressor type 2021 – 2033 (USD
7.4.5. China
7.4.5.1. Key country dynamics
7.4.5.2. Market estimates & forecast, 2021 – 2033 (USD Million)
7.4.5.3. Market estimates & forecast, by product 2021 – 2033 (USD Million)
7.4.5.4. Market estimates & forecast, by application 2021 – 2033 (USD Million)
7.4.5.5. Market estimates & forecast, by compressor type 2021 – 2033 (USD Million)
7.4.6. India
7.4.6.1. Key country dynamics
7.4.6.2. Market estimates & forecast, 2021 – 2033 (USD Million)
7.4.6.3. Market estimates & forecast, by product 2021 – 2033 (USD Million)
7.4.6.4. Market estimates & forecast, by application 2021 – 2033 (USD Million)
7.4.6.5. Market estimates & forecast, by compressor type 2021 – 2033 (USD Million)
7.4.7. Japan
7.4.7.1. Key country dynamics
7.4.7.2. Market estimates & forecast, 2021 – 2033 (USD Million)
7.4.7.3. Market estimates & forecast, by product 2021 – 2033 (USD Million)
7.4.7.4. Market estimates & forecast, by application 2021 – 2033 (USD Million)
7.4.7.5. Market estimates & forecast, by compressor type 2021 – 2033 (USD Million)
7.4.8. Australia
7.4.8.1. Key country dynamics
7.4.8.2. Market estimates & forecast, 2021 – 2033 (USD Million)
7.4.8.3. Market estimates & forecast, by product 2021 – 2033 (USD Million)
7.4.8.4. Market estimates & forecast, by application 2021 – 2033 (USD Million)
7.4.8.5. Market estimates & forecast, by compressor type 2021 – 2033 (USD Million)
7.4.9. Thailand
7.4.9.1. Key country dynamics
7.4.9.2. Market estimates & forecast, 2021 – 2033 (USD Million)
7.4.9.3. Market estimates & forecast, by product 2021 – 2033 (USD Million)
7.4.9.4. Market estimates & forecast, by application 2021 – 2033 (USD Million)
7.4.9.5. Market estimates & forecast, by compressor type 2021 – 2033 (USD Million)
7.4.10. South Korea
7.4.10.1. Key country dynamics
7.4.10.2. Market estimates & forecast, 2021 – 2033 (USD Million)
7.4.10.3. Market estimates & forecast, by product 2021 – 2033 (USD Million)
7.4.10.4. Market estimates & forecast, by application 2021 – 2033 (USD Million)
7.4.10.5. Market estimates & forecast, by compressor type 2021 – 2033 (USD Million)
7.4.11. Indonesia
7.4.11.1. Key country dynamics
7.4.11.2. Market estimates & forecast, 2021 – 2033 (USD Million)
7.4.11.3. Market estimates & forecast, by product 2021 – 2033 (USD Million)
7.4.11.4. Market estimates & forecast, by application 2021 – 2033 (USD Million)
7.4.11.5. Market estimates & forecast, by compressor type 2021 – 2033 (USD Million)
7.4.12. Malaysia
7.4.12.1. Key country dynamics
7.4.12.2. Market estimates & forecast, 2021 – 2033 (USD Million)
7.4.12.3. Market estimates & forecast, by product 2021 – 2033 (USD Million)
7.4.12.4. Market estimates & forecast, by application 2021 – 2033 (USD Million)
7.4.12.5. Market estimates & forecast, by compressor type 2021 – 2033 (USD Million)
7.5. Central & South America
7.5.1. Market Estimates & Forecast, 2021 – 2033 (USD Million)
7.5.2. Market estimates & forecast, by product 2021 – 2033 (USD Million)
7.5.3. Market estimates & forecast, by application 2021 – 2033 (USD Million)
7.5.4. Market estimates & forecast, by compressor type 2021 – 2033 (USD
7.5.5. Brazil
7.5.5.1. Key country dynamics
7.5.5.2. Market estimates & forecast, 2021 – 2033 (USD Million)
7.5.5.3. Market estimates & forecast, by product 2021 – 2033 (USD Million)
7.5.5.4. Market estimates & forecast, by application 2021 – 2033 (USD Million)
7.5.5.5. Market estimates & forecast, by compressor type 2021 – 2033 (USD Million)
7.5.6. Argentina
7.5.6.1. Key country dynamics
7.5.6.2. Market estimates & forecast, 2021 – 2033 (USD Million)
7.5.6.3. Market estimates & forecast, by product 2021 – 2033 (USD Million)
7.5.6.4. Market estimates & forecast, by application 2021 – 2033 (USD Million)
7.5.6.5. Market estimates & forecast, by compressor type 2021 – 2033 (USD Million)
7.6. Middle East & Africa
7.6.1. Market Estimates & Forecast, 2021 – 2033 (USD Million)
7.6.2. Market estimates & forecast, by product 2021 – 2033 (USD Million)
7.6.3. Market estimates & forecast, by application 2021 – 2033 (USD Million)
7.6.4. Market estimates & forecast, by compressor type 2021 – 2033 (USD
7.6.5. Saudi Arabia
7.6.5.1. Key country dynamics
7.6.5.2. Market estimates & forecast, 2021 – 2033 (USD Million)
7.6.5.3. Market estimates & forecast, by product 2021 – 2033 (USD Million)
7.6.5.4. Market estimates & forecast, by application 2021 – 2033 (USD Million)
7.6.5.5. Market estimates & forecast, by compressor type 2021 – 2033 (USD Million)
7.6.6. South Africa
7.6.6.1. Key country dynamics
7.6.6.2. Market estimates & forecast, 2021 – 2033 (USD Million)
7.6.6.3. Market estimates & forecast, by product 2021 – 2033 (USD Million)
7.6.6.4. Market estimates & forecast, by application 2021 – 2033 (USD Million)
7.6.6.5. Market estimates & forecast, by compressor type 2021 – 2033 (USD Million)
7.6.7. UAE
7.6.7.1. Key country dynamics
7.6.7.2. Market estimates & forecast, 2021 – 2033 (USD Million)
7.6.7.3. Market estimates & forecast, by product 2021 – 2033 (USD Million)
7.6.7.4. Market estimates & forecast, by application 2021 – 2033 (USD Million)
7.6.7.5. Market estimates & forecast, by compressor type 2021 – 2033 (USD Million)
Chapter 8. Chillers Market – Competitive Landscape
8.1. Recent Developments & Impact Analysis, By Key Market Participants
8.2. Company Categorization
8.3. Company Position Analysis, 2025
8.4. Company Heat Map Analysis, 2025
8.5. Strategy Mapping
8.5.1. Expansion
8.5.2. Mergers & Acquisition
8.5.3. Partnerships & Collaborations
8.5.4. New Product Launches
8.5.5. Research And Development
8.6. Company Profiles
8.6.1. Trane
8.6.1.1. Participant’s overview
8.6.1.2. Financial performance
8.6.1.3. Product benchmarking
8.6.1.4. Recent developments
8.6.2. Cold Shot Chillers
8.6.2.1. Participant’s overview
8.6.2.2. Financial performance
8.6.2.3. Product benchmarking
8.6.2.4. Recent developments
8.6.3. Tandem Chillers
8.6.3.1. Participant’s overview
8.6.3.2. Financial performance
8.6.3.3. Product benchmarking
8.6.3.4. Recent developments
8.6.4. Drake Refrigeration, Inc
8.6.4.1. Participant’s overview
8.6.4.2. Financial performance
8.6.4.3. Product benchmarking
8.6.4.4. Recent developments
8.6.5. Refra
8.6.5.1. Participant’s overview
8.6.5.2. Financial performance
8.6.5.3. Product benchmarking
8.6.5.4. Recent developments
8.6.6. Carrier
8.6.6.1. Participant’s overview
8.6.6.2. Financial performance
8.6.6.3. Product benchmarking
8.6.6.4. Recent developments
8.6.7. FRIGEL FIRENZE S.p.A.
8.6.7.1. Participant’s overview
8.6.7.2. Financial performance
8.6.7.3. Product benchmarking
8.6.7.4. Recent developments
8.6.8. Midea
8.6.8.1. Participant’s overview
8.6.8.2. Financial performance
8.6.8.3. Product benchmarking
8.6.8.4. Recent developments
8.6.9. Daikin Industries, Ltd.
8.6.9.1. Participant’s overview
8.6.9.2. Financial performance
8.6.9.3. Product benchmarking
8.6.9.4. Recent developments
8.6.10. Johnson Controls
8.6.10.1. Participant’s overview
8.6.10.2. Financial performance
8.6.10.3. Product benchmarking
8.6.10.4. Recent developments
8.6.11. Rite-Temp
8.6.11.1. Participant’s overview
8.6.11.2. Financial performance
8.6.11.3. Product benchmarking
8.6.11.4. Recent developments
8.6.12. General Air Products
8.6.12.1. Participant’s overview
8.6.12.2. Financial performance
8.6.12.3. Product benchmarking
8.6.12.4. Recent developments
8.6.13. ClimaCool Corp.
8.6.13.1. Participant’s overview
8.6.13.2. Financial performance
8.6.13.3. Product benchmarking
8.6.13.4. Recent developments
8.6.14. Fluid Chillers, Inc.
8.6.14.1. Participant’s overview
8.6.14.2. Financial performance
8.6.14.3. Product benchmarking
8.6.14.4. Recent developments
8.6.15. Multistack International Limited
8.6.15.1. Participant’s overview
8.6.15.2. Financial performance
8.6.15.3. Product benchmarking
8.6.15.4. Recent developments
List of Tables
Table 1 List of abbreviation
Table 2 Chillers market, 2021 – 2033 (USD Million)
Table 3 Global market estimates and forecasts by product, 2021 – 2033 (USD Million)
Table 4 Global air-cooled market estimates and forecasts by capacity, 2021 – 2033 (USD Million)
Table 5 Global water-cooled market estimates and forecasts by capacity, 2021 – 2033 (USD Million)
Table 6 Global market estimates and forecasts by application, 2021 – 2033 (USD Million)
Table 7 Global commercial chiller market estimates and forecasts by application, 2021 – 2033 (USD Million)
Table 8 Global industrial chiller market estimates and forecasts by application, 2021 – 2033 (USD Million)
Table 9 Global market estimates and forecasts by compressor, 2021 – 2033 (USD Million)
Table 10 Global market estimates and forecasts by region, 2021 – 2033 (USD Million)
Table 11 North America market estimates and forecasts by product, 2021 – 2033 (USD Million)
Table 12 North America air-cooled market estimates and forecasts by capacity, 2021 – 2033 (USD Million)
Table 13 North America water-cooled market estimates and forecasts by capacity, 2021 – 2033 (USD Million)
Table 14 North America market estimates and forecasts by application, 2021 – 2033 (USD Million)
Table 15 North America commercial chiller market estimates and forecasts by application, 2021 – 2033 (USD Million)
Table 16 North America industrial chiller market estimates and forecasts by application, 2021 – 2033 (USD Million)
Table 17 North America market estimates and forecasts by compressor, 2021 – 2033 (USD Million)
Table 18 U.S. market estimates and forecasts by product, 2021 – 2033 (USD Million)
Table 19 U.S. air-cooled market estimates and forecasts by capacity, 2021 – 2033 (USD Million)
Table 20 U.S. water-cooled market estimates and forecasts by capacity, 2021 – 2033 (USD Million)
Table 21 U.S. market estimates and forecasts by application, 2021 – 2033 (USD Million)
Table 22 U.S. commercial chiller market estimates and forecasts by application, 2021 – 2033 (USD Million)
Table 23 U.S. industrial chiller market estimates and forecasts by application, 2021 – 2033 (USD Million)
Table 24 U.S. market estimates and forecasts by compressor, 2021 – 2033 (USD Million)
Table 25 Canada market estimates and forecasts by product, 2021 – 2033 (USD Million)
Table 26 Canada air-cooled market estimates and forecasts by capacity, 2021 – 2033 (USD Million)
Table 27 Canada water-cooled market estimates and forecasts by capacity, 2021 – 2033 (USD Million)
Table 28 Canada market estimates and forecasts by application, 2021 – 2033 (USD Million)
Table 29 Canada commercial chiller market estimates and forecasts by application, 2021 – 2033 (USD Million)
Table 30 Canada industrial chiller market estimates and forecasts by application, 2021 – 2033 (USD Million)
Table 31 Canada market estimates and forecasts by compressor, 2021 – 2033 (USD Million)
Table 32 Mexico market estimates and forecasts by product, 2021 – 2033 (USD Million)
Table 33 Mexico air-cooled market estimates and forecasts by capacity, 2021 – 2033 (USD Million)
Table 34 Mexico water-cooled market estimates and forecasts by capacity, 2021 – 2033 (USD Million)
Table 35 Mexico market estimates and forecasts by application, 2021 – 2033 (USD Million)
Table 36 Mexico commercial chiller market estimates and forecasts by application, 2021 – 2033 (USD Million)
Table 37 Mexico industrial chiller market estimates and forecasts by application, 2021 – 2033 (USD Million)
Table 38 Mexico market estimates and forecasts by compressor, 2021 – 2033 (USD Million)
Table 39 Europe market estimates and forecasts by product, 2021 – 2033 (USD Million)
Table 40 Europe air-cooled market estimates and forecasts by capacity, 2021 – 2033 (USD Million)
Table 41 Europe water-cooled market estimates and forecasts by capacity, 2021 – 2033 (USD Million)
Table 42 Europe market estimates and forecasts by application, 2021 – 2033 (USD Million)
Table 43 Europe commercial chiller market estimates and forecasts by application, 2021 – 2033 (USD Million)
Table 44 Europe industrial chiller market estimates and forecasts by application, 2021 – 2033 (USD Million)
Table 45 Europe market estimates and forecasts by compressor, 2021 – 2033 (USD Million)
Table 46 Germany market estimates and forecasts by product, 2021 – 2033 (USD Million)
Table 47 Germany air-cooled market estimates and forecasts by capacity, 2021 – 2033 (USD Million)
Table 48 Germany water-cooled market estimates and forecasts by capacity, 2021 – 2033 (USD Million)
Table 49 Germany market estimates and forecasts by application, 2021 – 2033 (USD Million)
Table 50 Germany commercial chiller market estimates and forecasts by application, 2021 – 2033 (USD Million)
Table 51 Germany industrial chiller market estimates and forecasts by application, 2021 – 2033 (USD Million)
Table 52 Germany market estimates and forecasts by compressor, 2021 – 2033 (USD Million)
Table 53 UK market estimates and forecasts by product, 2021 – 2033 (USD Million)
Table 54 UK air-cooled market estimates and forecasts by capacity, 2021 – 2033 (USD Million)
Table 55 UK water-cooled market estimates and forecasts by capacity, 2021 – 2033 (USD Million)
Table 56 UK market estimates and forecasts by application, 2021 – 2033 (USD Million)
Table 57 UK commercial chiller market estimates and forecasts by application, 2021 – 2033 (USD Million)
Table 58 UK industrial chiller market estimates and forecasts by application, 2021 – 2033 (USD Million)
Table 59 UK market estimates and forecasts by compressor, 2021 – 2033 (USD Million)
Table 60 France market estimates and forecasts by product, 2021 – 2033 (USD Million)
Table 61 France air-cooled market estimates and forecasts by capacity, 2021 – 2033 (USD Million)
Table 62 France water-cooled market estimates and forecasts by capacity, 2021 – 2033 (USD Million)
Table 63 France market estimates and forecasts by application, 2021 – 2033 (USD Million)
Table 64 France commercial chiller market estimates and forecasts by application, 2021 – 2033 (USD Million)
Table 65 France industrial chiller market estimates and forecasts by application, 2021 – 2033 (USD Million)
Table 66 France market estimates and forecasts by compressor, 2021 – 2033 (USD Million)
Table 67 Italy market estimates and forecasts by product, 2021 – 2033 (USD Million)
Table 68 Italy air-cooled market estimates and forecasts by capacity, 2021 – 2033 (USD Million)
Table 69 Italy water-cooled market estimates and forecasts by capacity, 2021 – 2033 (USD Million)
Table 70 Italy market estimates and forecasts by application, 2021 – 2033 (USD Million)
Table 71 Italy commercial chiller market estimates and forecasts by application, 2021 – 2033 (USD Million)
Table 72 Italy industrial chiller market estimates and forecasts by application, 2021 – 2033 (USD Million)
Table 73 Italy market estimates and forecasts by compressor, 2021 – 2033 (USD Million)
Table 74 Spain market estimates and forecasts by product, 2021 – 2033 (USD Million)
Table 75 Spain air-cooled market estimates and forecasts by capacity, 2021 – 2033 (USD Million)
Table 76 Spain water-cooled market estimates and forecasts by capacity, 2021 – 2033 (USD Million)
Table 77 Spain market estimates and forecasts by application, 2021 – 2033 (USD Million)
Table 78 Spain commercial chiller market estimates and forecasts by application, 2021 – 2033 (USD Million)
Table 79 Spain industrial chiller market estimates and forecasts by application, 2021 – 2033 (USD Million)
Table 80 Spain market estimates and forecasts by compressor, 2021 – 2033 (USD Million)
Table 81 Russia market estimates and forecasts by product, 2021 – 2033 (USD Million)
Table 82 Russia air-cooled market estimates and forecasts by capacity, 2021 – 2033 (USD Million)
Table 83 Russia water-cooled market estimates and forecasts by capacity, 2021 – 2033 (USD Million)
Table 84 Russia market estimates and forecasts by application, 2021 – 2033 (USD Million)
Table 85 Russia commercial chiller market estimates and forecasts by application, 2021 – 2033 (USD Million)
Table 86 Russia industrial chiller market estimates and forecasts by application, 2021 – 2033 (USD Million)
Table 87 Russia market estimates and forecasts by compressor, 2021 – 2033 (USD Million)
Table 88 Asia Pacific market estimates and forecasts by product, 2021 – 2033 (USD Million)
Table 89 Asia Pacific air-cooled market estimates and forecasts by capacity, 2021 – 2033 (USD Million)
Table 90 Asia Pacific water-cooled market estimates and forecasts by capacity, 2021 – 2033 (USD Million)
Table 91 Asia Pacific market estimates and forecasts by application, 2021 – 2033 (USD Million)
Table 92 Asia Pacific commercial chiller market estimates and forecasts by application, 2021 – 2033 (USD Million)
Table 93 Asia Pacific industrial chiller market estimates and forecasts by application, 2021 – 2033 (USD Million)
Table 94 Asia Pacific market estimates and forecasts by compressor, 2021 – 2033 (USD Million)
Table 95 China market estimates and forecasts by product, 2021 – 2033 (USD Million)
Table 96 China air-cooled market estimates and forecasts by capacity, 2021 – 2033 (USD Million)
Table 97 China water-cooled market estimates and forecasts by capacity, 2021 – 2033 (USD Million)
Table 98 China market estimates and forecasts by application, 2021 – 2033 (USD Million)
Table 99 China commercial chiller market estimates and forecasts by application, 2021 – 2033 (USD Million)
Table 100 China industrial chiller market estimates and forecasts by application, 2021 – 2033 (USD Million)
Table 101 China market estimates and forecasts by compressor, 2021 – 2033 (USD Million)
Table 102 India market estimates and forecasts by product, 2021 – 2033 (USD Million)
Table 103 India air-cooled market estimates and forecasts by capacity, 2021 – 2033 (USD Million)
Table 104 India water-cooled market estimates and forecasts by capacity, 2021 – 2033 (USD Million)
Table 105 India market estimates and forecasts by application, 2021 – 2033 (USD Million)
Table 106 India commercial chiller market estimates and forecasts by application, 2021 – 2033 (USD Million)
Table 107 India industrial chiller market estimates and forecasts by application, 2021 – 2033 (USD Million)
Table 108 India market estimates and forecasts by compressor, 2021 – 2033 (USD Million)
Table 109 Japan market estimates and forecasts by product, 2021 – 2033 (USD Million)
Table 110 Japan air-cooled market estimates and forecasts by capacity, 2021 – 2033 (USD Million)
Table 111 Japan water-cooled market estimates and forecasts by capacity, 2021 – 2033 (USD Million)
Table 112 Japan market estimates and forecasts by application, 2021 – 2033 (USD Million)
Table 113 Japan commercial chiller market estimates and forecasts by application, 2021 – 2033 (USD Million)
Table 114 Japan industrial chiller market estimates and forecasts by application, 2021 – 2033 (USD Million)
Table 115 Japan market estimates and forecasts by compressor, 2021 – 2033 (USD Million)
Table 116 Australia market estimates and forecasts by product, 2021 – 2033 (USD Million)
Table 117 Australia air-cooled market estimates and forecasts by capacity, 2021 – 2033 (USD Million)
Table 118 Australia water-cooled market estimates and forecasts by capacity, 2021 – 2033 (USD Million)
Table 119 Australia market estimates and forecasts by application, 2021 – 2033 (USD Million)
Table 120 Australia commercial chiller market estimates and forecasts by application, 2021 – 2033 (USD Million)
Table 121 Australia industrial chiller market estimates and forecasts by application, 2021 – 2033 (USD Million)
Table 122 Australia market estimates and forecasts by compressor, 2021 – 2033 (USD Million)
Table 123 Thailand market estimates and forecasts by product, 2021 – 2033 (USD Million)
Table 124 Thailand air-cooled market estimates and forecasts by capacity, 2021 – 2033 (USD Million)
Table 125 Thailand water-cooled market estimates and forecasts by capacity, 2021 – 2033 (USD Million)
Table 126 Thailand market estimates and forecasts by application, 2021 – 2033 (USD Million)
Table 127 Thailand commercial chiller market estimates and forecasts by application, 2021 – 2033 (USD Million)
Table 128 Thailand industrial chiller market estimates and forecasts by application, 2021 – 2033 (USD Million)
Table 129 Thailand market estimates and forecasts by compressor, 2021 – 2033 (USD Million)
Table 130 South Korea market estimates and forecasts by product, 2021 – 2033 (USD Million)
Table 131 South Korea air-cooled market estimates and forecasts by capacity, 2021 – 2033 (USD Million)
Table 132 South Korea water-cooled market estimates and forecasts by capacity, 2021 – 2033 (USD Million)
Table 133 South Korea market estimates and forecasts by application, 2021 – 2033 (USD Million)
Table 134 South Korea commercial chiller market estimates and forecasts by application, 2021 – 2033 (USD Million)
Table 135 South Korea industrial chiller market estimates and forecasts by application, 2021 – 2033 (USD Million)
Table 136 South Korea market estimates and forecasts by compressor, 2021 – 2033 (USD Million)
Table 137 Indonesia market estimates and forecasts by product, 2021 – 2033 (USD Million)
Table 138 Indonesia air-cooled market estimates and forecasts by capacity, 2021 – 2033 (USD Million)
Table 139 Indonesia water-cooled market estimates and forecasts by capacity, 2021 – 2033 (USD Million)
Table 140 Indonesia market estimates and forecasts by application, 2021 – 2033 (USD Million)
Table 141 Indonesia commercial chiller market estimates and forecasts by application, 2021 – 2033 (USD Million)
Table 142 Indonesia industrial chiller market estimates and forecasts by application, 2021 – 2033 (USD Million)
Table 143 Indonesia market estimates and forecasts by compressor, 2021 – 2033 (USD Million)
Table 144 Malaysia market estimates and forecasts by product, 2021 – 2033 (USD Million)
Table 145 Malaysia air-cooled market estimates and forecasts by capacity, 2021 – 2033 (USD Million)
Table 146 Malaysia water-cooled market estimates and forecasts by capacity, 2021 – 2033 (USD Million)
Table 147 Malaysia market estimates and forecasts by application, 2021 – 2033 (USD Million)
Table 148 Malaysia commercial chiller market estimates and forecasts by application, 2021 – 2033 (USD Million)
Table 149 Malaysia industrial chiller market estimates and forecasts by application, 2021 – 2033 (USD Million)
Table 150 Malaysia market estimates and forecasts by compressor, 2021 – 2033 (USD Million)
Table 151 Central & South America market estimates and forecasts by product, 2021 – 2033 (USD Million)
Table 152 Central & South America air-cooled market estimates and forecasts by capacity, 2021 – 2033 (USD Million)
Table 153 Central & South America water-cooled market estimates and forecasts by capacity, 2021 – 2033 (USD Million)
Table 154 Central & South America market estimates and forecasts by application, 2021 – 2033 (USD Million)
Table 155 Central & South America commercial chiller market estimates and forecasts by application, 2021 – 2033 (USD Million)
Table 156 Central & South America industrial chiller market estimates and forecasts by application, 2021 – 2033 (USD Million)
Table 157 Central & South America market estimates and forecasts by compressor, 2021 – 2033 (USD Million)
Table 158 Brazil market estimates and forecasts by product, 2021 – 2033 (USD Million)
Table 159 Brazil air-cooled market estimates and forecasts by capacity, 2021 – 2033 (USD Million)
Table 160 Brazil water-cooled market estimates and forecasts by capacity, 2021 – 2033 (USD Million)
Table 161 Brazil market estimates and forecasts by application, 2021 – 2033 (USD Million)
Table 162 Brazil commercial chiller market estimates and forecasts by application, 2021 – 2033 (USD Million)
Table 163 Brazil industrial chiller market estimates and forecasts by application, 2021 – 2033 (USD Million)
Table 164 Brazil market estimates and forecasts by compressor, 2021 – 2033 (USD Million)
Table 165 Argentina market estimates and forecasts by product, 2021 – 2033 (USD Million)
Table 166 Argentina air-cooled market estimates and forecasts by capacity, 2021 – 2033 (USD Million)
Table 167 Argentina water-cooled market estimates and forecasts by capacity, 2021 – 2033 (USD Million)
Table 168 Argentina market estimates and forecasts by application, 2021 – 2033 (USD Million)
Table 169 Argentina commercial chiller market estimates and forecasts by application, 2021 – 2033 (USD Million)
Table 170 Argentina industrial chiller market estimates and forecasts by application, 2021 – 2033 (USD Million)
Table 171 Argentina market estimates and forecasts by compressor, 2021 – 2033 (USD Million)
Table 172 Middle East & Africa market estimates and forecasts by product, 2021 – 2033 (USD Million)
Table 173 Middle East & Africa air-cooled market estimates and forecasts by capacity, 2021 – 2033 (USD Million)
Table 174 Middle East & Africa water-cooled market estimates and forecasts by capacity, 2021 – 2033 (USD Million)
Table 175 Middle East & Africa market estimates and forecasts by application, 2021 – 2033 (USD Million)
Table 176 Middle East & Africa commercial chiller market estimates and forecasts by application, 2021 – 2033 (USD Million)
Table 177 Middle East & Africa industrial chiller market estimates and forecasts by application, 2021 – 2033 (USD Million)
Table 178 Middle East & Africa market estimates and forecasts by compressor, 2021 – 2033 (USD Million)
Table 179 Saudi Arabia market estimates and forecasts by product, 2021 – 2033 (USD Million)
Table 180 Saudi Arabia air-cooled market estimates and forecasts by capacity, 2021 – 2033 (USD Million)
Table 181 Saudi Arabia water-cooled market estimates and forecasts by capacity, 2021 – 2033 (USD Million)
Table 182 Saudi Arabia market estimates and forecasts by application, 2021 – 2033 (USD Million)
Table 183 Saudi Arabia commercial chiller market estimates and forecasts by application, 2021 – 2033 (USD Million)
Table 184 Saudi Arabia industrial chiller market estimates and forecasts by application, 2021 – 2033 (USD Million)
Table 185 Saudi Arabia market estimates and forecasts by compressor, 2021 – 2033 (USD Million)
Table 186 South Africa market estimates and forecasts by product, 2021 – 2033 (USD Million)
Table 187 South Africa air-cooled market estimates and forecasts by capacity, 2021 – 2033 (USD Million)
Table 188 South Africa water-cooled market estimates and forecasts by capacity, 2021 – 2033 (USD Million)
Table 189 South Africa market estimates and forecasts by application, 2021 – 2033 (USD Million)
Table 190 South Africa commercial chiller market estimates and forecasts by application, 2021 – 2033 (USD Million)
Table 191 South Africa industrial chiller market estimates and forecasts by application, 2021 – 2033 (USD Million)
Table 192 South Africa market estimates and forecasts by compressor, 2021 – 2033 (USD Million)
Table 193 UAE market estimates and forecasts by product, 2021 – 2033 (USD Million)
Table 194 UAE air-cooled market estimates and forecasts by capacity, 2021 – 2033 (USD Million)
Table 195 UAE water-cooled market estimates and forecasts by capacity, 2021 – 2033 (USD Million)
Table 196 UAE market estimates and forecasts by application, 2021 – 2033 (USD Million)
Table 197 UAE commercial chiller market estimates and forecasts by application, 2021 – 2033 (USD Million)
Table 198 UAE industrial chiller market estimates and forecasts by application, 2021 – 2033 (USD Million)
Table 199 UAE market estimates and forecasts by compressor, 2021 – 2033 (USD Million)
List of Figures
Fig. 1 Market research process
Fig. 2 Data triangulation techniques
Fig. 3 Primary research pattern
Fig. 4 Market research approaches
Fig. 5 QFD modeling for market share assessment
Fig. 6 Information Procurement
Fig. 7 Market Formulation and Validation
Fig. 8 Data Validating & Publishing
Fig. 9 Market Segmentation & Scope
Fig. 10 Chillers Market Snapshot
Fig. 11 Segment Snapshot
Fig. 12 Competitive Landscape Snapshot
Fig. 13 Parent market outlook
Fig. 14 Chillers Market Value, 2025 (USD Million)
Fig. 15 Chillers Market – Value Chain Analysis
Fig. 16 Chillers Market – Market Dynamics
Fig. 17 Chillers Market – PORTER’s Analysis
Fig. 18 Chillers Market – PESTEL Analysis
Fig. 19 Chillers Market Estimates & Forecasts, By Product: Key Takeaways
Fig. 20 Chillers Market Share, By Product, 2025 & 2033
Fig. 21 Water-Cooled Chillers Market Estimates & Forecasts, 2021 – 2033 (USD Million)
Fig. 22 <50kW market estimates and forecasts, in water-cooled 2021 – 2033
Fig. 23 51-100kW market estimates and forecasts, in water-cooled 2021 – 2033
Fig. 24 101-500kW market estimates and forecasts, in water-cooled 2021 – 2033
Fig. 25 501-1000kW market estimates and forecasts, in water-cooled 2021 – 2033
Fig. 26 1001-1500kW market estimates and forecasts, in water-cooled 2021 – 2033
Fig. 27 >1501 market estimates and forecasts, in water-cooled 2021 – 2033
Fig. 28 Air-Cooled Chillers Market Estimates & Forecasts, 2021 – 2033 (USD Million)
Fig. 29 <50kW market estimates and forecasts, in air-cooled 2021 – 2033
Fig. 30 51-100kW market estimates and forecasts, in air -cooled 2021 – 2033
Fig. 31 101-500kW market estimates and forecasts, in air -cooled 2021 – 2033
Fig. 32 501-1000kW market estimates and forecasts, in air -cooled 2021 – 2033
Fig. 33 1001-1500kW market estimates and forecasts, in air -cooled 2021 – 2033
Fig. 34 >1501 market estimates and forecasts, in air -cooled 2021 – 2033
Fig. 35 Commercial Chillers Market Estimates & Forecasts, 2021 – 2033 (USD Million)
Fig. 36 Corporate offices market estimates and forecasts, 2021 – 2033
Fig. 37 Data centers market estimates and forecasts, 2021 – 2033
Fig. 38 Public buildings market estimates and forecasts, 2021 – 2033
Fig. 39 Mercantile & service market estimates and forecasts, 2021 – 2033
Fig. 40 Healthcare market estimates and forecasts, 2021 – 2033
Fig. 41 Others market estimates and forecasts, 2021 – 2033
Fig. 42 Industrial Chillers Market Estimates & Forecasts, 2021 – 2033 (USD Million)
Fig. 43 Chemicals & petrochemicals market estimates and forecasts, 2021 – 2033
Fig. 44 Food & beverages market estimates and forecasts, 2021 – 2033
Fig. 45 Metal manufacturing & machining market estimates and forecasts, 2021 – 2033
Fig. 46 Medical & pharmaceuticals market estimates and forecasts, 2021 – 2033
Fig. 47 Plastics market estimates and forecasts, 2021 – 2033
Fig. 48 Others market estimates and forecasts, 2021 – 2033
Fig. 49 Screw chillers surgeries market estimates and forecasts, 2021 – 2033
Fig. 50 Centrifugal chillers market estimates and forecasts, 2021 – 2033
Fig. 51 Absorption chillers market estimates and forecasts, 2021 – 2033
Fig. 52 Scroll chillers market estimates and forecasts, 2021 – 2033
Fig. 53 Reciprocating chillers market estimates and forecasts, 2021 – 2033
Fig. 54 Residential Chillers Market Estimates & Forecasts, 2021 – 2033 (USD Million)
Fig. 55 North America Chillers Market Estimates & Forecasts, 2021 – 2033 (USD Million)
Fig. 56 U.S. Chillers Market Estimates & Forecasts, 2021 – 2033 (USD Million)
Fig. 57 Canada Chillers Market Estimates & Forecasts, 2021 – 2033 (USD Million)
Fig. 58 Mexico Chillers Market Estimates & Forecasts, 2021 – 2033 (USD Million)
Fig. 59 Europe Chillers Market Estimates & Forecasts, 2021 – 2033 (USD Million)
Fig. 60 Germany Chillers Market Estimates & Forecasts, 2021 – 2033 (USD Million)
Fig. 61 France Chillers Market Estimates & Forecasts, 2021 – 2033 (USD Million)
Fig. 62 UK Chillers Market Estimates & Forecasts, 2021 – 2033 (USD Million)
Fig. 63 Italy Chillers Market Estimates & Forecasts, 2021 – 2033 (USD Million)
Fig. 64 Spain Chillers Market Estimates & Forecasts, 2021 – 2033 (USD Million)
Fig. 65 Russia Chillers Market Estimates & Forecasts, 2021 – 2033 (USD Million)
Fig. 66 Asia Pacific Chillers Market Estimates & Forecasts, 2021 – 2033 (USD Million)
Fig. 67 China Chillers Market Estimates & Forecasts, 2021 – 2033 (USD Million)
Fig. 68 Japan Chillers Market Estimates & Forecasts, 2021 – 2033 (USD Million)
Fig. 69 India Chillers Market Estimates & Forecasts, 2021 – 2033 (USD Million)
Fig. 70 Australia Chillers Market Estimates & Forecasts, 2021 – 2033 (USD Million)
Fig. 71 Thailand Chillers Market Estimates & Forecasts, 2021 – 2033 (USD Million)
Fig. 72 South Korea Chillers Market Estimates & Forecasts, 2021 – 2033 (USD Million)
Fig. 73 Indonesia Chillers Market Estimates & Forecasts, 2021 – 2033 (USD Million)
Fig. 74 Malaysia Chillers Market Estimates & Forecasts, 2021 – 2033 (USD Million)
Fig. 75 Central & South America Chillers Market Estimates & Forecasts, 2021 – 2033 (USD Million)
Fig. 76 Brazil Chillers Market Estimates & Forecasts, 2021 – 2033 (USD Million)
Fig. 77 Argentina Chillers Market Estimates & Forecasts, 2021 – 2033 (USD Million)
Fig. 78 Middle East & Africa Chillers Market Estimates & Forecasts, 2021 – 2033 (USD Million)
Fig. 79 Saudi Arabia Chillers Market Estimates & Forecasts, 2021 – 2033 (USD Million)
Fig. 80 South Africa Chillers Market Estimates & Forecasts, 2021 – 2033 (USD Million)
Fig. 81 UAE Chillers Market Estimates & Forecasts, 2021 – 2033 (USD Million)
Fig. 82 Key Company Categorization
Fig. 83 Company Market Positioning
Fig. 84 Key Company Market Share Analysis, 2024
Fig. 85 Strategy Mapping