Scintillator Market : Global Opportunity Analysis and Industry Forecast, 2025-2034
Scintillator Market By Material Composition (Inorganic Scintillator, Organic Scintillator), By Product Type (Pocket Size Instruments, Hand-Held instruments, Fixed, Installed, Automatic Instruments), By Industry Vertical (Industrial, Aerospace and Defense, Energy and Power, Healthcare, Others): Global Opportunity Analysis and Industry Forecast, 2025-2034
シンチレータ市場 - 材料構成(無機シンチレータ、有機シンチレータ)、製品タイプ別(ポケットサイズ機器、携帯型機器、固定式、設置型、自動機器)、業界別(工業、航空宇宙・防衛、エネルギー・電力、ヘルスケア、その他):機会分析と業界予測、2025年-2034年
| 出版 | Allied Market Research |
| 出版年月 | 2025年08月 |
| ページ数 | 300 |
| 価格 | 記載以外のライセンスについてはお問合せください |
| シングルユーザ | USD 4,155 |
| 種別 | 英文調査報告書 |
| 商品番号 | SMR-1204412044 |

シンチレータ市場とは、電離放射線にさらされると発光するシンチレータ材料の開発、製造、応用を中心とした世界的な産業を指します。これらの材料は、医療用画像、原子力、国土安全保障、素粒子物理学、産業検査など、様々な分野における放射線の検出と測定に不可欠です。シンチレータは、結晶、プラスチック、液体など様々な形態で提供され、PETスキャナ、ガンマカメラ、放射線検出器などの機器の主要部品となっています。材料科学の進歩と、高解像度・高感度の放射線検出に対する需要の急増が、この市場を大きく形成しています。
シンチレータ市場の成長を牽引しているのは、核医学の利用拡大や医療における放射線利用技術の導入拡大といった要因です。原子力発電所の拡張や国境を越えた安全保障上の懸念の高まりは、放射線検出・モニタリング装置の需要急増につながっています。さらに、LYSOやLaBr₃といった高性能シンチレーション結晶の開発を含む急速な技術進歩は、画像品質と検出器効率の向上を支え、市場への導入を促進しています。高エネルギー物理学および天文学における研究活動の拡大は、高精度シンチレーション材料の需要を押し上げています。
しかし、セリウムドープ結晶などのプレミアムシンチレータは、製造コストと材料コストの高さが、特にコスト重視の用途において、広範な導入の障壁となっています。製造プロセスの複雑さと希土類材料の入手性不足も、市場拡大のさらなる制約となっています。さらに、シンチレータの性能の経年劣化、環境条件への敏感さ、定期的な校正の必要性といった運用上の課題により、長期使用が制限され、メンテナンスの必要性が増大します。
Report Description
The scintillator market refers to the global industry centered around the development, manufacturing, and application of scintillating materials that emit light when exposed to ionizing radiation. These materials are vital for detecting and measuring radiation in various sectors including medical imaging, nuclear power, homeland security, particle physics, and industrial inspection. Scintillators come in different forms such as crystals, plastics, and liquids, and are key components in devices such as PET scanners, gamma cameras, and radiation detectors. Advancements in material science and surge in demand for high-resolution and high-sensitivity radiation detection are significantly shaping this market.
Factors such as increase in utilization of nuclear medicine and rise in adoption of radiation-based technologies in healthcare drive the growth of the scintillator market. The expansion of nuclear power generation facilities and heightened security concerns across borders have led to a surge in demand for radiation detection and monitoring devices. Furthermore, rapid technological advancements, including the development of high-performance scintillation crystals such as LYSO and LaBr₃, support improved imaging quality and detector efficiency, thereby boosting market adoption. Growth in research activities in high-energy physics and astronomy propels demand for precision scintillation materials.
However, high production and material costs associated with premium scintillators such as cerium-doped crystals act as a barrier to widespread adoption, particularly in cost-sensitive applications. The complexity of manufacturing processes and limited availability of rare earth materials further restrain market expansion. In addition, operational challenges such as the degradation of scintillator performance over time, sensitivity to environmental conditions, and the need for regular calibration limit long-term usage and increase maintenance requirements.
On the other hand, rise in investments in next-generation medical diagnostic tools and the development of compact, portable radiation detectors offer new growth avenues for the scintillator market. Innovations in hybrid scintillation materials, nanocomposite technologies, and digital signal processing are expected to enhance performance while reducing costs. In addition, the growing use of scintillators in space exploration, environmental monitoring, and industrial safety is opening up untapped market opportunities. Expansion into emerging markets in Asia-Pacific and Latin America, coupled with government initiatives to strengthen radiation safety infrastructure, presents lucrative potential for future growth. For instance, in November 2023, Mirion Technologies signed an agreement with TerraPower to design and supply nuclear instrumentation systems for the Molten Chloride Reactor Experiment (MCRE), reinforcing its role in advanced reactor detection systems.
Segment Review
The scintillator market is segmented on the basis of material composition, product type, industry vertical, and region. On the basis of material composition, the market is divided into inorganic scintillator, and organic scintillator. By product type, it is classified into pocket size instrument, hand-held instrument, fixed, installed, and automatic instrument. On the basis of industry vertical, it is categorized into industrial, aerospace & defense, energy & power, healthcare, and others. Region-wise, it is studied across North America, Europe, Asia-Pacific, and LAMEA.
Key Findings
- On the basis of material composition, the inorganic scintillator segment acquired the highest market share in 2024.
- On the basis of product type, the hand-held instrument segment acquired the highest market share in 2024.
- By industry vertical, the healthcare segment attained the highest market share in 2024.
- Region-wise, North America attained the highest market share in 2024.
Competition Analysis
The report analyzes the profiles of key players operating in the scintillator market such as Saint Gobain, Mirion Technologies, Hitachi Metals Ltd, Canberra Industries Inc., Ludlum Measurements, Zecotek Photonics, Hamamatsu Photonics, TLD Systems., Argus Imaging Inc., and Applied Scintillation Technologies. These players have adopted various strategies to increase their market penetration and strengthen their position in the scintillator market.
Key Benefits For Stakeholders
- This report provides a quantitative analysis of the market segments, current trends, estimations, and dynamics of the scintillator market analysis from 2024 to 2034 to identify the prevailing scintillator market opportunities.
- The market research is offered along with information related to key drivers, restraints, and opportunities.
- Porter’s five forces analysis highlights the potency of buyers and suppliers to enable stakeholders make profit-oriented business decisions and strengthen their supplier-buyer network.
- In-depth analysis of the scintillator market segmentation assists to determine the prevailing market opportunities.
- Major countries in each region are mapped according to their revenue contribution to the global market.
- Market player positioning facilitates benchmarking and provides a clear understanding of the present position of the market players.
- The report includes the analysis of the regional as well as global scintillator market trends, key players, market segments, application areas, and market growth strategies.
Additional benefits you will get with this purchase are:
- Quarterly Update and* (only available with a corporate license, on listed price)
- 5 additional Company Profile of client Choice pre- or Post-purchase, as a free update.
- Free Upcoming Version on the Purchase of Five and Enterprise User License.
- 16 analyst hours of support* (post-purchase, if you find additional data requirements upon review of the report, you may receive support amounting to 16 analyst hours to solve questions, and post-sale queries)
- 15% Free Customization* (in case the scope or segment of the report does not match your requirements, 15% is equivalent to 3 working days of free work, applicable once)
- Free data Pack on the Five and Enterprise User License. (Excel version of the report)
- Free Updated report if the report is 6-12 months old or older.
- 24-hour priority response*
- Free Industry updates and white papers.
Possible Customization with this report (with additional cost and timeline, please talk to the sales executive to know more)
- End user preferences and pain points
- Go To Market Strategy
- Brands Share Analysis
Scintillator Market Report Highlights
| Aspects | Details |
|
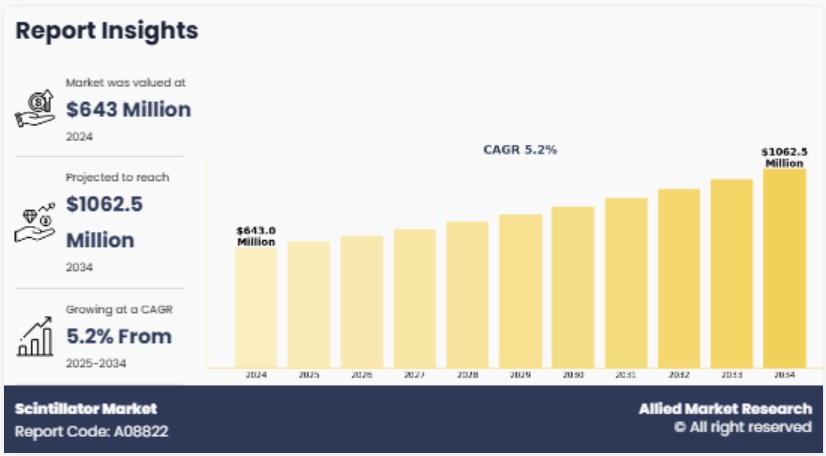
Market Size By 2034
|
USD 1062.5 million |
|
Growth Rate
|
CAGR of 5.2% |
|
Forecast period
|
2024 – 2034 |
|
Report Pages
|
300 |
|
By Material Composition
|
|
|
By Product Type
|
|
|
By Industry Vertical
|
|
|
By Region
|
|
|
Key Market Players
|
Dynasil Corporation, Luxium Solutions (formerly Saint-Gobain Crystals), hamamatsu photonics K.K., Epic Crystal Co.,Ltd, Scintacor, Alpha Spectra, Inc., NIHON KESSHO KOGAKU CO., LTD., Eljen Technology, Proterial, Ltd. (Hitachi Metals, Ltd.), Kinheng Crystal Material (Shanghai) Co., Ltd. |
Table of Content
CHAPTER 1: INTRODUCTION
1.1. Report description
1.2. Key market segments
1.3. Key benefits to the stakeholders
1.4. Research methodology
1.4.1. Primary research
1.4.2. Secondary research
1.4.3. Analyst tools and models
CHAPTER 2: EXECUTIVE SUMMARY
2.1. CXO perspective
CHAPTER 3: MARKET OVERVIEW
3.1. Market definition and scope
3.2. Key findings
3.2.1. Top impacting factors
3.2.2. Top investment pockets
3.3. Porter’s five forces analysis
3.4. Market dynamics
3.4.1. Drivers
3.4.2. Restraints
3.4.3. Opportunities
CHAPTER 4: SCINTILLATOR MARKET, BY MATERIAL COMPOSITION
4.1. Overview
4.1.1. Market size and forecast
4.2. Inorganic Scintillator
4.2.1. Key market trends, growth factors and opportunities
4.2.2. Market size and forecast, by region
4.2.3. Market share analysis by country
4.3. Organic Scintillator
4.3.1. Key market trends, growth factors and opportunities
4.3.2. Market size and forecast, by region
4.3.3. Market share analysis by country
CHAPTER 5: SCINTILLATOR MARKET, BY PRODUCT TYPE
5.1. Overview
5.1.1. Market size and forecast
5.2. Pocket Size Instruments
5.2.1. Key market trends, growth factors and opportunities
5.2.2. Market size and forecast, by region
5.2.3. Market share analysis by country
5.3. Hand-Held instruments
5.3.1. Key market trends, growth factors and opportunities
5.3.2. Market size and forecast, by region
5.3.3. Market share analysis by country
5.4. Fixed
5.4.1. Key market trends, growth factors and opportunities
5.4.2. Market size and forecast, by region
5.4.3. Market share analysis by country
5.5. Installed
5.5.1. Key market trends, growth factors and opportunities
5.5.2. Market size and forecast, by region
5.5.3. Market share analysis by country
5.6. Automatic Instruments
5.6.1. Key market trends, growth factors and opportunities
5.6.2. Market size and forecast, by region
5.6.3. Market share analysis by country
CHAPTER 6: SCINTILLATOR MARKET, BY INDUSTRY VERTICAL
6.1. Overview
6.1.1. Market size and forecast
6.2. Industrial
6.2.1. Key market trends, growth factors and opportunities
6.2.2. Market size and forecast, by region
6.2.3. Market share analysis by country
6.3. Aerospace and Defense
6.3.1. Key market trends, growth factors and opportunities
6.3.2. Market size and forecast, by region
6.3.3. Market share analysis by country
6.4. Energy and Power
6.4.1. Key market trends, growth factors and opportunities
6.4.2. Market size and forecast, by region
6.4.3. Market share analysis by country
6.5. Healthcare
6.5.1. Key market trends, growth factors and opportunities
6.5.2. Market size and forecast, by region
6.5.3. Market share analysis by country
6.6. Others
6.6.1. Key market trends, growth factors and opportunities
6.6.2. Market size and forecast, by region
6.6.3. Market share analysis by country
CHAPTER 7: SCINTILLATOR MARKET, BY REGION
7.1. Overview
7.1.1. Market size and forecast By Region
7.2. North America
7.2.1. Key market trends, growth factors and opportunities
7.2.2. Market size and forecast, by Material Composition
7.2.3. Market size and forecast, by Product Type
7.2.4. Market size and forecast, by Industry Vertical
7.2.5. Market size and forecast, by country
7.2.5.1. U.S.
7.2.5.1.1. Market size and forecast, by Material Composition
7.2.5.1.2. Market size and forecast, by Product Type
7.2.5.1.3. Market size and forecast, by Industry Vertical
7.2.5.2. Canada
7.2.5.2.1. Market size and forecast, by Material Composition
7.2.5.2.2. Market size and forecast, by Product Type
7.2.5.2.3. Market size and forecast, by Industry Vertical
7.3. Europe
7.3.1. Key market trends, growth factors and opportunities
7.3.2. Market size and forecast, by Material Composition
7.3.3. Market size and forecast, by Product Type
7.3.4. Market size and forecast, by Industry Vertical
7.3.5. Market size and forecast, by country
7.3.5.1. Germany
7.3.5.1.1. Market size and forecast, by Material Composition
7.3.5.1.2. Market size and forecast, by Product Type
7.3.5.1.3. Market size and forecast, by Industry Vertical
7.3.5.2. UK
7.3.5.2.1. Market size and forecast, by Material Composition
7.3.5.2.2. Market size and forecast, by Product Type
7.3.5.2.3. Market size and forecast, by Industry Vertical
7.3.5.3. France
7.3.5.3.1. Market size and forecast, by Material Composition
7.3.5.3.2. Market size and forecast, by Product Type
7.3.5.3.3. Market size and forecast, by Industry Vertical
7.3.5.4. Russia
7.3.5.4.1. Market size and forecast, by Material Composition
7.3.5.4.2. Market size and forecast, by Product Type
7.3.5.4.3. Market size and forecast, by Industry Vertical
7.3.5.5. Rest of Europe
7.3.5.5.1. Market size and forecast, by Material Composition
7.3.5.5.2. Market size and forecast, by Product Type
7.3.5.5.3. Market size and forecast, by Industry Vertical
7.4. Asia-Pacific
7.4.1. Key market trends, growth factors and opportunities
7.4.2. Market size and forecast, by Material Composition
7.4.3. Market size and forecast, by Product Type
7.4.4. Market size and forecast, by Industry Vertical
7.4.5. Market size and forecast, by country
7.4.5.1. India
7.4.5.1.1. Market size and forecast, by Material Composition
7.4.5.1.2. Market size and forecast, by Product Type
7.4.5.1.3. Market size and forecast, by Industry Vertical
7.4.5.2. Japan
7.4.5.2.1. Market size and forecast, by Material Composition
7.4.5.2.2. Market size and forecast, by Product Type
7.4.5.2.3. Market size and forecast, by Industry Vertical
7.4.5.3. China
7.4.5.3.1. Market size and forecast, by Material Composition
7.4.5.3.2. Market size and forecast, by Product Type
7.4.5.3.3. Market size and forecast, by Industry Vertical
7.4.5.4. Rest of Asia-Pacific
7.4.5.4.1. Market size and forecast, by Material Composition
7.4.5.4.2. Market size and forecast, by Product Type
7.4.5.4.3. Market size and forecast, by Industry Vertical
7.5. LAMEA
7.5.1. Key market trends, growth factors and opportunities
7.5.2. Market size and forecast, by Material Composition
7.5.3. Market size and forecast, by Product Type
7.5.4. Market size and forecast, by Industry Vertical
7.5.5. Market size and forecast, by country
7.5.5.1. Latin America
7.5.5.1.1. Market size and forecast, by Material Composition
7.5.5.1.2. Market size and forecast, by Product Type
7.5.5.1.3. Market size and forecast, by Industry Vertical
7.5.5.2. Middle East
7.5.5.2.1. Market size and forecast, by Material Composition
7.5.5.2.2. Market size and forecast, by Product Type
7.5.5.2.3. Market size and forecast, by Industry Vertical
7.5.5.3. Africa
7.5.5.3.1. Market size and forecast, by Material Composition
7.5.5.3.2. Market size and forecast, by Product Type
7.5.5.3.3. Market size and forecast, by Industry Vertical
CHAPTER 8: COMPETITIVE LANDSCAPE
8.1. Introduction
8.2. Top winning strategies
8.3. Product mapping of top 10 player
8.4. Competitive dashboard
8.5. Competitive heatmap
8.6. Top player positioning, 2024
CHAPTER 9: COMPANY PROFILES
9.1. Luxium Solutions (formerly Saint-Gobain Crystals)
9.1.1. Company overview
9.1.2. Key executives
9.1.3. Company snapshot
9.1.4. Operating business segments
9.1.5. Product portfolio
9.1.6. Business performance
9.1.7. Key strategic moves and developments
9.2. hamamatsu photonics K.K.
9.2.1. Company overview
9.2.2. Key executives
9.2.3. Company snapshot
9.2.4. Operating business segments
9.2.5. Product portfolio
9.2.6. Business performance
9.2.7. Key strategic moves and developments
9.3. Scintacor
9.3.1. Company overview
9.3.2. Key executives
9.3.3. Company snapshot
9.3.4. Operating business segments
9.3.5. Product portfolio
9.3.6. Business performance
9.3.7. Key strategic moves and developments
9.4. Alpha Spectra, Inc.
9.4.1. Company overview
9.4.2. Key executives
9.4.3. Company snapshot
9.4.4. Operating business segments
9.4.5. Product portfolio
9.4.6. Business performance
9.4.7. Key strategic moves and developments
9.5. Eljen Technology
9.5.1. Company overview
9.5.2. Key executives
9.5.3. Company snapshot
9.5.4. Operating business segments
9.5.5. Product portfolio
9.5.6. Business performance
9.5.7. Key strategic moves and developments
9.6. Proterial, Ltd. (Hitachi Metals, Ltd.)
9.6.1. Company overview
9.6.2. Key executives
9.6.3. Company snapshot
9.6.4. Operating business segments
9.6.5. Product portfolio
9.6.6. Business performance
9.6.7. Key strategic moves and developments
9.7. Kinheng Crystal Material (Shanghai) Co., Ltd.
9.7.1. Company overview
9.7.2. Key executives
9.7.3. Company snapshot
9.7.4. Operating business segments
9.7.5. Product portfolio
9.7.6. Business performance
9.7.7. Key strategic moves and developments
9.8. Dynasil Corporation
9.8.1. Company overview
9.8.2. Key executives
9.8.3. Company snapshot
9.8.4. Operating business segments
9.8.5. Product portfolio
9.8.6. Business performance
9.8.7. Key strategic moves and developments
9.9. Epic Crystal Co.,Ltd
9.9.1. Company overview
9.9.2. Key executives
9.9.3. Company snapshot
9.9.4. Operating business segments
9.9.5. Product portfolio
9.9.6. Business performance
9.9.7. Key strategic moves and developments
9.10. NIHON KESSHO KOGAKU CO., LTD.
9.10.1. Company overview
9.10.2. Key executives
9.10.3. Company snapshot
9.10.4. Operating business segments
9.10.5. Product portfolio
9.10.6. Business performance
9.10.7. Key strategic moves and developments
LIST OF TABLES
TABLE 01. GLOBAL SCINTILLATOR MARKET, BY MATERIAL COMPOSITION, 2024-2034 ($THOUSAND)
TABLE 02. SCINTILLATOR MARKET FOR INORGANIC SCINTILLATOR, BY REGION, 2024-2034 ($THOUSAND)
TABLE 03. SCINTILLATOR MARKET FOR ORGANIC SCINTILLATOR, BY REGION, 2024-2034 ($THOUSAND)
TABLE 04. GLOBAL SCINTILLATOR MARKET, BY PRODUCT TYPE, 2024-2034 ($THOUSAND)
TABLE 05. SCINTILLATOR MARKET FOR POCKET SIZE INSTRUMENTS, BY REGION, 2024-2034 ($THOUSAND)
TABLE 06. SCINTILLATOR MARKET FOR HAND-HELD INSTRUMENTS, BY REGION, 2024-2034 ($THOUSAND)
TABLE 07. SCINTILLATOR MARKET FOR FIXED, BY REGION, 2024-2034 ($THOUSAND)
TABLE 08. SCINTILLATOR MARKET FOR INSTALLED, BY REGION, 2024-2034 ($THOUSAND)
TABLE 09. SCINTILLATOR MARKET FOR AUTOMATIC INSTRUMENTS, BY REGION, 2024-2034 ($THOUSAND)
TABLE 10. GLOBAL SCINTILLATOR MARKET, BY INDUSTRY VERTICAL, 2024-2034 ($THOUSAND)
TABLE 11. SCINTILLATOR MARKET FOR INDUSTRIAL, BY REGION, 2024-2034 ($THOUSAND)
TABLE 12. SCINTILLATOR MARKET FOR AEROSPACE AND DEFENSE, BY REGION, 2024-2034 ($THOUSAND)
TABLE 13. SCINTILLATOR MARKET FOR ENERGY AND POWER, BY REGION, 2024-2034 ($THOUSAND)
TABLE 14. SCINTILLATOR MARKET FOR HEALTHCARE, BY REGION, 2024-2034 ($THOUSAND)
TABLE 15. SCINTILLATOR MARKET FOR OTHERS, BY REGION, 2024-2034 ($THOUSAND)
TABLE 16. SCINTILLATOR MARKET, BY REGION, 2024-2034 ($THOUSAND)
TABLE 17. NORTH AMERICA SCINTILLATOR MARKET, BY MATERIAL COMPOSITION, 2024-2034 ($THOUSAND)
TABLE 18. NORTH AMERICA SCINTILLATOR MARKET, BY PRODUCT TYPE, 2024-2034 ($THOUSAND)
TABLE 19. NORTH AMERICA SCINTILLATOR MARKET, BY INDUSTRY VERTICAL, 2024-2034 ($THOUSAND)
TABLE 20. NORTH AMERICA SCINTILLATOR MARKET, BY COUNTRY, 2024-2034 ($THOUSAND)
TABLE 21. U.S. SCINTILLATOR MARKET, BY MATERIAL COMPOSITION, 2024-2034 ($THOUSAND)
TABLE 22. U.S. SCINTILLATOR MARKET, BY PRODUCT TYPE, 2024-2034 ($THOUSAND)
TABLE 23. U.S. SCINTILLATOR MARKET, BY INDUSTRY VERTICAL, 2024-2034 ($THOUSAND)
TABLE 24. CANADA SCINTILLATOR MARKET, BY MATERIAL COMPOSITION, 2024-2034 ($THOUSAND)
TABLE 25. CANADA SCINTILLATOR MARKET, BY PRODUCT TYPE, 2024-2034 ($THOUSAND)
TABLE 26. CANADA SCINTILLATOR MARKET, BY INDUSTRY VERTICAL, 2024-2034 ($THOUSAND)
TABLE 27. EUROPE SCINTILLATOR MARKET, BY MATERIAL COMPOSITION, 2024-2034 ($THOUSAND)
TABLE 28. EUROPE SCINTILLATOR MARKET, BY PRODUCT TYPE, 2024-2034 ($THOUSAND)
TABLE 29. EUROPE SCINTILLATOR MARKET, BY INDUSTRY VERTICAL, 2024-2034 ($THOUSAND)
TABLE 30. EUROPE SCINTILLATOR MARKET, BY COUNTRY, 2024-2034 ($THOUSAND)
TABLE 31. GERMANY SCINTILLATOR MARKET, BY MATERIAL COMPOSITION, 2024-2034 ($THOUSAND)
TABLE 32. GERMANY SCINTILLATOR MARKET, BY PRODUCT TYPE, 2024-2034 ($THOUSAND)
TABLE 33. GERMANY SCINTILLATOR MARKET, BY INDUSTRY VERTICAL, 2024-2034 ($THOUSAND)
TABLE 34. UK SCINTILLATOR MARKET, BY MATERIAL COMPOSITION, 2024-2034 ($THOUSAND)
TABLE 35. UK SCINTILLATOR MARKET, BY PRODUCT TYPE, 2024-2034 ($THOUSAND)
TABLE 36. UK SCINTILLATOR MARKET, BY INDUSTRY VERTICAL, 2024-2034 ($THOUSAND)
TABLE 37. FRANCE SCINTILLATOR MARKET, BY MATERIAL COMPOSITION, 2024-2034 ($THOUSAND)
TABLE 38. FRANCE SCINTILLATOR MARKET, BY PRODUCT TYPE, 2024-2034 ($THOUSAND)
TABLE 39. FRANCE SCINTILLATOR MARKET, BY INDUSTRY VERTICAL, 2024-2034 ($THOUSAND)
TABLE 40. RUSSIA SCINTILLATOR MARKET, BY MATERIAL COMPOSITION, 2024-2034 ($THOUSAND)
TABLE 41. RUSSIA SCINTILLATOR MARKET, BY PRODUCT TYPE, 2024-2034 ($THOUSAND)
TABLE 42. RUSSIA SCINTILLATOR MARKET, BY INDUSTRY VERTICAL, 2024-2034 ($THOUSAND)
TABLE 43. REST OF EUROPE SCINTILLATOR MARKET, BY MATERIAL COMPOSITION, 2024-2034 ($THOUSAND)
TABLE 44. REST OF EUROPE SCINTILLATOR MARKET, BY PRODUCT TYPE, 2024-2034 ($THOUSAND)
TABLE 45. REST OF EUROPE SCINTILLATOR MARKET, BY INDUSTRY VERTICAL, 2024-2034 ($THOUSAND)
TABLE 46. ASIA-PACIFIC SCINTILLATOR MARKET, BY MATERIAL COMPOSITION, 2024-2034 ($THOUSAND)
TABLE 47. ASIA-PACIFIC SCINTILLATOR MARKET, BY PRODUCT TYPE, 2024-2034 ($THOUSAND)
TABLE 48. ASIA-PACIFIC SCINTILLATOR MARKET, BY INDUSTRY VERTICAL, 2024-2034 ($THOUSAND)
TABLE 49. ASIA-PACIFIC SCINTILLATOR MARKET, BY COUNTRY, 2024-2034 ($THOUSAND)
TABLE 50. INDIA SCINTILLATOR MARKET, BY MATERIAL COMPOSITION, 2024-2034 ($THOUSAND)
TABLE 51. INDIA SCINTILLATOR MARKET, BY PRODUCT TYPE, 2024-2034 ($THOUSAND)
TABLE 52. INDIA SCINTILLATOR MARKET, BY INDUSTRY VERTICAL, 2024-2034 ($THOUSAND)
TABLE 53. JAPAN SCINTILLATOR MARKET, BY MATERIAL COMPOSITION, 2024-2034 ($THOUSAND)
TABLE 54. JAPAN SCINTILLATOR MARKET, BY PRODUCT TYPE, 2024-2034 ($THOUSAND)
TABLE 55. JAPAN SCINTILLATOR MARKET, BY INDUSTRY VERTICAL, 2024-2034 ($THOUSAND)
TABLE 56. CHINA SCINTILLATOR MARKET, BY MATERIAL COMPOSITION, 2024-2034 ($THOUSAND)
TABLE 57. CHINA SCINTILLATOR MARKET, BY PRODUCT TYPE, 2024-2034 ($THOUSAND)
TABLE 58. CHINA SCINTILLATOR MARKET, BY INDUSTRY VERTICAL, 2024-2034 ($THOUSAND)
TABLE 59. REST OF ASIA-PACIFIC SCINTILLATOR MARKET, BY MATERIAL COMPOSITION, 2024-2034 ($THOUSAND)
TABLE 60. REST OF ASIA-PACIFIC SCINTILLATOR MARKET, BY PRODUCT TYPE, 2024-2034 ($THOUSAND)
TABLE 61. REST OF ASIA-PACIFIC SCINTILLATOR MARKET, BY INDUSTRY VERTICAL, 2024-2034 ($THOUSAND)
TABLE 62. LAMEA SCINTILLATOR MARKET, BY MATERIAL COMPOSITION, 2024-2034 ($THOUSAND)
TABLE 63. LAMEA SCINTILLATOR MARKET, BY PRODUCT TYPE, 2024-2034 ($THOUSAND)
TABLE 64. LAMEA SCINTILLATOR MARKET, BY INDUSTRY VERTICAL, 2024-2034 ($THOUSAND)
TABLE 65. LAMEA SCINTILLATOR MARKET, BY COUNTRY, 2024-2034 ($THOUSAND)
TABLE 66. LATIN AMERICA SCINTILLATOR MARKET, BY MATERIAL COMPOSITION, 2024-2034 ($THOUSAND)
TABLE 67. LATIN AMERICA SCINTILLATOR MARKET, BY PRODUCT TYPE, 2024-2034 ($THOUSAND)
TABLE 68. LATIN AMERICA SCINTILLATOR MARKET, BY INDUSTRY VERTICAL, 2024-2034 ($THOUSAND)
TABLE 69. MIDDLE EAST SCINTILLATOR MARKET, BY MATERIAL COMPOSITION, 2024-2034 ($THOUSAND)
TABLE 70. MIDDLE EAST SCINTILLATOR MARKET, BY PRODUCT TYPE, 2024-2034 ($THOUSAND)
TABLE 71. MIDDLE EAST SCINTILLATOR MARKET, BY INDUSTRY VERTICAL, 2024-2034 ($THOUSAND)
TABLE 72. AFRICA SCINTILLATOR MARKET, BY MATERIAL COMPOSITION, 2024-2034 ($THOUSAND)
TABLE 73. AFRICA SCINTILLATOR MARKET, BY PRODUCT TYPE, 2024-2034 ($THOUSAND)
TABLE 74. AFRICA SCINTILLATOR MARKET, BY INDUSTRY VERTICAL, 2024-2034 ($THOUSAND)
TABLE 75. LUXIUM SOLUTIONS (FORMERLY SAINT-GOBAIN CRYSTALS): KEY EXECUTIVES
TABLE 76. LUXIUM SOLUTIONS (FORMERLY SAINT-GOBAIN CRYSTALS): COMPANY SNAPSHOT
TABLE 77. LUXIUM SOLUTIONS (FORMERLY SAINT-GOBAIN CRYSTALS): PRODUCT SEGMENTS
TABLE 78. LUXIUM SOLUTIONS (FORMERLY SAINT-GOBAIN CRYSTALS): SERVICE SEGMENTS
TABLE 79. LUXIUM SOLUTIONS (FORMERLY SAINT-GOBAIN CRYSTALS): PRODUCT PORTFOLIO
TABLE 80. LUXIUM SOLUTIONS (FORMERLY SAINT-GOBAIN CRYSTALS): KEY STRATERGIES
TABLE 81. HAMAMATSU PHOTONICS K.K.: KEY EXECUTIVES
TABLE 82. HAMAMATSU PHOTONICS K.K.: COMPANY SNAPSHOT
TABLE 83. HAMAMATSU PHOTONICS K.K.: PRODUCT SEGMENTS
TABLE 84. HAMAMATSU PHOTONICS K.K.: SERVICE SEGMENTS
TABLE 85. HAMAMATSU PHOTONICS K.K.: PRODUCT PORTFOLIO
TABLE 86. HAMAMATSU PHOTONICS K.K.: KEY STRATERGIES
TABLE 87. SCINTACOR: KEY EXECUTIVES
TABLE 88. SCINTACOR: COMPANY SNAPSHOT
TABLE 89. SCINTACOR: PRODUCT SEGMENTS
TABLE 90. SCINTACOR: SERVICE SEGMENTS
TABLE 91. SCINTACOR: PRODUCT PORTFOLIO
TABLE 92. SCINTACOR: KEY STRATERGIES
TABLE 93. ALPHA SPECTRA, INC.: KEY EXECUTIVES
TABLE 94. ALPHA SPECTRA, INC.: COMPANY SNAPSHOT
TABLE 95. ALPHA SPECTRA, INC.: PRODUCT SEGMENTS
TABLE 96. ALPHA SPECTRA, INC.: SERVICE SEGMENTS
TABLE 97. ALPHA SPECTRA, INC.: PRODUCT PORTFOLIO
TABLE 98. ALPHA SPECTRA, INC.: KEY STRATERGIES
TABLE 99. ELJEN TECHNOLOGY: KEY EXECUTIVES
TABLE 100. ELJEN TECHNOLOGY: COMPANY SNAPSHOT
TABLE 101. ELJEN TECHNOLOGY: PRODUCT SEGMENTS
TABLE 102. ELJEN TECHNOLOGY: SERVICE SEGMENTS
TABLE 103. ELJEN TECHNOLOGY: PRODUCT PORTFOLIO
TABLE 104. ELJEN TECHNOLOGY: KEY STRATERGIES
TABLE 105. PROTERIAL, LTD. (HITACHI METALS, LTD.): KEY EXECUTIVES
TABLE 106. PROTERIAL, LTD. (HITACHI METALS, LTD.): COMPANY SNAPSHOT
TABLE 107. PROTERIAL, LTD. (HITACHI METALS, LTD.): PRODUCT SEGMENTS
TABLE 108. PROTERIAL, LTD. (HITACHI METALS, LTD.): SERVICE SEGMENTS
TABLE 109. PROTERIAL, LTD. (HITACHI METALS, LTD.): PRODUCT PORTFOLIO
TABLE 110. PROTERIAL, LTD. (HITACHI METALS, LTD.): KEY STRATERGIES
TABLE 111. KINHENG CRYSTAL MATERIAL (SHANGHAI) CO., LTD.: KEY EXECUTIVES
TABLE 112. KINHENG CRYSTAL MATERIAL (SHANGHAI) CO., LTD.: COMPANY SNAPSHOT
TABLE 113. KINHENG CRYSTAL MATERIAL (SHANGHAI) CO., LTD.: PRODUCT SEGMENTS
TABLE 114. KINHENG CRYSTAL MATERIAL (SHANGHAI) CO., LTD.: SERVICE SEGMENTS
TABLE 115. KINHENG CRYSTAL MATERIAL (SHANGHAI) CO., LTD.: PRODUCT PORTFOLIO
TABLE 116. KINHENG CRYSTAL MATERIAL (SHANGHAI) CO., LTD.: KEY STRATERGIES
TABLE 117. DYNASIL CORPORATION: KEY EXECUTIVES
TABLE 118. DYNASIL CORPORATION: COMPANY SNAPSHOT
TABLE 119. DYNASIL CORPORATION: PRODUCT SEGMENTS
TABLE 120. DYNASIL CORPORATION: SERVICE SEGMENTS
TABLE 121. DYNASIL CORPORATION: PRODUCT PORTFOLIO
TABLE 122. DYNASIL CORPORATION: KEY STRATERGIES
TABLE 123. EPIC CRYSTAL CO.,LTD: KEY EXECUTIVES
TABLE 124. EPIC CRYSTAL CO.,LTD: COMPANY SNAPSHOT
TABLE 125. EPIC CRYSTAL CO.,LTD: PRODUCT SEGMENTS
TABLE 126. EPIC CRYSTAL CO.,LTD: SERVICE SEGMENTS
TABLE 127. EPIC CRYSTAL CO.,LTD: PRODUCT PORTFOLIO
TABLE 128. EPIC CRYSTAL CO.,LTD: KEY STRATERGIES
TABLE 129. NIHON KESSHO KOGAKU CO., LTD.: KEY EXECUTIVES
TABLE 130. NIHON KESSHO KOGAKU CO., LTD.: COMPANY SNAPSHOT
TABLE 131. NIHON KESSHO KOGAKU CO., LTD.: PRODUCT SEGMENTS
TABLE 132. NIHON KESSHO KOGAKU CO., LTD.: SERVICE SEGMENTS
TABLE 133. NIHON KESSHO KOGAKU CO., LTD.: PRODUCT PORTFOLIO
TABLE 134. NIHON KESSHO KOGAKU CO., LTD.: KEY STRATERGIES
LIST OF FIGURES
FIGURE 01. SCINTILLATOR MARKET, 2024-2034
FIGURE 02. SEGMENTATION OF SCINTILLATOR MARKET,2024-2034
FIGURE 03. TOP IMPACTING FACTORS IN SCINTILLATOR MARKET
FIGURE 04. TOP INVESTMENT POCKETS IN SCINTILLATOR MARKET (2025-2034)
FIGURE 05. BARGAINING POWER OF SUPPLIERS
FIGURE 06. BARGAINING POWER OF BUYERS
FIGURE 07. THREAT OF SUBSTITUTION
FIGURE 08. THREAT OF SUBSTITUTION
FIGURE 09. COMPETITIVE RIVALRY
FIGURE 10. GLOBAL SCINTILLATOR MARKET:DRIVERS, RESTRAINTS AND OPPORTUNITIES
FIGURE 11. SCINTILLATOR MARKET, BY MATERIAL COMPOSITION, 2024 AND 2034(%)
FIGURE 12. COMPARATIVE SHARE ANALYSIS OF SCINTILLATOR MARKET FOR INORGANIC SCINTILLATOR, BY COUNTRY 2024 AND 2034(%)
FIGURE 13. COMPARATIVE SHARE ANALYSIS OF SCINTILLATOR MARKET FOR ORGANIC SCINTILLATOR, BY COUNTRY 2024 AND 2034(%)
FIGURE 14. SCINTILLATOR MARKET, BY PRODUCT TYPE, 2024 AND 2034(%)
FIGURE 15. COMPARATIVE SHARE ANALYSIS OF SCINTILLATOR MARKET FOR POCKET SIZE INSTRUMENTS, BY COUNTRY 2024 AND 2034(%)
FIGURE 16. COMPARATIVE SHARE ANALYSIS OF SCINTILLATOR MARKET FOR HAND-HELD INSTRUMENTS, BY COUNTRY 2024 AND 2034(%)
FIGURE 17. COMPARATIVE SHARE ANALYSIS OF SCINTILLATOR MARKET FOR FIXED, BY COUNTRY 2024 AND 2034(%)
FIGURE 18. COMPARATIVE SHARE ANALYSIS OF SCINTILLATOR MARKET FOR INSTALLED, BY COUNTRY 2024 AND 2034(%)
FIGURE 19. COMPARATIVE SHARE ANALYSIS OF SCINTILLATOR MARKET FOR AUTOMATIC INSTRUMENTS, BY COUNTRY 2024 AND 2034(%)
FIGURE 20. SCINTILLATOR MARKET, BY INDUSTRY VERTICAL, 2024 AND 2034(%)
FIGURE 21. COMPARATIVE SHARE ANALYSIS OF SCINTILLATOR MARKET FOR INDUSTRIAL, BY COUNTRY 2024 AND 2034(%)
FIGURE 22. COMPARATIVE SHARE ANALYSIS OF SCINTILLATOR MARKET FOR AEROSPACE AND DEFENSE, BY COUNTRY 2024 AND 2034(%)
FIGURE 23. COMPARATIVE SHARE ANALYSIS OF SCINTILLATOR MARKET FOR ENERGY AND POWER, BY COUNTRY 2024 AND 2034(%)
FIGURE 24. COMPARATIVE SHARE ANALYSIS OF SCINTILLATOR MARKET FOR HEALTHCARE, BY COUNTRY 2024 AND 2034(%)
FIGURE 25. COMPARATIVE SHARE ANALYSIS OF SCINTILLATOR MARKET FOR OTHERS, BY COUNTRY 2024 AND 2034(%)
FIGURE 26. SCINTILLATOR MARKET BY REGION, 2024 AND 2034(%)
FIGURE 27. U.S. SCINTILLATOR MARKET, 2024-2034 ($THOUSAND)
FIGURE 28. CANADA SCINTILLATOR MARKET, 2024-2034 ($THOUSAND)
FIGURE 29. GERMANY SCINTILLATOR MARKET, 2024-2034 ($THOUSAND)
FIGURE 30. UK SCINTILLATOR MARKET, 2024-2034 ($THOUSAND)
FIGURE 31. FRANCE SCINTILLATOR MARKET, 2024-2034 ($THOUSAND)
FIGURE 32. RUSSIA SCINTILLATOR MARKET, 2024-2034 ($THOUSAND)
FIGURE 33. REST OF EUROPE SCINTILLATOR MARKET, 2024-2034 ($THOUSAND)
FIGURE 34. INDIA SCINTILLATOR MARKET, 2024-2034 ($THOUSAND)
FIGURE 35. JAPAN SCINTILLATOR MARKET, 2024-2034 ($THOUSAND)
FIGURE 36. CHINA SCINTILLATOR MARKET, 2024-2034 ($THOUSAND)
FIGURE 37. REST OF ASIA-PACIFIC SCINTILLATOR MARKET, 2024-2034 ($THOUSAND)
FIGURE 38. LATIN AMERICA SCINTILLATOR MARKET, 2024-2034 ($THOUSAND)
FIGURE 39. MIDDLE EAST SCINTILLATOR MARKET, 2024-2034 ($THOUSAND)
FIGURE 40. AFRICA SCINTILLATOR MARKET, 2024-2034 ($THOUSAND)
FIGURE 41. TOP WINNING STRATEGIES, BY YEAR (2023-2025)
FIGURE 42. TOP WINNING STRATEGIES, BY DEVELOPMENT (2023-2025)
FIGURE 43. TOP WINNING STRATEGIES, BY COMPANY (2023-2025)
FIGURE 44. PRODUCT MAPPING OF TOP 10 PLAYERS
FIGURE 45. COMPETITIVE DASHBOARD
FIGURE 46. COMPETITIVE HEATMAP: SCINTILLATOR MARKET
FIGURE 47. TOP PLAYER POSITIONING, 2024