Deep Tech Market Size, Share & Trends Analysis Report
Deep Tech Market Size, Share & Trends Analysis Report By Deployment Model (On-Premises, Cloud-Based, Hybrid), By Enterprise Size (Small and Medium Enterprises, Large Enterprises), By Technology, By End Use, By Region, And Segment Forecasts, 2026 - 2033
ディープテック市場 - 導入モデル(オンプレミス、クラウドベース、ハイブリッド)、企業規模別(中小企業、大企業)、技術別、用途別、地域、セグメント別予測による市場規模、成長と動向分析レポート 2026-2033年
| 出版 | Grand View Research |
| 出版年月 | 2026年02月 |
| ページ数 | 130 |
| 価格 | 記載以外のライセンスについてはお問合せください |
| シングルユーザ | USD 4,950 |
| 種別 | 英文調査報告書 |
| 商品番号 | SMR-17851 |

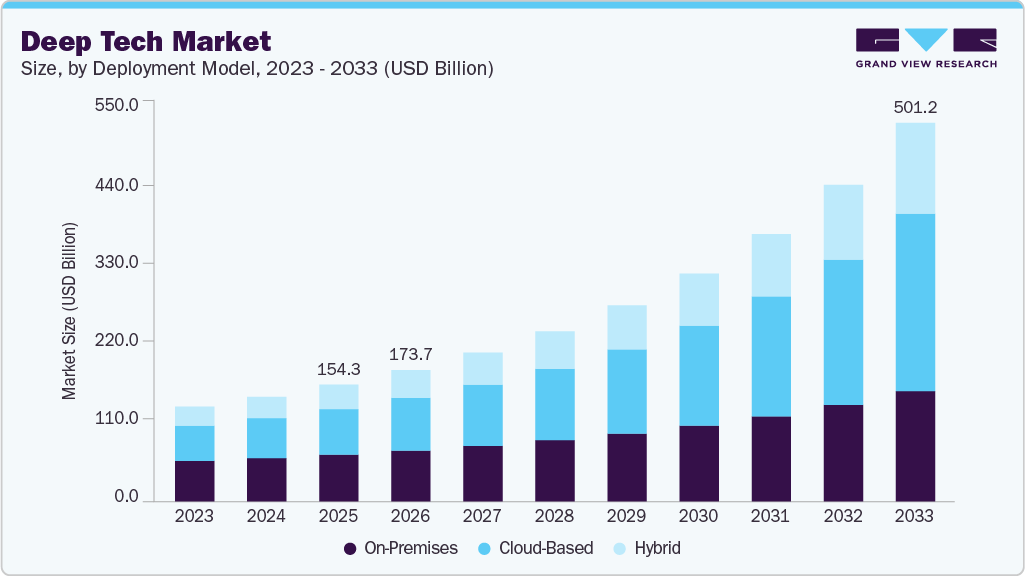
世界のディープテック市場規模は、2025年には1,543億3,000万米ドルと推定され、2033年には5,012億4,000万米ドルに達すると予測されており、2026年から2033年にかけて年平均成長率(CAGR)16.3%で成長すると見込まれています。この市場成長は、次世代のデジタルおよび物理的な変革を可能にする画期的な技術に対する需要の高まりによって牽引されています。
主要市場動向とインサイト
- 北米は、2025年に35.2%という最大の収益シェアを獲得し、世界のディープテック市場を牽引しました。
- 導入モデル別に見ると、オンプレミス型が2025年に40.0%という最大の収益シェアを獲得し、市場をリードしました。
- 企業規模別に見ると、中小企業(SME)が2025年に70.8%という最大の収益シェアを獲得し、市場をリードしました。
- 技術別に見ると、人工知能(AI)分野が2025年に34.2%という最大の収益シェアを獲得し、市場をリードしました。
- エンドユーザー別に見ると、IT・通信分野が2025年に28.3%という最大の収益シェアを獲得し、市場をリードしました。
人工知能(AI)、エッジコンピューティング、高性能半導体の急速な進歩により、企業における導入が拡大し、ディープテック産業の成長がさらに加速しています。
生成型AIプラットフォーム、エッジAIプロセッサ、自律型ロボットシステム、デジタルツインベースのシミュレーション環境といった次世代ディープテクノロジーの導入拡大は、運用インテリジェンスの向上、意思決定の迅速化、そして生産性の大幅な向上をもたらすと期待されています。スマートマニュファクチャリング、自律型モビリティエコシステム、AIを活用した企業インフラへの注目の高まりに加え、予知保全、インテリジェントオートメーション、リアルタイム最適化への需要増加も、企業による高度なディープテックソリューションへの投資を加速させ、ディープテック産業の持続的な拡大に貢献しています。
本レポートは、世界、地域、国レベルでの収益成長を予測し、2021年から2033年までの各サブセグメントにおける最新の技術動向を分析しています。本調査において、Grand View Researchは、導入モデル、企業規模、技術、エンドユーザー、地域に基づいて、世界のディープテック市場レポートをセグメント化しました。
Deep Tech Market Summary
The global deep tech market size was estimated at USD 154.33 billion in 2025 and is projected to reach USD 501.24 billion by 2033, growing at a CAGR of 16.3% from 2026 to 2033. The market growth is driven by the increasing demand for breakthrough technologies that enable next-generation digital and physical transformation.
Key Market Trends & Insights
- North America dominated the global deep tech market with the largest revenue share of 35.2% in 2025.
- Based on deployment model, the on-premises segment led the market with the largest revenue share of 40.0% in 2025.
- Based on enterprise size, the small & medium enterprises segment led the market with the largest revenue share of 70.8% in 2025.
- Based on technology, the artificial intelligence segment led the market with the largest revenue share of 34.2% in 2025.
- Based on end use, the IT & telecommunication segment led the market with the largest revenue share of 28.3% in 2025.
Market Size & Forecast
- 2025 Market Size: USD 154.33 Billion
- 2033 Projected Market Size: USD 501.24 Billion
- CAGR (2026-2033): 16.3%
- North America: Largest market in 2025
Rapid advancements in artificial intelligence (AI), edge computing, and high-performance semiconductors are enabling wider enterprise adoption, further accelerating the growth of the deep tech industry.
The increasing adoption of next-generation deep technologies, such as generative AI platforms, edge AI processors, autonomous robotics systems, and digital twin-based simulation environments, is expected to enhance operational intelligence, accelerate decision-making, and deliver high-impact productivity gains. The growing emphasis on smart manufacturing, autonomous mobility ecosystems, and AI-enabled enterprise infrastructure, along with rising demand for predictive maintenance, intelligent automation, and real-time optimization, is accelerating enterprise investments in advanced deep tech solutions, thereby contributing to the sustained expansion of the deep tech industry.
The growing deployment of advanced semiconductor technologies, including AI accelerators, neuromorphic chips, photonic computing, and high-efficiency power electronics, is expected to improve computing performance, reduce energy consumption, and support scalable AI workloads. The increasing focus on data center modernization, high-performance computing (HPC), and edge-to-cloud connectivity, combined with demand for low-latency processing in industrial IoT, smart cities, and defense-grade systems, is driving technology upgrades and fueling market growth.
In addition, growing integration of robotics, automation, and intelligent sensing technologies, such as LiDAR, computer vision, sensor fusion, and autonomous navigation software, is expected to improve precision, safety, and scalability across complex operational environments. The expanding demand for warehouse automation, last-mile delivery robotics, autonomous mining equipment, and smart inspection drones, along with increasing investments in AI-powered motion planning and real-time control systems, is strengthening the adoption of deep tech solutions across industrial sectors.
Moreover, the adoption of clean energy and climate deep-tech solutions, such as next-generation battery chemistries, hydrogen production systems, carbon capture technologies, and smart grid optimization platforms, is expected to improve energy efficiency and accelerate decarbonization. The growing focus on net-zero targets, renewable integration, and sustainable industrial operations, combined with increasing deployment of AI-driven energy forecasting, grid digital twins, and predictive asset management, is driving large-scale investments and expanding the deep tech industry.
Deployment Model Insights
The on-premises segment led the market with the largest revenue share of 40.0% in 2025, driven by the strong demand for greater data control, low-latency processing, and regulatory compliance. On-premises deep-tech deployments remain highly preferred for mission-critical AI workloads, robotics and automation systems, and high-volume big-data processing. The growing need for confidential model training, sensitive customer data protection, and internal governance of AI pipelines continues to support the sustained dominance of on-premises deep tech solutions in large-scale enterprise deployments.
The cloud-based segment is expected to register at the fastest CAGR of 19.0% from 2026 to 2033. This growth is attributed to the rapid expansion of AI-as-a-service platforms, scalable big data analytics, and IoT-enabled real-time intelligence applications across multiple industries. Enterprises are increasingly shifting toward cloud-based deep tech models due to benefits such as elastic computing, faster deployment cycles, and access to advanced GPU and accelerator-based compute environments. The growing adoption of generative AI, cloud-native robotics simulation, and edge-to-cloud integration frameworks, along with improvements in cloud security and distributed data processing, is accelerating the cloud-based segment in the deep tech industry.
Enterprise Size Insights
The small & medium enterprise segment accounted for the largest market revenue share in 2025, driven by the rising adoption of cost-efficient deep tech solutions across industries such as retail, IT services, logistics, and small-scale manufacturing. SMEs are increasingly deploying cloud-based AI, big data analytics, IoT monitoring platforms, and automation tools. The growing availability of subscription-based deep tech platforms, low-code AI development tools, and scalable SaaS deployment models is enabling SMEs to adopt advanced technologies. These factors reflect the continued focus on high-volume adoption of affordable deep tech solutions, thereby sustaining the strong position of SMEs in the deep tech industry.
The large enterprise segment is expected to witness at the fastest CAGR from 2026 to 2033. This growth is primarily driven by the expanding deployment of deep tech across enterprise-scale AI transformation programs, autonomous robotics automation, digital twin infrastructure, and advanced cybersecurity. The increasing emphasis on AI governance, regulatory compliance, secure hybrid cloud architectures, and the integration of high-performance computing (HPC) is further fueling adoption. These developments are accelerating enterprise-wide deep tech deployments, thereby contributing to the strong long-term growth of the large enterprise segment in the deep tech industry.
Technology Insights
The artificial intelligence segment accounted for the largest market revenue share in 2025, driven by its strong ability to deliver automation at scale, predictive decision-making, real-time analytics, and intelligent customer engagement, enabling organizations to improve productivity and reduce operational costs. The increasing deployment of generative AI models, AI-powered cybersecurity, intelligent process automation (IPA), and AI-driven recommendation and personalization engines is further strengthening demand. These factors reflect the continued focus on scalable and high-impact deep tech adoption, thereby sustaining the leadership of the artificial intelligence segment in the deep tech industry.
The internet of things (IoT) segment is expected to witness at the fastest CAGR from 2026 to 2033. This growth is primarily driven by the growing need for real-time connected intelligence, predictive maintenance, and smart city infrastructure. The increasing rollout of 5G connectivity, edge computing integration, and low-power sensor networks is enabling faster data capture and low-latency analytics, accelerating IoT adoption across mission-critical deep tech applications. These developments are expected to accelerate IoT deployment, thereby driving strong long-term expansion of the segment in the deep tech industry.
End Use Insights
The IT & telecommunication segment accounted for the largest market revenue share in 2025, driven by the rapid expansion of 5G infrastructure, cloud-native network modernization, and rising demand for AI-enabled network automation. The growing adoption of software-defined networking (SDN), network function virtualization (NFV), and AI-powered cybersecurity frameworks, along with increasing investments in hyperscale data centers, is further strengthening demand, thereby sustaining the leadership of the IT & telecommunication segment in the deep tech industry.
The agriculture segment is expected to register at the fastest CAGR from 2026 to 2033. This growth is primarily driven by the rising adoption of precision farming technologies, AI-based crop monitoring, and IoT-enabled smart irrigation systems. The growing emphasis on sustainable farming practices, real-time farm asset monitoring, and data-driven decision-making, supported by improving rural connectivity and falling sensor costs, is accelerating adoption, thereby supporting strong growth of the segment in the deep tech industry.
Key Deep Tech Company Insights
Some of the key players operating in the market are NVIDIA Corporation and Microsoft Corporation, among others.
- NVIDIA Corporation is a global company in advanced computing and AI acceleration technologies, specializing in high-performance GPUs, AI supercomputing platforms, and edge AI hardware that enable large-scale deep learning, robotics, autonomous systems, and real-time industrial intelligence. With extensive innovation in AI infrastructure, accelerated computing, and AI software ecosystems such as CUDA and enterprise AI stacks, the company drives deep tech adoption across hyperscale data centers, automotive autonomy, and smart manufacturing, reinforcing its position as a core enabler in the deep tech industry.
- Microsoft Corporation is a global technology company in deep tech innovation, specializing in cloud-scale AI, advanced enterprise computing, and next-generation digital infrastructure through its Azure platform. The company enables deep-tech commercialization through foundation AI models, AI co-pilots, and scalable cloud AI services that support enterprise automation, predictive analytics, cybersecurity modernization, and intelligent operations. Microsoft continues to accelerate deep tech adoption across industries, strengthening its leadership in the field.
Anthropic PBC and Covariant are some of the emerging participants in the deep tech industry.
- Anthropic PBC is a fast-growing deep tech company specializing in advanced generative AI and large language model development, focused on delivering high-performance, safety-aligned AI systems for enterprise and mission-critical use cases. The company’s rapid innovation in foundation model training, responsible AI alignment methods, and scalable AI deployment is enabling organizations to adopt next-generation deep tech capabilities across customer service automation, knowledge workflows, and intelligent decision support. With strong momentum in enterprise AI adoption and model innovation, Anthropic is emerging as a high-impact player in the deep tech industry.
- Covariant is an emerging deep tech company specializing in AI-powered robotics and autonomous manipulation systems that enable intelligent automation in warehouses and industrial environments. The company integrates deep learning, computer vision, and robotics control software to deliver adaptive robotic picking and material handling solutions that improve speed, accuracy, and operational efficiency. With the growing demand for robotics-led supply chain modernization and scalable automation, Covariant is strengthening its presence as an emerging innovator in the deep tech industry.
Key Deep Tech Companies:
The following key companies have been profiled for this study on the deep tech market.
- Anthropic PBC
- Databricks
- Alphabet Inc. (Google DeepMind)
- NVIDIA Corporation
- International Business Machines Corporation
- Microsoft Corporation
- Amazon Web Services, Inc.
- Oracle Corporation
- Siemens AG
- Qualcomm Technologies, Inc.
- SAP SE
- Covariant.
Recent Developments
- In February 2026, Anthropic PBC secured a USD 30 billion Series G funding round, marking one of the largest funding events in the AI space and underscoring strong investor confidence in enterprise AI platform development, advanced AI models, and cloud-scale deep tech deployments. This capital influx is expected to accelerate the development of frontier AI research, expand computing infrastructure, and enterprise AI products, further strengthening Anthropic’s role in shaping next-generation deep tech applications.
- In January 2026, NVIDIA Corporation launched its next-generation AI platform called the Rubin platform, comprising six new chips optimized for high-performance computing workloads and advanced reasoning models, representing a significant architectural leap for AI supercomputing and agentic AI deployment across industrial, scientific, and enterprise deep tech applications. The launch of the Rubin platform signals accelerated innovation in AI infrastructure, enabling deeper integration of AI into complex automation and next-generation AI systems across sectors in the deep tech industry.
- In October 2025, Oracle announced the upcoming OCI Zettascale10 cloud supercomputer project, designed to connect up to 800,000 GPUs across multiple data centers to deliver massive AI compute performance capable of supporting large-scale generative AI and simulation workloads. This positions Oracle as a strategic provider of next-generation AI infrastructure that can underpin deep tech innovation across AI research, scientific computing, and enterprise automation.
Deep Tech Market Report Scope
| Report Attribute | Details |
| Market size value in 2026 | USD 173.71 billion |
| Revenue forecast in 2033 | USD 501.24 billion |
| Growth rate | CAGR of 16.3% from 2026 to 2033 |
| Base year for estimation | 2025 |
| Historical data | 2021 – 2024 |
| Forecast period | 2026 – 2033 |
| Quantitative units | Revenue in USD million/billion, and CAGR from 2026 to 2033 |
| Report Product | Revenue forecast, company ranking, competitive landscape, growth factors, and trends |
| Segments covered | Deployment model, enterprise size, technology, end use, region |
| Regional scope | North America; Europe; Asia Pacific; Latin America; Middle East & Africa |
| Country scope | U.S.; Canada; Mexico; UK; Germany; France; China; Japan; India; South Korea; Australia; Brazil; UAE; Saudi Arabia; South Africa |
| Key companies profiled | Anthropic PBC; Databricks; Alphabet Inc. (Google DeepMind); NVIDIA Corporation; International Business Machines Corporation; Microsoft Corporation; Amazon Web Services, Inc.; Oracle Corporation; Siemens AG; Qualcomm Technologies, Inc.; SAP SE; Covariant. |
| Customization scope | Free report customization (equivalent to up to 8 analyst’s working days) with purchase. Addition or alteration to country, regional & segment scope. |
Global Deep Tech Market Report Segmentation
This report forecasts revenue growth at global, regional, and country levels and provides an analysis of the latest technology trends in each of the sub-segments from 2021 to 2033. For this study, Grand View Research has segmented the global deep tech market report based on deployment model, enterprise size, technology, end use, and region:
- Deployment Model Outlook (Revenue, USD Billion, 2021 – 2033)
- On-Premises
- Cloud-Based
- Hybrid
- Enterprise Size Outlook (Revenue, USD Billion, 2021 – 2033)
- Small and Medium Enterprises
- Large Enterprises
- Technology Outlook (Revenue, USD Billion, 2021 – 2033)
- Big Data
- Artificial Intelligence
- Blockchain
- Robotics
- Internet of Things (IoT)
- Quantum Computing
- Others
- End Use Outlook (Revenue, USD Billion, 2021 – 2033)
- BFSI
- IT & Telecommunication
- Automotive
- Healthcare
- Agriculture
- Others
- Regional Outlook (Revenue, USD Billion, 2021 – 2033)
- North America
- U.S.
- Canada
- Mexico
- Europe
- UK
- Germany
- France
- Asia Pacific
- China
- Japan
- India
- South Korea
- Australia
- Latin America
- Brazil
- Middle East & Africa
- Saudi Arabia
- South Africa
- UAE
- North America
Table of Contents
Chapter 1. Methodology and Scope
1.1. Market Segmentation and Scope
1.2. Market Definitions
1.2.1. Information analysis
1.2.2. Market formulation & data visualization
1.2.3. Data validation & publishing
1.3. Research Scope and Assumptions
1.3.1. List of Data Sources
Chapter 2. Executive Summary
2.1. Market Outlook
2.2. Segment Outlook
2.3. Competitive Insights
Chapter 3. Deep Tech Market Variables, Trends, & Scope
3.1. Market Lineage Outlook
3.2. Market Dynamics
3.2.1. Market Driver Analysis
3.2.2. Market Restraint Analysis
3.2.3. Market Opportunities
3.3. Deep Tech Market Analysis Tools
3.3.1. Industry Analysis – Porter’s
3.3.1.1. Bargaining power of the suppliers
3.3.1.2. Bargaining power of the buyers
3.3.1.3. Threats of substitution
3.3.1.4. Threats from new entrants
3.3.1.5. Competitive rivalry
3.3.2. PESTEL Analysis
3.3.2.1. Political landscape
3.3.2.2. Economic landscape
3.3.2.3. Social landscape
3.3.2.4. Technological landscape
3.3.2.5. Environmental landscape
3.3.2.6. Legal landscape
Chapter 4. Deep Tech Market: Deployment Model Estimates & Trend Analysis
4.1. Segment Dashboard
4.2. Deep Tech Market: Deployment Model Movement Analysis, USD Billion, 2025 & 2033
4.3. On-Premises
4.3.1. On-Premises Market Revenue Estimates and Forecasts, 2021 – 2033 (USD Billion)
4.4. Cloud-Based
4.4.1. Cloud-Based Market Revenue Estimates and Forecasts, 2021 – 2033 (USD Billion)
4.5. Hybrid
4.5.1. Hybrid Market Revenue Estimates and Forecasts, 2021 – 2033 (USD Billion)
Chapter 5. Deep Tech Market: Enterprise Size Estimates & Trend Analysis
5.1. Segment Dashboard
5.2. Deep Tech Market: Enterprise Size Movement Analysis, USD Billion, 2025 & 2033
5.3. Small and Medium Enterprises
5.3.1. Small and Medium Enterprises Market Revenue Estimates and Forecasts, 2021 – 2033 (USD Billion)
5.4. Large Enterprises
5.4.1. Large Enterprises Market Revenue Estimates and Forecasts, 2021 – 2033 (USD Billion)
Chapter 6. Deep Tech Market: Technology Estimates & Trend Analysis
6.1. Segment Dashboard
6.2. Deep Tech Market: Technology Movement Analysis, USD Billion, 2025 & 2033
6.3. Big Data
6.3.1. Big Data Market Revenue Estimates and Forecasts, 2021 – 2033 (USD Billion)
6.4. Artificial Intelligence
6.4.1. Artificial Intelligence Market Revenue Estimates and Forecasts, 2021 – 2033 (USD Billion)
6.5. Blockchain
6.5.1. Blockchain Market Revenue Estimates and Forecasts, 2021 – 2033 (USD Billion)
6.6. Robotics
6.6.1. Robotics Market Revenue Estimates and Forecasts, 2021 – 2033 (USD Billion)
6.7. Internet of Things (IoT)
6.7.1. Internet of Things (IoT) Market Revenue Estimates and Forecasts, 2021 – 2033 (USD Billion)
6.8. Quantum Computing
6.8.1. Quantum Computing Market Revenue Estimates and Forecasts, 2021 – 2033 (USD Billion)
6.9. Others
6.9.1. Others Medium Market Revenue Estimates and Forecasts, 2021 – 2033 (USD Billion)
Chapter 7. Deep Tech Market: Ens Use Estimates & Trend Analysis
7.1. Segment Dashboard
7.2. Deep Tech Market: End Use Movement Analysis, USD Billion, 2025 & 2033
7.3. BFSI
7.3.1. BFSI Market Revenue Estimates and Forecasts, 2021 – 2033 (USD Billion)
7.4. IT & Telecommunication
7.4.1. IT & Telecommunication Market Revenue Estimates and Forecasts, 2021 – 2033 (USD Billion)
7.5. Automotive
7.5.1. Automotive Market Revenue Estimates and Forecasts, 2021 – 2033 (USD Billion)
7.6. Healthcare
7.6.1. Healthcare Market Revenue Estimates and Forecasts, 2021 – 2033 (USD Billion)
7.7. Agriculture
7.7.1. Agriculture Market Revenue Estimates and Forecasts, 2021 – 2033 (USD Billion)
7.8. Others
7.8.1. Others Market Revenue Estimates and Forecasts, 2021 – 2033 (USD Billion)
Chapter 8. Regional Estimates & Trend Analysis
8.1. Deep Tech Market by Region, 2025 & 2033
8.2. North America
8.2.1. North America Deep Tech Market Estimates & Forecasts, 2021 – 2033, (USD Billion)
8.2.2. U.S.
8.2.2.1. U.S. Deep Tech Market Estimates and Forecasts, 2021 – 2033 (USD Billion)
8.2.3. Canada
8.2.3.1. Canada Deep Tech Market Estimates and Forecasts, 2021 – 2033 (USD Billion)
8.2.4. Mexico
8.2.4.1. Mexico Deep Tech Market Estimates and Forecasts, 2021 – 2033 (USD Billion)
8.3. Europe
8.3.1. Europe Deep Tech Market Estimates and Forecasts, 2021 – 2033 (USD Billion)
8.3.2. UK
8.3.2.1. UK Deep Tech Market Estimates and Forecasts, 2021 – 2033 (USD Billion)
8.3.3. Germany
8.3.3.1. Germany Deep Tech Market Estimates and Forecasts, 2021 – 2033 (USD Billion)
8.3.4. France
8.3.4.1. France Deep Tech Market Estimates and Forecasts, 2021 – 2033 (USD Billion)
8.4. Asia Pacific
8.4.1. Asia Pacific Deep Tech Market Estimates and Forecasts, 2021 – 2033 (USD Billion)
8.4.2. China
8.4.2.1. China Deep Tech Market Estimates and Forecasts, 2021 – 2033 (USD Billion)
8.4.3. Japan
8.4.3.1. Japan Deep Tech Market Estimates and Forecasts, 2021 – 2033 (USD Billion)
8.4.4. India
8.4.4.1. India Deep Tech Market Estimates and Forecasts, 2021 – 2033 (USD Billion)
8.4.5. South Korea
8.4.5.1. South Korea Deep Tech Market Estimates and Forecasts, 2021 – 2033 (USD Billion)
8.4.6. Australia
8.4.6.1. Australia Deep Tech Market Estimates and Forecasts, 2021 – 2033 (USD Billion)
8.5. Latin America
8.5.1. Latin America Deep Tech Market Estimates and Forecasts, 2021 – 2033 (USD Billion)
8.5.2. Brazil
8.5.2.1. Brazil Deep Tech Market Estimates and Forecasts, 2021 – 2033 (USD Billion)
8.6. Middle East and Africa
8.6.1. Middle East and Africa Deep Tech Market Estimates and Forecasts, 2021 – 2033 (USD Billion)
8.6.2. UAE
8.6.2.1. UAE Deep Tech Market Estimates and Forecasts, 2021 – 2033 (USD Billion)
8.6.3. Saudi Arabia
8.6.3.1. Saudi Arabia Deep Tech Market Estimates and Forecasts, 2021 – 2033 (USD Billion)
8.6.4. South Africa
8.6.4.1. South Africa Deep Tech Market Estimates and Forecasts, 2021 – 2033 (USD Billion)
8.6.5. UAE
8.6.5.1. UAE Deep Tech Market Estimates and Forecasts, 2021 – 2033 (USD Billion)
Chapter 9. Competitive Landscape
9.1. Company Categorization
9.2. Company Market Positioning
9.3. Company Heat Map Analysis
9.4. Company Profiles/Listing
9.4.1. Anthropic PBC
9.4.1.1. Participant’s Overview
9.4.1.2. Financial Performance
9.4.1.3. Product Benchmarking
9.4.1.4. Strategic Initiatives
9.4.2. Databricks
9.4.2.1. Participant’s Overview
9.4.2.2. Financial Performance
9.4.2.3. Product Benchmarking
9.4.2.4. Strategic Initiatives
9.4.3. Alphabet Inc. (Google DeepMind)
9.4.3.1. Participant’s Overview
9.4.3.2. Financial Performance
9.4.3.3. Product Benchmarking
9.4.3.4. Strategic Initiatives
9.4.4. NVIDIA Corporation
9.4.4.1. Participant’s Overview
9.4.4.2. Financial Performance
9.4.4.3. Product Benchmarking
9.4.4.4. Strategic Initiatives
9.4.5. International Business Machines Corporation
9.4.5.1. Participant’s Overview
9.4.5.2. Financial Performance
9.4.5.3. Product Benchmarking
9.4.5.4. Strategic Initiatives
9.4.6. Microsoft Corporation
9.4.6.1. Participant’s Overview
9.4.6.2. Financial Performance
9.4.6.3. Product Benchmarking
9.4.6.4. Strategic Initiatives
9.4.7. Amazon Web Services, Inc.
9.4.7.1. Participant’s Overview
9.4.7.2. Financial Performance
9.4.7.3. Product Benchmarking
9.4.7.4. Strategic Initiatives
9.4.8. Oracle Corporation
9.4.8.1. Participant’s Overview
9.4.8.2. Financial Performance
9.4.8.3. Product Benchmarking
9.4.8.4. Strategic Initiatives
9.4.9. Siemens AG
9.4.9.1. Participant’s Overview
9.4.9.2. Financial Performance
9.4.9.3. Product Benchmarking
9.4.9.4. Strategic Initiatives
9.4.10. Qualcomm Technologies, Inc.
9.4.10.1. Participant’s Overview
9.4.10.2. Financial Performance
9.4.10.3. Product Benchmarking
9.4.10.4. Strategic Initiatives
9.4.11. SAP SE
9.4.11.1. Participant’s Overview
9.4.11.2. Financial Performance
9.4.11.3. Product Benchmarking
9.4.11.4. Strategic Initiatives
9.4.12. Covariant.
9.4.12.1. Participant’s Overview
9.4.12.2. Financial Performance
9.4.12.3. Product Benchmarking
9.4.12.4. Strategic Initiatives
List of Tables
Table 1 Deep Tech Market Size Estimates & Forecasts, 2021 – 2033 (USD Billion)
Table 2 Deep Tech Market, By Deployment Model, 2021 – 2033 (Revenue, USD Billion)
Table 3 Deep Tech Market, By Enterprise Size, 2021 – 2033 (Revenue, USD Billion)
Table 4 Deep Tech Market, By Technology, 2021 – 2033 (Revenue, USD Billion)
Table 5 Deep Tech Market, By End Use, 2021 – 2033 (Revenue, USD Billion)
Table 6 On-Premises Market Estimates & Forecasts, 2021 – 2033 (Revenue, USD Billion)
Table 7 Cloud-Based Market Estimates & Forecasts, 2021 – 2033 (Revenue, USD Billion)
Table 8 Hybrid Market Estimates & Forecasts, 2021 – 2033 (Revenue, USD Billion)
Table 9 Small and Medium Enterprises Market Estimates & Forecasts, 2021 – 2033 (Revenue, USD Billion)
Table 10 Large Enterprises Market Estimates & Forecasts, 2021 – 2033 (Revenue, USD Billion)
Table 11 Big Data Market Estimates & Forecasts, 2021 – 2033 (Revenue, USD Billion)
Table 12 Artificial Intelligence Market Estimates & Forecasts, 2021 – 2033 (Revenue, USD Billion)
Table 13 Blockchain Market Estimates & Forecasts, 2021 – 2033 (Revenue, USD Billion)
Table 14 Robotics Market Estimates & Forecasts, 2021 – 2033 (Revenue, USD Billion)
Table 15 Internet of Things (IoT) Market Estimates & Forecasts, 2021 – 2033 (Revenue, USD Billion)
Table 16 Quantum Computing Market Estimates & Forecasts, 2021 – 2033 (Revenue, USD Billion)
Table 17 Others Market Estimates & Forecasts, 2021 – 2033 (Revenue, USD Billion)
Table 18 BFSI Market Estimates & Forecasts, 2021 – 2033 (Revenue, USD Billion)
Table 19 IT & Telecommunication Market Estimates & Forecasts, 2021 – 2033 (Revenue, USD Billion)
Table 20 Automotive Market Estimates & Forecasts, 2021 – 2033 (Revenue, USD Billion)
Table 21 Healthcare Market Estimates & Forecasts, 2021 – 2033 (Revenue, USD Billion)
Table 22 Agriculture Market Estimates & Forecasts, 2021 – 2033 (Revenue, USD Billion)
Table 23 Others Market Estimates & Forecasts, 2021 – 2033 (Revenue, USD Billion)
Table 24 North America Deep Tech Market Revenue Estimates & Forecast, By Resolution 2021 – 2033 (USD Billion)
Table 25 North America Deep Tech Market Revenue Estimates & Forecast, By Enterprise Size, 2021 – 2033 (USD Billion)
Table 26 North America Deep Tech Market Revenue Estimates & Forecast, By Technology, 2021 – 2033 (USD Billion)
Table 27 North America Deep Tech Market Revenue Estimates & Forecast, By End Use, 2021 – 2033 (USD Billion)
Table 28 U.S Deep Tech Market Revenue Estimates & Forecast, By Deployment Model, 2021 – 2033 (USD Billion)
Table 29 U.S Deep Tech Market Revenue Estimates & Forecast, By Enterprise Size, 2021 – 2033 (USD Billion)
Table 30 U.S Deep Tech Market Revenue Estimates & Forecast, By Technology, 2021 – 2033 (USD Billion)
Table 31 U.S Deep Tech Market Revenue Estimates & Forecast, By End Use, 2021 – 2033 (USD Billion)
Table 32 Canada Deep Tech Market Revenue Estimates & Forecast, By Deployment Model, 2021 – 2033 (USD Billion)
Table 33 Canada Deep Tech Market Revenue Estimates & Forecast, By Enterprise Size, 2021 – 2033 (USD Billion)
Table 34 Canada Deep Tech Market Revenue Estimates & Forecast, By Technology, 2021 – 2033 (USD Billion)
Table 35 Canada Deep Tech Market Revenue Estimates & Forecast, By End Use, 2021 – 2033 (USD Billion)
Table 36 Mexico Deep Tech Market Revenue Estimates & Forecast, By Deployment Model, 2021 – 2033 (USD Billion)
Table 37 Mexico Deep Tech Market Revenue Estimates & Forecast, By Enterprise Size, 2021 – 2033 (USD Billion)
Table 38 Mexico Deep Tech Market Revenue Estimates & Forecast, By Technology, 2021 – 2033 (USD Billion)
Table 39 Mexico Deep Tech Market Revenue Estimates & Forecast, By End Use, 2021 – 2033 (USD Billion)
Table 40 Europe Deep Tech Market Revenue Estimates & Forecast, By Deployment Model, 2021 – 2033 (USD Billion)
Table 41 Europe Deep Tech Market Revenue Estimates & Forecast, By Enterprise Size, 2021 – 2033 (USD Billion)
Table 42 Europe Deep Tech Market Revenue Estimates & Forecast, By Technology, 2021 – 2033 (USD Billion)
Table 43 Europe Deep Tech Market Revenue Estimates & Forecast, By End Use, 2021 – 2033 (USD Billion)
Table 44 UK Deep Tech Market Revenue Estimates & Forecast, By Deployment Model, 2021 – 2033 (USD Billion)
Table 45 UK Deep Tech Market Revenue Estimates & Forecast, By Enterprise Size, 2021 – 2033 (USD Billion)
Table 46 UK Deep Tech Market Revenue Estimates & Forecast, By Technology, 2021 – 2033 (USD Billion)
Table 47 UK Deep Tech Market Revenue Estimates & Forecast, By End Use, 2021 – 2033 (USD Billion)
Table 48 Germany Deep Tech Market Revenue Estimates & Forecast, By Deployment Model, 2021 – 2033 (USD Billion)
Table 49 Germany Deep Tech Market Revenue Estimates & Forecast, By Enterprise Size, 2021 – 2033 (USD Billion)
Table 50 Germany Deep Tech Market Revenue Estimates & Forecast, By Technology, 2021 – 2033 (USD Billion)
Table 51 Germany Deep Tech Market Revenue Estimates & Forecast, By End Use, 2021 – 2033 (USD Billion)
Table 52 France Deep Tech Market Revenue Estimates & Forecast, By Deployment Model, 2021 – 2033 (USD Billion)
Table 53 France Deep Tech Market Revenue Estimates & Forecast, By Enterprise Size, 2021 – 2033 (USD Billion)
Table 54 France Deep Tech Market Revenue Estimates & Forecast, By Technology, 2021 – 2033 (USD Billion)
Table 55 France Deep Tech Market Revenue Estimates & Forecast, By End Use, 2021 – 2033 (USD Billion)
Table 56 Asia Pacific Deep Tech Market Revenue Estimates & Forecast, By Deployment Model, 2021 – 2033 (USD Billion)
Table 57 Asia Pacific Deep Tech Market Revenue Estimates & Forecast, By Enterprise Size, 2021 – 2033 (USD Billion)
Table 58 Asia Pacific Deep Tech Market Revenue Estimates & Forecast, By Technology, 2021 – 2033 (USD Billion)
Table 59 Asia Pacific Deep Tech Market Revenue Estimates & Forecast, By End Use, 2021 – 2033 (USD Billion)
Table 60 China Deep Tech Market Revenue Estimates & Forecast, By Deployment Model, 2021 – 2033 (USD Billion)
Table 61 China Deep Tech Market Revenue Estimates & Forecast, By Enterprise Size, 2021 – 2033 (USD Billion)
Table 62 China Deep Tech Market Revenue Estimates & Forecast, By Technology, 2021 – 2033 (USD Billion)
Table 63 China Deep Tech Market Revenue Estimates & Forecast, By End Use, 2021 – 2033 (USD Billion)
Table 64 Japan Deep Tech Market Revenue Estimates & Forecast, By Deployment Model, 2021 – 2033 (USD Billion)
Table 65 Japan Deep Tech Market Revenue Estimates & Forecast, By Enterprise Size, 2021 – 2033 (USD Billion)
Table 66 Japan Deep Tech Market Revenue Estimates & Forecast, By Technology, 2021 – 2033 (USD Billion)
Table 67 Japan Deep Tech Market Revenue Estimates & Forecast, By End Use, 2021 – 2033 (USD Billion)
Table 68 India Deep Tech Market Revenue Estimates & Forecast, By Deployment Model, 2021 – 2033 (USD Billion)
Table 69 India Deep Tech Market Revenue Estimates & Forecast, By Enterprise Size, 2021 – 2033 (USD Billion)
Table 70 India Deep Tech Market Revenue Estimates & Forecast, By Technology, 2021 – 2033 (USD Billion)
Table 71 India Deep Tech Market Revenue Estimates & Forecast, By End Use, 2021 – 2033 (USD Billion)
Table 72 South Korea Deep Tech Market Revenue Estimates & Forecast, By Deployment Model, 2021 – 2033 (USD Billion)
Table 73 South Korea Deep Tech Market Revenue Estimates & Forecast, By Enterprise Size, 2021 – 2033 (USD Billion)
Table 74 South Korea Deep Tech Market Revenue Estimates & Forecast, By Technology, 2021 – 2033 (USD Billion)
Table 75 South Korea Deep Tech Market Revenue Estimates & Forecast, By End Use, 2021 – 2033 (USD Billion)
Table 76 Australia Deep Tech Market Revenue Estimates & Forecast, By Deployment Model, 2021 – 2033 (USD Billion)
Table 77 Australia Deep Tech Market Revenue Estimates & Forecast, By Enterprise Size, 2021 – 2033 (USD Billion)
Table 78 Australia Deep Tech Market Revenue Estimates & Forecast, By Technology, 2021 – 2033 (USD Billion)
Table 79 Australia Deep Tech Market Revenue Estimates & Forecast, By End Use, 2021 – 2033 (USD Billion)
Table 80 Latin America Deep Tech Market Revenue Estimates & Forecast, By Deployment Model, 2021 – 2033 (USD Billion)
Table 81 Latin America Deep Tech Market Revenue Estimates & Forecast, By Enterprise Size, 2021 – 2033 (USD Billion)
Table 82 Latin America Deep Tech Market Revenue Estimates & Forecast, By Technology, 2021 – 2033 (USD Billion)
Table 83 Latin America Deep Tech Market Revenue Estimates & Forecast, By End Use, 2021 – 2033 (USD Billion)
Table 84 Brazil Deep Tech Market Revenue Estimates & Forecast, By Deployment Model, 2021 – 2033 (USD Billion)
Table 85 Brazil Deep Tech Market Revenue Estimates & Forecast, By Enterprise Size, 2021 – 2033 (USD Billion)
Table 86 Brazil Deep Tech Market Revenue Estimates & Forecast, By Technology, 2021 – 2033 (USD Billion)
Table 87 Brazil Deep Tech Market Revenue Estimates & Forecast, By End Use, 2021 – 2033 (USD Billion)
Table 88 MEA Deep Tech Market Revenue Estimates & Forecast, By Deployment Model, 2021 – 2033 (USD Billion)
Table 89 MEA Deep Tech Market Revenue Estimates & Forecast, By Enterprise Size, 2021 – 2033 (USD Billion)
Table 90 MEA Deep Tech Market Revenue Estimates & Forecast, By Technology, 2021 – 2033 (USD Billion)
Table 91 MEA Deep Tech Market Revenue Estimates & Forecast, By End Use, 2021 – 2033 (USD Billion)
Table 92 Saudi Arabia Deep Tech Market Revenue Estimates & Forecast, By Deployment Model, 2021 – 2033 (USD Billion)
Table 93 Saudi Arabia Deep Tech Market Revenue Estimates & Forecast, By Enterprise Size, 2021 – 2033 (USD Billion)
Table 94 Saudi Arabia Deep Tech Market Revenue Estimates & Forecast, By Technology, 2021 – 2033 (USD Billion)
Table 95 Saudi Arabia Deep Tech Market Revenue Estimates & Forecast, By End Use, 2021 – 2033 (USD Billion)
Table 96 UAE Deep Tech Market Revenue Estimates & Forecast, By Deployment Model, 2021 – 2033 (USD Billion)
Table 97 UAE Deep Tech Market Revenue Estimates & Forecast, By Enterprise Size, 2021 – 2033 (USD Billion)
Table 98 UAE Deep Tech Market Revenue Estimates & Forecast, By Technology, 2021 – 2033 (USD Billion)
Table 99 UAE Deep Tech Market Revenue Estimates & Forecast, By End Use, 2021 – 2033 (USD Billion)
Table 100 South Africa Deep Tech Market Revenue Estimates & Forecast, By Deployment Model, 2021 – 2033 (USD Billion)
Table 101 South Africa Deep Tech Market Revenue Estimates & Forecast, By Enterprise Size, 2021 – 2033 (USD Billion)
Table 102 South Africa Deep Tech Market Revenue Estimates & Forecast, By Technology, 2021 – 2033 (USD Billion)
Table 103 South Africa Deep Tech Market Revenue Estimates & Forecast, By End Use, 2021 – 2033 (USD Billion)
List of Figures
Fig. 1 Deep tech market segmentation
Fig. 2 Information procurement
Fig. 3 Data analysis models
Fig. 4 Market formulation and validation
Fig. 5 Data validating & publishing
Fig. 6 Deep tech market snapshot
Fig. 7 Deep tech market segment snapshot
Fig. 8 Deep tech market competitive landscape snapshot
Fig. 9 Market research process
Fig. 10 Market driver relevance analysis (current & future impact)
Fig. 11 Market restraint relevance analysis (current & future impact)
Fig. 12 Deep tech market, by deployment model, key takeaways
Fig. 13 Deep tech market, by deployment model, market share, 2025 & 2033
Fig. 14 On-premises market estimates & forecasts, 2021 – 2033 (Revenue, USD Billion)
Fig. 15 Cloud-based market estimates & forecasts, 2021 – 2033 (Revenue, USD Billion)
Fig. 16 Hybrid market estimates & forecasts, 2021 – 2033 (Revenue, USD Billion)
Fig. 17 Deep tech market, by enterprise size, key takeaways
Fig. 18 Deep tech market, by enterprise size, market share, 2025 & 2033
Fig. 19 Small and medium enterprises market estimates & forecasts, 2021 – 2033 (Revenue, USD Billion)
Fig. 20 Large enterprises market estimates & forecasts, 2021 – 2033 (Revenue, USD Billion)
Fig. 21 Deep tech market, by technology, key takeaways
Fig. 22 Deep tech market, by technology, market share, 2025 & 2033
Fig. 23 Big data market estimates & forecasts, 2021 – 2033 (Revenue, USD Billion)
Fig. 24 Artificial intelligence market estimates & forecasts, 2021 – 2033 (Revenue, USD Billion)
Fig. 25 Blockchain market estimates & forecasts, 2021 – 2033 (Revenue, USD Billion)
Fig. 26 Robotics market estimates & forecasts, 2021 – 2033 (Revenue, USD Billion)
Fig. 27 Internet of things (IoT) market estimates & forecasts, 2021 – 2033 (Revenue, USD Billion)
Fig. 28 Quantum computing market estimates & forecasts, 2021 – 2033 (Revenue, USD Billion)
Fig. 29 Others market estimates & forecasts, 2021 – 2033 (Revenue, USD Billion)
Fig. 30 Deep tech market, by end use, key takeaways
Fig. 31 Deep tech market, by end use, market share, 2025 & 2033
Fig. 32 BFSI market estimates & forecasts, 2021 – 2033 (Revenue, USD Billion)
Fig. 33 IT & telecommunication market estimates & forecasts, 2021 – 2033 (Revenue, USD Billion)
Fig. 34 Automotive market estimates & forecasts, 2021 – 2033 (Revenue, USD Billion)
Fig. 35 Healthcare market estimates & forecasts, 2021 – 2033 (Revenue, USD Billion)
Fig. 36 Agriculture market estimates & forecasts, 2021 – 2033 (Revenue, USD Billion)
Fig. 37 Others market estimates & forecasts, 2021 – 2033 (Revenue, USD Billion)
Fig. 38 Regional marketplace: key takeaways
Fig. 39 North America deep tech market estimates & forecast, 2021 – 2033 (Revenue, USD Billion)
Fig. 40 U.S deep tech market estimates & forecast, 2021 – 2033 (Revenue, USD Billion)
Fig. 41 Canada deep tech market estimates & forecast, 2021 – 2033 (Revenue, USD Billion)
Fig. 42 Mexico deep tech market estimates & forecast, 2021 – 2033 (Revenue, USD Billion)
Fig. 43 Europe deep tech market estimates & forecast, 2021 – 2033 (Revenue, USD Billion)
Fig. 44 UK deep tech market estimates & forecast, 2021 – 2033 (Revenue, USD Billion)
Fig. 45 Germany deep tech market estimates & forecast, 2021 – 2033 (Revenue, USD Billion)
Fig. 46 France deep tech market estimates & forecast, 2021 – 2033 (Revenue, USD Billion)
Fig. 47 Asia Pacific deep tech market estimates & forecast, 2021 – 2033 (Revenue, USD Billion)
Fig. 48 China deep tech market estimates & forecast, 2021 – 2033 (Revenue, USD Billion)
Fig. 49 Japan deep tech market estimates & forecast, 2021 – 2033 (Revenue, USD Billion)
Fig. 50 India deep tech market estimates & forecast, 2021 – 2033 (Revenue, USD Billion)
Fig. 51 South Korea deep tech market estimates & forecast, 2021 – 2033 (Revenue, USD Billion)
Fig. 52 Australia deep tech market estimates & forecast, 2021 – 2033 (Revenue, USD Billion)
Fig. 53 Latin America deep tech market estimates & forecast, 2021 – 2033 (Revenue, USD Billion)
Fig. 54 Brazil deep tech market estimates & forecast, 2021 – 2033 (Revenue, USD Billion)
Fig. 55 MEA deep tech market estimates & forecast, 2021 – 2033 (Revenue, USD Billion)
Fig. 56 Saudi Arabia deep tech market estimates & forecast, 2021 – 2033 (Revenue, USD Billion)
Fig. 57 UAE deep tech market estimates & forecast, 2021 – 2033 (Revenue, USD Billion)
Fig. 58 South Africa deep tech market estimates & forecast, 2021 – 2033 (Revenue, USD Billion)
Fig. 59 Key company categorization
Fig. 60 Strategy framework