Stone Plastic Composite Flooring Market Size, Share & Trends Analysis Report By Product (Planks, Tiles), By End Use (Residential, Commercial, Industrial), By Region (North America, Europe, Asia Pacific, Central & South America, Middle East & Africa), And Segment Forecasts, 2026 - 2033
石材プラスチック複合床材(SPC)市場 - 製品別(板材、タイル)、用途別(住宅用、商業用、工業用)、地域別(北米、欧州、アジア太平洋、中南米、中東・アフリカ)、およびセグメント別予測による市場規模、成長と動向分析レポート 2026-2033年
| 出版 | Grand View Research |
| 出版年月 | 2026年02月 |
| ページ数 | 120 |
| 価格 | 記載以外のライセンスについてはお問合せください |
| シングルユーザ | USD 5,950 |
| 種別 | 英文調査報告書 |
| 商品番号 | SMR-17038 |

Stone Plastic Composite Flooring Market Summary
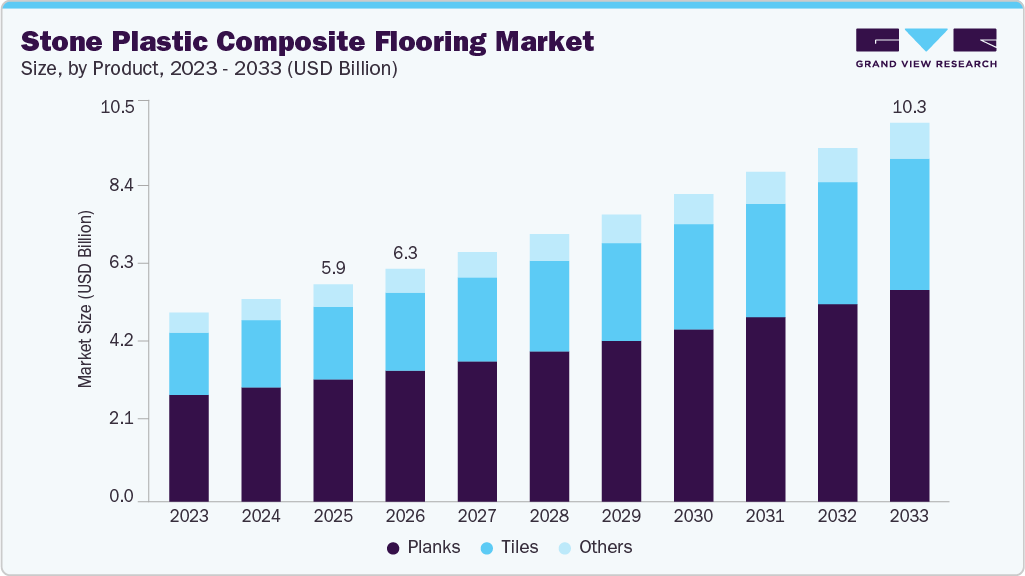
The global stone plastic composite flooring market size was estimated at USD 5.93 billion in 2025 and is projected to reach USD 10.34 billion by 2033, growing at a CAGR of 7.2% from 2026 to 2033. The growing preference for fast, disruption-free renovation solutions across residential and commercial buildings is driving the stone plastic composite (SPC) flooring market.
Key Market Trends & Insights
- Asia Pacific dominated the global stone plastic composite flooring industry with the largest revenue share of 39.42% in 2025.
- China was the leading market in the Asia Pacific region and captured around 40% of the revenue market share in 2025
- By product, the tiles segment is expected to grow at a considerable CAGR of 7.7% from 2026 to 2033 in terms of revenue.
- By end use, the commercial segment is expected to grow at a considerable CAGR of 7.6% from 2026 to 2033 in terms of revenue.
Market Size & Forecast
- 2025 Market Size: USD 5.93 Billion
- 2033 Projected Market Size: USD 10.34 Billion
- CAGR (2026 – 2033): 7.2%
- Asia Pacific: Largest market in 2025
SPC flooring allows quick installation over existing surfaces, reducing labor time, downtime, and overall project costs, which strongly appeals to property owners and facility managers. The market is experiencing a pronounced shift toward enhanced design realism and performance innovation.
Manufacturers are increasingly incorporating digital printing and textured surface technologies to closely replicate natural materials such as wood and stone, broadening aesthetic appeal in both residential and commercial segments. Click-lock installation systems and integrated features like UV coatings or anti-slip surfaces are also becoming standard, driving broader adoption as consumers demand both style and functional resilience.
Drivers, Opportunities & Restraints
Rapid urbanization and the attendant growth in residential and commercial construction are key drivers of SPC flooring demand. End users are prioritizing flooring solutions that offer waterproof performance, dimensional stability, and low maintenance, particularly in moisture-prone areas such as kitchens and bathrooms. This preference is reinforced by renovation activities in mature markets and infrastructure expansion in emerging regions, which together lengthen replacement cycles and increase new installations of SPC products.
Emerging economies offer significant growth opportunities for the SPC flooring market. Rising investments in affordable housing, smart city initiatives, and retail and hospitality infrastructure are expanding demand beyond traditional markets. Manufacturers can also capture value by developing eco-friendly and low-VOC SPC variants that align with tightening sustainability standards and green building certifications. Strategic expansion into semi-urban areas and tailored product offerings for institutional projects can unlock incremental revenue streams.
Price sensitivity among cost-conscious buyers remains a key restraint on market expansion, particularly in price-driven segments and developing regions. SPC flooring typically commands a premium over traditional vinyl options, which can suppress adoption in affordable housing projects. In addition, volatility in raw material costs, especially for PVC and mineral inputs, challenges manufacturers’ ability to maintain stable pricing and protect margins amidst fluctuating supply conditions.
Market Concentration & Characteristics
The market growth stage is moderate, and growth is accelerating. The market exhibits fragmentation, with key players dominating the industry landscape. Major companies such as Mohawk Industries, Inc., Shaw Industries Group, Inc., Tarkett S.A., Armstrong Flooring, Inc., Mannington Mills, Inc., Gerflor SAS, Forbo Holding AG, LX Hausys, Ltd., CFL Flooring, Power Dekor Group Co., Ltd., and others play a significant role in shaping the market dynamics. These leading players often drive innovation in the market, introducing new products and technologies to meet the industry’s evolving demands.
The SPC flooring market demonstrates high degrees of innovation driven by material engineering, digital design, and smart manufacturing. Leaders are investing in advanced core formulations that enhance impact resistance and dimensional stability, while digital printing and embossed-in-register technologies deliver highly realistic wood and stone aesthetics that appeal to premium segments. Recent developments include antimicrobial coatings, integrated acoustic underlays, and sensor-ready boards for smart buildings. Automation and AI-assisted quality control also reduce defects and improve consistency across large production runs, strengthening competitive positioning.
In the broader flooring landscape, SPC faces competition from several substitute materials that cater to divergent buyer priorities. Luxury vinyl plank and tile continue to attract cost-sensitive segments with lower initial price points and familiar visual appeal. Engineered hardwood offers authentic timber aesthetics valued in upscale residential projects, while ceramic and porcelain tiles remain preferred in wet or heavy-duty commercial applications due to established performance histories. Alternative resilient options such as WPC, rubber, and linoleum also serve niche demand where a softer underfoot feel or sustainability credentials are prioritized.
Product Insights
Planks dominated the market across all product segments in terms of revenue, accounting for a 56.30% market share in 2025, and is forecasted to grow at a 7.1% CAGR from 2026 to 2033. SPC planks are gaining traction because they closely mimic natural wood aesthetics while maintaining superior performance, including waterproofing and scratch resistance. Designers and developers are specifying planks for mid- to high-end residential and boutique commercial interiors due to their elongated format, which enhances space perception and design cohesion. The click-lock plank format also accelerates contractor scheduling, reducing on-site labor time and project costs compared to traditional sheet or tile products.
The tiles segment is anticipated to grow at a substantial CAGR of 7.7% through the forecast period. SPC tiles are increasingly preferred in modular and high-traffic commercial environments where uniform load distribution and design flexibility are priorities. Their square format supports efficient patterning in large spaces like retail showrooms, corporate lobbies, and institutional facilities, enabling designers to balance functionality with a premium aesthetic. Tiles also simplify replacement in service corridors and wet areas, reducing lifecycle maintenance expenses for facility managers and enhancing long-term operational planning.
End Use Insights
Residential dominated the market across the end use segmentation in terms of revenue, accounting for a 50.94% market share in 2025, and is forecast to grow at a 7.1% CAGR from 2026 to 2033. In the residential segment, demand for SPC flooring is driven by growing homeowner interest in low-maintenance, moisture-resistant flooring suitable for kitchens, bathrooms, and living areas. Renovation cycles in established housing markets and new builds in rapidly urbanizing regions are fueling uptake, as consumers prioritize flooring that combines durability with contemporary design. DIY installation through click-lock systems further boosts adoption among cost-conscious homeowners seeking professional aesthetics without installation premiums.
The commercial segment is expected to expand at a robust 7.6% CAGR over the forecast period in the market. Commercial demand for SPC flooring is underpinned by the material’s ability to withstand heavy foot traffic and rigorous cleaning protocols in offices, retail outlets, hospitality venues, and healthcare facilities. Specification by architects and interior designers reflects a need for durable surfaces that maintain appearance integrity under sustained use. In institutional settings, attributes such as slip resistance and hygienic surfaces align with regulatory requirements, driving broader integration into commercial construction and retrofit projects.
Key Stone Plastic Composite Flooring Company Insights
The stone plastic composite flooring industry is highly competitive, with several key players dominating the landscape. Major companies include EMohawk Industries, Inc., Shaw Industries Group, Inc., Tarkett S.A., Armstrong Flooring, Inc., Mannington Mills, Inc., Gerflor SAS, Forbo Holding AG, LX Hausys, Ltd., CFL Flooring, and Power Dekor Group Co., Ltd. The industry is characterized by a competitive landscape with several key players driving innovation and market growth. Major companies in this sector are investing heavily in research and development to enhance the performance, cost-effectiveness, and sustainability of their products.
Key Stone Plastic Composite Flooring Companies:
The following key companies have been profiled for this study on the stone plastic composite flooring market.
- Mohawk Industries, Inc.
- Shaw Industries Group, Inc.
- Tarkett S.A.
- Armstrong Flooring, Inc.
- Mannington Mills, Inc.
- Gerflor SAS
- Forbo Holding AG
- LX Hausys, Ltd.
- CFL Flooring
- Power Dekor Group Co., Ltd.
Recent Developments
- In October 2024, Republic Floor introduced its Light SPC rigid-core technology, targeting installers seeking lighter boards with retained durability. The launch positions the company to compete on ease of handling and faster installs for retrofit and commercial projects.
- In October 2024, Mohawk launched SolidTech R, an SPC line focused on recyclability and performance. The collection uses reclaimed plastics in the core and features enhanced scratch and waterproof warranties, addressing rising sustainability and durability requirements across retail and commercial segments.
Stone Plastic Composite Flooring Market Report Scope
| Report Attribute | Details |
| Market size value in 2026 | USD 6.35 billion |
| Revenue forecast in 2033 | USD 10.34 billion |
| Growth rate | CAGR of 7.2% from 2026 to 2033 |
| Historical data | 2021 – 2024 |
| Forecast period | 2026 – 2033 |
| Quantitative units | Revenue in USD million/billion, volume in kilotons, and CAGR from 2026 to 2033 |
| Report coverage | Revenue forecast, competitive landscape, growth factors, and trends |
| Report Segmentation | Product, end use, region |
| Regional scope | North America; Europe; Asia Pacific; Central & South America; Middle East & Africa |
| Country Scope | U.S.; Canada; Mexico; Germany; UK; France; Italy; China; India; Japan |
| Key companies profiled | Mohawk Industries, Inc.; Shaw Industries Group, Inc.; Tarkett S.A.; Armstrong Flooring, Inc.; Mannington Mills, Inc.; Gerflor SAS; Forbo Holding AG; LX Hausys, Ltd.; CFL Flooring; Power Dekor Group Co., Ltd. |
| Customization scope | Free report customization (equivalent to up to 8 analyst working days) with purchase. Addition or alteration to country, regional & segment scope |
Global Stone Plastic Composite Flooring Market Report Segmentation
This report forecasts revenue growth at the global, regional, and country levels and provides an analysis of the latest industry trends across sub-segments from 2021 to 2033. For this study, Grand View Research has segmented the global stone plastic composite flooring market report based on product, end use, and region:
- Product Outlook (Volume, Kilotons; Revenue, USD Million, 2021 – 2033)
- Planks
- Tiles
- Others
- End Use Outlook (Volume, Kilotons; Revenue, USD Million, 2021 – 2033)
- Residential
- Commercial
- Industrial
- Regional Outlook (Volume, Kilotons; Revenue, USD Million, 2021 – 2033)
- North America
- U.S.
- Canada
- Mexico
- Europe
- Germany
- UK
- France
- Italy
- Asia Pacific
- China
- India
- Japan
- Central & South America
- Middle East & Africa
- North America
Table of Contents
Chapter 1. Methodology and Scope
1.1. Market Segmentation & Scope
1.2. Market Definition
1.3. Information Procurement
1.3.1. Purchased Database
1.3.2. GVR’s Internal Database
1.3.3. Secondary Types & Third-Party Perspectives
1.3.4. Primary Research
1.4. Information Analysis
1.4.1. Data Analysis Models
1.5. Market Type & Data Visualization
1.6. Data Validation & Publishing
Chapter 2. Executive Summary
2.1. Market Insights
2.2. Segmental Outlook
2.3. Competitive Outlook
Chapter 3. Stone Plastic Composite Flooring Market Variables, Trends & Scope
3.1. Market Lineage Outlook
3.1.1. Parent Market Outlook
3.2. Penetration & Growth Prospect Mapping
3.3. Industry Value Chain Analysis
3.3.1. Profit Margin Analysis of Key Value Chain Participants
3.3.2. Raw Material Trends
3.3.3. Raw Material Price Analysis
3.4. Technology Overview
3.4.1. Commercial Production Technology
3.4.2. Roadmap of Technology Advancement, 2021 to 2030
3.5. Sustainability Trends
3.5.1. Recycling and Circular Economy
3.6. Average Price Trend Analysis, 2021 to 2033 (USD/kg)
3.6.1. Key Factors Influencing Pricing
3.6.2. Supply Demand Gap Analysis
3.7. Regulatory Framework
3.7.1. Policies and Incentive Plans
3.7.2. Standards and Compliances
3.7.3. Regulatory Impact Analysis
3.8. Market Dynamics
3.8.1. Market Driver Analysis
3.8.2. Market Restraint Analysis
3.8.3. Industry Challenges
3.9. Porter’s Five Forces Analysis
3.9.1. Supplier Power
3.9.2. Buyer Power
3.9.3. Substitution Threat
3.9.4. Threat from New Entrants
3.9.5. Competitive Rivalry
3.10. PESTEL Analysis
3.10.1. Political Landscape
3.10.2. Economic Landscape
3.10.3. Social Landscape
3.10.4. Technological Landscape
3.10.5. Environmental Landscape
3.10.6. Legal Landscape
Chapter 4. Stone Plastic Composite Flooring Market: Product Outlook Estimates & Forecasts
4.1. Stone Plastic Composite Flooring Market: Product Movement Analysis, 2025 & 2033
4.1.1. Planks
4.1.1.1. Market estimates and forecast, 2021 – 2033 (USD Million) (Kilotons)
4.1.2. Tiles
4.1.2.1. Market estimates and forecast, 2021 – 2033 (USD Million) (Kilotons)
4.1.3. Others
4.1.3.1. Market estimates and forecast, 2021 – 2033 (USD Million) (Kilotons)
Chapter 5. Stone Plastic Composite Flooring Market: End Use Outlook Estimates & Forecasts
5.1. Stone Plastic Composite Flooring Market: End Use Movement Analysis, 2025 & 2033
5.1.1. Residential
5.1.1.1. Market estimates and forecast, 2021 – 2033 (USD Million) (Kilotons)
5.1.2. Commercial
5.1.2.1. Market estimates and forecast, 2021 – 2033 (USD Million) (Kilotons)
5.1.3. Industrial
5.1.3.1. Market estimates and forecast, 2021 – 2033 (USD Million) (Kilotons)
Chapter 6. Stone Plastic Composite Flooring Market Regional Outlook Estimates & Forecasts
6.1. Regional Snapshot
6.2. Stone Plastic Composite Flooring Market: Regional Movement Analysis, 2025 & 2033
6.3. North America
6.3.1. Market estimates and forecast, 2021 – 2033 (USD Million) (Kilotons)
6.3.2. Market estimates and forecast, by end use, 2021 – 2033 (USD Million) (Kilotons)
6.3.3. Market estimates and forecast, by product, 2021 – 2033 (USD Million) (Kilotons)
6.3.4. U.S.
6.3.4.1. Market estimates and forecast, 2021 – 2033 (USD Million) (Kilotons)
6.3.4.2. Market estimates and forecast, by end use, 2021 – 2033 (USD Million) (Kilotons)
6.3.4.3. Market estimates and forecast, by product, 2021 – 2033 (USD Million) (Kilotons)
6.3.5. Canada
6.3.5.1. Market estimates and forecast, 2021 – 2033 (USD Million) (Kilotons)
6.3.5.2. Market estimates and forecast, by end use, 2021 – 2033 (USD Million) (Kilotons)
6.3.5.3. Market estimates and forecast, by product, 2021 – 2033 (USD Million) (Kilotons)
6.3.6. Mexico
6.3.6.1. Market estimates and forecast, 2021 – 2033 (USD Million) (Kilotons)
6.3.6.2. Market estimates and forecast, by end use, 2021 – 2033 (USD Million) (Kilotons)
6.3.6.3. Market estimates and forecast, by product, 2021 – 2033 (USD Million) (Kilotons)
6.4. Europe
6.4.1. Market estimates and forecast, 2021 – 2033 (USD Million) (Kilotons)
6.4.2. Market estimates and forecast, by end use, 2021 – 2033 (USD Million) (Kilotons)
6.4.3. Market estimates and forecast, by product, 2021 – 2033 (USD Million) (Kilotons)
6.4.4. Germany
6.4.4.1. Market estimates and forecast, 2021 – 2033 (USD Million) (Kilotons)
6.4.4.2. Market estimates and forecast, by end use, 2021 – 2033 (USD Million) (Kilotons)
6.4.4.3. Market estimates and forecast, by product, 2021 – 2033 (USD Million) (Kilotons)
6.4.5. UK
6.4.5.1. Market estimates and forecast, 2021 – 2033 (USD Million) (Kilotons)
6.4.5.2. Market estimates and forecast, by end use, 2021 – 2033 (USD Million) (Kilotons)
6.4.5.3. Market estimates and forecast, by product, 2021 – 2033 (USD Million) (Kilotons)
6.4.6. France
6.4.6.1. Market estimates and forecast, 2021 – 2033 (USD Million) (Kilotons)
6.4.6.2. Market estimates and forecast, by end use, 2021 – 2033 (USD Million) (Kilotons)
6.4.6.3. Market estimates and forecast, by product, 2021 – 2033 (USD Million) (Kilotons)
6.4.7. Italy
6.4.7.1. Market estimates and forecast, 2021 – 2033 (USD Million) (Kilotons)
6.4.7.2. Market estimates and forecast, by end use, 2021 – 2033 (USD Million) (Kilotons)
6.4.7.3. Market estimates and forecast, by product, 2021 – 2033 (USD Million) (Kilotons)
6.5. Asia Pacific
6.5.1. Market estimates and forecast, 2021 – 2033 (USD Million) (Kilotons)
6.5.2. Market estimates and forecast, by end use, 2021 – 2033 (USD Million) (Kilotons)
6.5.3. Market estimates and forecast, by product, 2021 – 2033 (USD Million) (Kilotons)
6.5.4. China
6.5.4.1. Market estimates and forecast, 2021 – 2033 (USD Million) (Kilotons)
6.5.4.2. Market estimates and forecast, by end use, 2021 – 2033 (USD Million) (Kilotons)
6.5.4.3. Market estimates and forecast, by product, 2021 – 2033 (USD Million) (Kilotons)
6.5.5. India
6.5.5.1. Market estimates and forecast, 2021 – 2033 (USD Million) (Kilotons)
6.5.5.2. Market estimates and forecast, by end use, 2021 – 2033 (USD Million) (Kilotons)
6.5.5.3. Market estimates and forecast, by product, 2021 – 2033 (USD Million) (Kilotons)
6.5.6. Japan
6.5.6.1. Market estimates and forecast, 2021 – 2033 (USD Million) (Kilotons)
6.5.6.2. Market estimates and forecast, by end use, 2021 – 2033 (USD Million) (Kilotons)
6.5.6.3. Market estimates and forecast, by product, 2021 – 2033 (USD Million) (Kilotons)
6.6. Central & South America
6.6.1. Market estimates and forecast, 2021 – 2033 (USD Million) (Kilotons)
6.6.2. Market estimates and forecast, by end use, 2021 – 2033 (USD Million) (Kilotons)
6.6.3. Market estimates and forecast, by product, 2021 – 2033 (USD Million) (Kilotons)
6.7. Middle East & Africa
6.7.1. Market estimates and forecast, 2021 – 2033 (USD Million) (Kilotons)
6.7.2. Market estimates and forecast, by end use, 2021 – 2033 (USD Million) (Kilotons)
6.7.3. Market estimates and forecast, by product, 2021 – 2033 (USD Million) (Kilotons)
Chapter 7. Competitive Landscape
7.1. Recent Developments & Impact Analysis, By Key Market Participants
7.2. Vendor Landscape
7.2.1. Company categorization
7.2.2. List of Key Distributors and Channel Partners
7.2.3. List of Potential Customers/End-users
7.3. Competitive Dynamics
7.3.1. Company Market Share Analysis & Market Positioning
7.3.2. Competitive Benchmarking
7.3.3. Strategy Mapping
7.3.4. Heat Map Analysis
7.4. Company Profiles/Listing
7.4.1. Mohawk Industries, Inc.
7.4.1.1. Participant’s overview
7.4.1.2. Financial performance
7.4.1.3. Product benchmarking
7.4.2. Shaw Industries Group, Inc.
7.4.3. Tarkett S.A.
7.4.4. Armstrong Flooring, Inc.
7.4.5. Mannington Mills, Inc.
7.4.6. Gerflor SAS
7.4.7. Forbo Holding AG
7.4.8. LX Hausys, Ltd.
7.4.9. CFL Flooring
7.4.10. Power Dekor Group Co., Ltd.
List of Tables
Table 1 List of Abbreviations
Table 2 Product market estimates and forecasts, 2021 – 2033 (USD Million) (Kilotons)
Table 3 Planks market estimates and forecasts, 2021 – 2033 (USD Million) (Kilotons)
Table 4 Tiles market estimates and forecasts, 2021 – 2033 (USD Million) (Kilotons)
Table 5 Others market estimates and forecasts, 2021 – 2033 (USD Million) (Kilotons)
Table 6 End Use market estimates and forecasts, 2021 – 2033 (USD Million) (Kilotons)
Table 7 Residential market estimates and forecasts, 2021 – 2033 (USD Million) (Kilotons)
Table 8 Commercial market estimates and forecasts, 2021 – 2033 (USD Million) (Kilotons)
Table 9 Industrial market estimates and forecasts, 2021 – 2033 (USD Million) (Kilotons)
Table 10 North America stone plastic composite flooring market estimates and forecasts, by end use, 2021 – 2033 (USD Million) (Kilotons)
Table 11 North America stone plastic composite flooring market estimates and forecasts, by type, 2021 – 2033 (USD Million) (Kilotons)
Table 12 U.S stone plastic composite flooring market estimates and forecasts, by end use, 2021 – 2033 (USD Million) (Kilotons)
Table 13 U.S stone plastic composite flooring market estimates and forecasts, by type, 2021 – 2033 (USD Million) (Kilotons)
Table 14 Canada stone plastic composite flooring market estimates and forecasts, by end use, 2021 – 2033 (USD Million) (Kilotons)
Table 15 Canada stone plastic composite flooring market estimates and forecasts, by type, 2021 – 2033 (USD Million) (Kilotons)
Table 16 Mexico stone plastic composite flooring market estimates and forecasts, by end use, 2021 – 2033 (USD Million) (Kilotons)
Table 17 Mexico stone plastic composite flooring market estimates and forecasts, by type, 2021 – 2033 (USD Million) (Kilotons)
Table 18 Europe stone plastic composite flooring market estimates and forecasts, by end use, 2021 – 2033 (USD Million) (Kilotons)
Table 19 Europe stone plastic composite flooring market estimates and forecasts, by type, 2021 – 2033 (USD Million) (Kilotons)
Table 20 Germany stone plastic composite flooring market estimates and forecasts, by end use, 2021 – 2033 (USD Million) (Kilotons)
Table 21 Germany stone plastic composite flooring market estimates and forecasts, by type, 2021 – 2033 (USD Million) (Kilotons)
Table 22 UK stone plastic composite flooring market estimates and forecasts, by end use, 2021 – 2033 (USD Million) (Kilotons)
Table 23 UK stone plastic composite flooring market estimates and forecasts, by type, 2021 – 2033 (USD Million) (Kilotons)
Table 24 France stone plastic composite flooring market estimates and forecasts, by end use, 2021 – 2033 (USD Million) (Kilotons)
Table 25 France stone plastic composite flooring market estimates and forecasts, by type, 2021 – 2033 (USD Million) (Kilotons)
Table 26 Italy stone plastic composite flooring market estimates and forecasts, by end use, 2021 – 2033 (USD Million) (Kilotons)
Table 27 Italy stone plastic composite flooring market estimates and forecasts, by type, 2021 – 2033 (USD Million) (Kilotons)
Table 28 Asia Pacific stone plastic composite flooring market estimates and forecasts, by end use, 2021 – 2033 (USD Million) (Kilotons)
Table 29 Asia Pacific stone plastic composite flooring market estimates and forecasts, by type, 2021 – 2033 (USD Million) (Kilotons)
Table 30 China stone plastic composite flooring market estimates and forecasts, by end use, 2021 – 2033 (USD Million) (Kilotons)
Table 31 China stone plastic composite flooring market estimates and forecasts, by type, 2021 – 2033 (USD Million) (Kilotons)
Table 32 India stone plastic composite flooring market estimates and forecasts, by end use, 2021 – 2033 (USD Million) (Kilotons)
Table 33 India stone plastic composite flooring market estimates and forecasts, by type, 2021 – 2033 (USD Million) (Kilotons)
Table 34 Japan stone plastic composite flooring market estimates and forecasts, by end use, 2021 – 2033 (USD Million) (Kilotons)
Table 35 Japan stone plastic composite flooring market estimates and forecasts, by type, 2021 – 2033 (USD Million) (Kilotons)
Table 36 Central & South America stone plastic composite flooring market estimates and forecasts, by end use, 2021 – 2033 (USD Million) (Kilotons)
Table 37 Central & South America stone plastic composite flooring market estimates and forecasts, by type, 2021 – 2033 (USD Million) (Kilotons)
Table 38 Middle East & Africa stone plastic composite flooring market estimates and forecasts, by end use, 2021 – 2033 (USD Million) (Kilotons)
Table 39 Middle East & Africa stone plastic composite flooring market estimates and forecasts, by type, 2021 – 2033 (USD Million) (Kilotons)
List of Figures
Fig. 1 Market segmentation
Fig. 2 Information procurement
Fig. 3 Data Analysis Models
Fig. 4 Market Application and Validation
Fig. 5 Market snapshot
Fig. 6 Segmental outlook- Product, and End Use
Fig. 7 Competitive outlook
Fig. 8 Value chain analysis
Fig. 9 Market dynamics
Fig. 10 Porter’s Analysis
Fig. 11 PESTEL Analysis
Fig. 12 Stone Plastic Composite Flooring Market, by Product: Key Takeaways
Fig. 13 Stone Plastic Composite Flooring Market, by Product: Market share, 2025 & 2033
Fig. 14 Stone Plastic Composite Flooring Market, by End Use: Key Takeaways
Fig. 15 Stone Plastic Composite Flooring Market, by End Use: Market share, 2025 & 2033
Fig. 16 Stone Plastic Composite Flooring Market, by Region: Key Takeaways
Fig. 17 Stone Plastic Composite Flooring Market, by Region: Market share, 2025 & 2033