Liquid Handling System Market Size, Share & Trends Analysis Report By Type (Manual Liquid Handling, Semi-automated Liquid Handling, Automated Liquid Handling), By Product (Pipettes, Burettes, Workstations), By Application, By Region, And Segment Forecasts, 2026 - 2033
液体処理システム市場 - タイプ別(手動液体処理、半自動液体処理、自動液体処理)、製品別(ピペット、ビュレット、ワークステーション)、用途別、地域、セグメント別予測による市場規模、成長と動向分析レポート 2026-2033年
| 出版 | Grand View Research |
| 出版年月 | 2026年02月 |
| ページ数 | 100 |
| 価格 | 記載以外のライセンスについてはお問合せください |
| シングルユーザ | USD 5,950 |
| 種別 | 英文調査報告書 |
| 商品番号 | SMR-16591 |

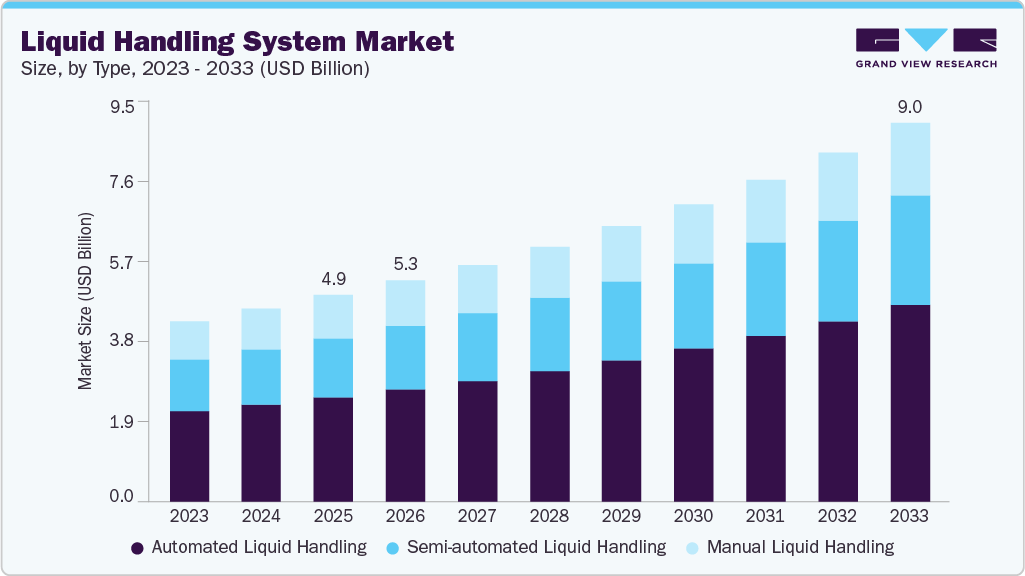
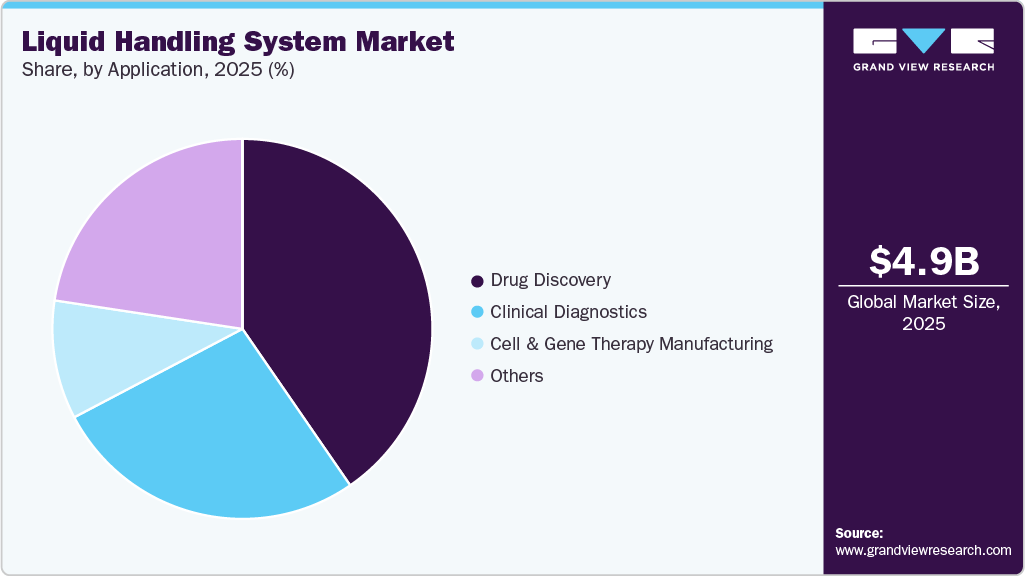
世界の液体処理システム市場規模は、2025年には49億1,000万米ドルと推定され、2033年には90億30万米ドルに達すると予測されており、2026年から2033年にかけて年平均成長率(CAGR)8.0%に達するとGrand View Researchでは予測しています。
液体処理システム業界は、主に医薬品およびバイオテクノロジー研究の急速な成長によって牽引されています。
主要な市場動向と洞察
- 北米は、2025年に世界の液体処理システム市場において最大の収益シェア43.1%を占め、市場を牽引しました。
- 米国の液体処理システム産業は、2025年に北米で最大の市場収益シェアを占めました。
- タイプ別に見ると、自動液体処理セグメントは、2026年から2033年にかけて年平均成長率(CAGR)8.4%で最も高い成長が見込まれています。
- 製品別に見ると、ワークステーションセグメントは、2026年から2033年にかけて年平均成長率8.6%で最も高い成長が見込まれています。
- 用途別に見ると、細胞・遺伝子治療製造セグメントは、2026年から2033年にかけて年平均成長率8.7%で最も高い成長が見込まれています。
創薬活動の活発化、ハイスループットスクリーニングの普及、そして研究開発費の増加に伴い、研究室ではより高速かつ高精度な液体処理ソリューションの導入が進んでいます。自動化は人的ミスの削減と再現性の向上に貢献し、複雑な実験において極めて重要です。
また、臨床診断や先進治療分野における需要の高まりも、自動化システムの導入を促進する大きな要因となっています。検査件数の増加、精密医療、細胞・遺伝子治療の製造においては、一貫性のある汚染のない液体処理が不可欠です。研究室は効率性と処理時間の改善も求められており、これが自動化システムへの投資を後押ししています。さらに、消耗品に対する継続的な需要は、市場参入企業にとって安定した長期的な収益成長の基盤となります。
Liquid Handling System Market Summary
The global liquid handling system market size was estimated at USD 4,910.0 million in 2025 and is projected to reach USD 9,000.3 million by 2033, grow at a CAGR of 8.0% from 2026 to 2033. The liquid handling system industry is driven mainly by the rapid growth of pharmaceutical and biotechnology research.
Key Market Trends & Insights
- North America dominated the global liquid handling system market with the largest revenue share of 43.1% in 2025.
- The liquid handling system industry in the U.S. accounted for the largest market revenue share in North America in 2025.
- By type, the automated liquid handling segment is expected to grow at the fastest CAGR of 8.4% from 2026 to 2033.
- By product, the workstations segment is expected to grow at the fastest CAGR of 8.6% from 2026 to 2033.
- By application, the cell & gene therapy manufacturing segment is expected to grow at the fastest CAGR of 8.7% from 2026 to 2033.
Market Size & Forecast
- 2025 Market Size: USD 4,910.0 Million
- 2033 Projected Market Size: USD 9,000.3 Million
- CAGR (2026-2033): 8.0%
- North America: Largest market in 2025
- Asia Pacific: Fastest growing market
Increasing drug discovery activities, high-throughput screening, and rising R&D spending are driving labs to adopt faster, more accurate liquid-handling solutions. Automation helps reduce human error and improves reproducibility, which is critical for complex experiments.
Another key driver is the rising demand from clinical diagnostics and advanced therapies. Growing test volumes, precision medicine, and cell & gene therapy manufacturing require consistent and contamination-free liquid handling. Labs are also under pressure to improve efficiency and turnaround times, which is encouraging investment in automated systems. In addition, recurring demand for consumables provides stable, long-term revenue growth for market players.
Type Insights
The automated liquid handling segment led the market with the largest revenue share of 50.6% in 2025, due to its ability to deliver high accuracy, consistency, and throughput. Large pharmaceutical, biotechnology, and diagnostic laboratories preferred automated systems to manage complex and repetitive workflows. These systems reduced manual errors and improved data reliability, which was critical in regulated environments. Continuous advancements in robotics and software strengthened their leading market position.
The semi-automated liquid handling segment is anticipated to grow at the fastest CAGR during the forecast period, as laboratories sought a balance between cost and efficiency. These systems appealed to mid-sized labs that wanted higher productivity without full automation. They reduced manual effort while preserving workflow flexibility. Increasing upgrades from manual tools to semi-automated solutions supported strong segment growth.
Product Insights
The workstations segment led the market with the largest revenue share of 38.4% in 2025, as they supported fully automated, high-throughput laboratory workflows. Large pharmaceutical and biotechnology laboratories adopted these systems to improve efficiency and reduce processing time. Integrated software and robotics enabled consistent, reproducible liquid handling across experiments. Their ability to handle complex applications strengthened their leading market share.
The consumables segment is anticipated to grow at the fastest CAGR during the forecast period, driven by their repeated, continuous use in daily laboratory operations. Tips, plates, and other disposable items were required for every liquid handling task, driving steady demand. Growth in diagnostic testing and research activities increased overall consumption volumes. Their recurring nature made consumables a fast-growing and reliable revenue segment.
Application Insights
The drug discovery segment led the market with the largest revenue share of40.4% in 2025, driven by the extensive use of liquid handling systems in screening and assay development. Pharmaceutical companies relied on automated platforms to manage large sample volumes with high precision. The need for faster timelines and reproducible results supported strong adoption. Continuous investment in R&D kept this application segment at the forefront.
liquid-handling-system-market-share
The cell and gene therapy manufacturing segment is anticipated to grow at the fastest CAGR during the forecast period. These workflows required highly precise, contamination-free liquid-handling processes. Growing clinical trials and the commercialization of advanced therapies have increased demand for specialized systems. Scaling up production further accelerated the adoption of automated and semi-automated solutions.
Key Liquid Handling System Company Insights
Some of the key players operating in the market include Thermo Fisher Scientific Inc., Danaher Corporation, and PerkinElmer.
- Thermo Fisher Scientific plays a major role in the liquid handling systems industry through its wide range of manual, electronic, and automated solutions. The company supports drug discovery and clinical diagnostics through integrated liquid-handling workstations. It focuses on automation, software integration, and workflow efficiency to meet laboratory needs. Its strong consumables portfolio ensures recurring demand across end users. Deep presence in pharma and biotech labs strengthens its market position.
- Danaher Corporation is an important participant in the market, mainly through its Beckman Coulter Life Sciences business. The company addresses demand for automated and semi-automated liquid handling in genomics and diagnostics. It emphasizes precision, reproducibility, and scalable platforms for regulated lab environments. Its systems support high-volume and complex workflows. Ongoing product improvements strengthen its competitive position.
Key Liquid Handling System Companies:
The following key companies have been profiled for this study on the liquid handling system market
- Thermo Fisher Scientific Inc.
- Danaher Corporation
- PerkinElmer
- Mettler-Toledo International Inc.
- QIAGEN
- Corning Incorporated
- Sartorius AG
- Lonza
- Tecan Trading AG
- Eppendorf SE
- Beckman Coulter
- Agilent Technologies
- Aurora Biomed Ltd.
- Gilson Inc.
- BRAND GmbH + Co. KG
Recent Developments
- In December 2025,Beckman Coulter Life Sciences launches the Biomek i3 benchtop liquid handler to support automated laboratory workflows. The system targets low to medium-throughput applications such as genomics and drug discovery. Its compact design and flexible deck layout make automation accessible for space-limited labs. User-friendly software helps reduce manual handling and improves overall workflow efficiency.
- In August 2025, Thermo Fisher Scientific Inc. opens a new manufacturing center of excellence in North Carolina to expand its consumables production capacity. The facility focuses on high-volume manufacturing of pipette tips to support research, diagnostics, and pharmaceutical applications. It uses advanced automation to improve the efficiency and reliability of supply. The site also strengthens local manufacturing capabilities and supports long-term market demand.
Liquid Handling System Market Report Scope
| Report Attribute | Details |
| Market size value in 2026 | USD 5,250.6 million |
| Revenue forecast in 2033 | USD 9,000.3 million |
| Growth rate | CAGR of 8.0% from 2026 to 2033 |
| Base year for estimation | 2025 |
| Historical data | 2021 – 2024 |
| Forecast period | 2026 – 2033 |
| Quantitative units | Revenue in USD million/billion, and CAGR from 2026 to 2033 |
| Report coverage | Revenue forecast, company ranking, competitive landscape, growth factors, and trends |
| Segments covered | Type, product, application, region. |
| Regional scope | North America; Europe; Asia Pacific; Latin America; Middle East & Africa |
| Country scope | U.S.; Canada; Mexico; UK; Germany; France; Spain; Italy; China; Japan; India; Australia; South Korea; Brazil; Argentina; Saudi Arabia; UAE; South Africa |
| Key companies profiled | Thermo Fisher Scientific Inc.; Danaher Corporation; PerkinElmer; Mettler-Toledo International Inc.; QIAGEN; Corning Incorporated; Sartorius AG; Lonza; Tecan Trading AG; Eppendorf SE; Beckman Coulter; Agilent Technologies; Aurora Biomed Ltd.; Gilson Inc.; BRAND GmbH + Co. KG |
| Customization scope | Free report customization (equivalent up to 8 analysts working days) with purchase. Addition or alteration to country, regional & segment scope. |
Global Liquid Handling System Market Report Segmentation
This report forecasts revenue growth at global, regional, and country levels and provides an analysis of the latest industry trends in each of the sub-segments from 2021 to 2033. For this study, Grand View Research has segmented the global liquid handling system market report based on type,product, application and region.
- Type Outlook (Revenue, USD Million, 2021 – 2033)
- Manual Liquid Handling
- Semi-automated Liquid Handling
- Automated Liquid Handling
- Product Outlook (Revenue, USD Million, 2021 – 2033)
- Pipettes
- Burettes
- Workstations
- Consumables
- Other
- Application Outlook (Revenue, USD Million, 2021 – 2033)
- Drug Discovery
- Clinical Diagnostics
- Cell & Gene Therapy Manufacturing
- Others
- Regional Outlook (Revenue, USD Million, 2021 – 2033)
- North America
- U.S.
- Canada
- Mexico
- Europe
- Germany
- France
- Italy
- Spain
- UK
- Asia Pacific
- China
- India
- Japan
- South Korea
- Australia
- Latin America
- Brazil
- Argentina
- Middle East and Africa
- Saudi Arabia
- UAE
- South Africa
- North America
Table of Contents
Chapter 1. Methodology and Scope
1.1. Market Segmentation & Scope
1.2. Market Definition
1.3. Information Procurement
1.3.1. Purchased Database
1.3.2. GVR’s Internal Database
1.3.3. Secondary Sources & Third-Party Perspectives
1.3.4. Primary Research
1.4. Information Analysis
1.4.1. Data Analysis Models
1.5. Market Formulation & Data Visualization
1.6. Data Validation & Publishing
Chapter 2. Executive Summary
2.1. Market Snapshot
2.2. Segment Snapshot
2.3. Competitive Landscape Snapshot
Chapter 3. Global Liquid Handling System Market Variables, Trends & Scope
3.1. Market Concentration & Growth Prospect Mapping
3.2. Industry Value Chain Analysis
3.2.1. Raw Material Outlook
3.2.2. Manufacturer Outlook
3.2.3. Distribution Outlook
3.2.4. End User Outlook
3.3. Regulatory Framework
3.4. Technology Overview
3.5. Market Dynamics
3.5.1. Market Driver Analysis
3.5.2. Market Restraint Analysis
3.5.3. Market Challenges Analysis
3.5.4. Market Opportunity Analysis
3.6. Economic Mega-Trend Analysis
3.7. Industry Analysis Tools
3.7.1. Porter’s Five Forces Analysis
3.7.2. Macro-environmental Analysis
Chapter 4. Global Liquid Handling System Market: Type Estimates & Trend Analysis
4.1. Type Movement Analysis & Market Share, 2025 & 2033
4.2. Global Liquid Handling System Market Estimates & Forecast, By Type, 2021 to 2033 (USD Million)
4.3. Manual Liquid Handling
4.3.1. Market Revenue Estimates and Forecasts, 2021 – 2033 (USD Million)
4.4. Semi-automated Liquid Handling
4.4.1. Market Revenue Estimates and Forecasts, 2021 – 2033 (USD Million)
4.5. Automated Liquid Handling
4.5.1. Market Revenue Estimates and Forecasts, 2021 – 2033 (USD Million)
Chapter 5. Global Liquid Handling System Market: Product Estimates & Trend Analysis
5.1. Product Movement Analysis & Market Share, 2025 & 2033
5.2. Global Liquid Handling System Market Estimates & Forecast, By Distribution Channel, 2021 to 2033 (USD Million)
5.3. Pipettes
5.3.1. Market Revenue Estimates and Forecasts, 2021 – 2033 (USD Million)
5.4. Burettes
5.4.1. Market Revenue Estimates and Forecasts, 2021 – 2033 (USD Million)
5.5. Workstations
5.5.1. Market Revenue Estimates and Forecasts, 2021 – 2033 (USD Million)
5.6. Consumables
5.6.1. Market Revenue Estimates and Forecasts, 2021 – 2033 (USD Million)
5.7. Other
5.7.1. Market Revenue Estimates and Forecasts, 2021 – 2033 (USD Million)
Chapter 6. Global Liquid Handling System Market: Application Estimates & Trend Analysis
6.1. Application Movement Analysis & Market Share, 2025 & 2033
6.2. Global Liquid Handling System Market Estimates & Forecast, By Application, 2021 to 2033 (USD Million)
6.3. Drug Discovery
6.3.1. Market Revenue Estimates and Forecasts, 2021 – 2033 (USD Million)
6.4. Clinical Diagnostics
6.4.1. Market Revenue Estimates and Forecasts, 2021 – 2033 (USD Million)
6.5. Cell & Gene Therapy Manufacturing
6.5.1. Market Revenue Estimates and Forecasts, 2021 – 2033 (USD Million)
6.6. Others
6.6.1. Market Revenue Estimates and Forecasts, 2021 – 2033 (USD Million)
Chapter 7. Global Liquid Handling System Market: Regional Estimates & Trend Analysis
7.1. Regional Movement Analysis & Market Share, 2025 & 2033
7.2. North America
7.2.1. Market Estimates & Forecast, 2021 – 2033 (USD Million)
7.2.2. Market estimates & forecast, by type, 2021 – 2033 (USD Million)
7.2.3. Market estimates & forecast, by product, 2021 – 2033 (USD Million)
7.2.4. Market estimates & forecast, by application, 2021 – 2033 (USD Million)
7.2.5. U.S.
7.2.5.1. Key country dynamics
7.2.5.2. Market Estimates & Forecast, 2021 – 2033 (USD Million)
7.2.5.3. Market estimates & forecast, by type, 2021 – 2033 (USD Million)
7.2.5.4. Market estimates & forecast, by product, 2021 – 2033 (USD Million)
7.2.5.5. Market estimates & forecast, by application, 2021 – 2033 (USD Million)
7.2.6. Canada
7.2.6.1. Key country dynamics
7.2.6.2. Market Estimates & Forecast, 2021 – 2033 (USD Million)
7.2.6.3. Market estimates & forecast, by type, 2021 – 2033 (USD Million)
7.2.6.4. Market estimates & forecast, by product, 2021 – 2033 (USD Million)
7.2.6.5. Market estimates & forecast, by application, 2021 – 2033 (USD Million)
7.2.7. Mexico
7.2.7.1. Key country dynamics
7.2.7.2. Market Estimates & Forecast, 2021 – 2033 (USD Million)
7.2.7.3. Market estimates & forecast, by type, 2021 – 2033 (USD Million)
7.2.7.4. Market estimates & forecast, by product, 2021 – 2033 (USD Million)
7.2.7.5. Market estimates & forecast, by application, 2021 – 2033 (USD Million)
7.3. Europe
7.3.1. Market Estimates & Forecast, 2021 – 2033 (USD Million)
7.3.2. Market estimates & forecast, by type, 2021 – 2033 (USD Million)
7.3.3. Market estimates & forecast, by product, 2021 – 2033 (USD Million)
7.3.4. Market estimates & forecast, by application, 2021 – 2033 (USD Million)
7.3.5. Germany
7.3.5.1. Key country dynamics
7.3.5.2. Market Estimates & Forecast, 2021 – 2033 (USD Million)
7.3.5.3. Market estimates & forecast, by type, 2021 – 2033 (USD Million)
7.3.5.4. Market estimates & forecast, by product, 2021 – 2033 (USD Million)
7.3.5.5. Market estimates & forecast, by application, 2021 – 2033 (USD Million)
7.3.6. France
7.3.6.1. Key country dynamics
7.3.6.2. Market Estimates & Forecast, 2021 – 2033 (USD Million)
7.3.6.3. Market estimates & forecast, by type, 2021 – 2033 (USD Million)
7.3.6.4. Market estimates & forecast, by product, 2021 – 2033 (USD Million)
7.3.6.5. Market estimates & forecast, by application, 2021 – 2033 (USD Million)
7.3.7. UK
7.3.7.1. Key country dynamics
7.3.7.2. Market Estimates & Forecast, 2021 – 2033 (USD Million)
7.3.7.3. Market estimates & forecast, by type, 2021 – 2033 (USD Million)
7.3.7.4. Market estimates & forecast, by product, 2021 – 2033 (USD Million)
7.3.7.5. Market estimates & forecast, by application, 2021 – 2033 (USD Million)
7.3.8. Italy
7.3.8.1. Key country dynamics
7.3.8.2. Market Estimates & Forecast, 2021 – 2033 (USD Million)
7.3.8.3. Market estimates & forecast, by type, 2021 – 2033 (USD Million)
7.3.8.4. Market estimates & forecast, by product, 2021 – 2033 (USD Million)
7.3.8.5. Market estimates & forecast, by application, 2021 – 2033 (USD Million)
7.3.9. Spain
7.3.9.1. Key country dynamics
7.3.9.2. Market Estimates & Forecast, 2021 – 2033 (USD Million)
7.3.9.3. Market estimates & forecast, by type, 2021 – 2033 (USD Million)
7.3.9.4. Market estimates & forecast, by product, 2021 – 2033 (USD Million)
7.3.9.5. Market estimates & forecast, by application, 2021 – 2033 (USD Million)
7.4. Asia Pacific
7.4.1. Market Estimates & Forecast, 2021 – 2033 (USD Million)
7.4.2. Market estimates & forecast, by type, 2021 – 2033 (USD Million)
7.4.3. Market estimates & forecast, by product, 2021 – 2033 (USD Million)
7.4.4. Market estimates & forecast, by application, 2021 – 2033 (USD Million)
7.4.5. China
7.4.5.1. Key country dynamics
7.4.5.2. Market Estimates & Forecast, 2021 – 2033 (USD Million)
7.4.5.3. Market estimates & forecast, by type, 2021 – 2033 (USD Million)
7.4.5.4. Market estimates & forecast, by product, 2021 – 2033 (USD Million)
7.4.5.5. Market estimates & forecast, by application, 2021 – 2033 (USD Million)
7.4.6. India
7.4.6.1. Key country dynamics
7.4.6.2. Market Estimates & Forecast, 2021 – 2033 (USD Million)
7.4.6.3. Market estimates & forecast, by type, 2021 – 2033 (USD Million)
7.4.6.4. Market estimates & forecast, by product, 2021 – 2033 (USD Million)
7.4.6.5. Market estimates & forecast, by application, 2021 – 2033 (USD Million)
7.4.7. Japan
7.4.7.1. Key country dynamics
7.4.7.2. Market Estimates & Forecast, 2021 – 2033 (USD Million)
7.4.7.3. Market estimates & forecast, by type, 2021 – 2033 (USD Million)
7.4.7.4. Market estimates & forecast, by product, 2021 – 2033 (USD Million)
7.4.7.5. Market estimates & forecast, by application, 2021 – 2033 (USD Million)
7.4.8. Australia
7.4.8.1. Key country dynamics
7.4.8.2. Market Estimates & Forecast, 2021 – 2033 (USD Million)
7.4.8.3. Market estimates & forecast, by type, 2021 – 2033 (USD Million)
7.4.8.4. Market estimates & forecast, by product, 2021 – 2033 (USD Million)
7.4.8.5. Market estimates & forecast, by application, 2021 – 2033 (USD Million)
7.4.9. South Korea
7.4.9.1. Key country dynamics
7.4.9.2. Market Estimates & Forecast, 2021 – 2033 (USD Million)
7.4.9.3. Market estimates & forecast, by type, 2021 – 2033 (USD Million)
7.4.9.4. Market estimates & forecast, by product, 2021 – 2033 (USD Million)
7.4.9.5. Market estimates & forecast, by application, 2021 – 2033 (USD Million)
7.5. Latin America
7.5.1. Market Estimates & Forecast, 2021 – 2033 (USD Million)
7.5.2. Market estimates & forecast, by type, 2021 – 2033 (USD Million)
7.5.3. Market estimates & forecast, by product, 2021 – 2033 (USD Million)
7.5.4. Market estimates & forecast, by application, 2021 – 2033 (USD Million)
7.5.5. Brazil
7.5.5.1. Key country dynamics
7.5.5.2. Market Estimates & Forecast, 2021 – 2033 (USD Million)
7.5.5.3. Market estimates & forecast, by type, 2021 – 2033 (USD Million)
7.5.5.4. Market estimates & forecast, by product, 2021 – 2033 (USD Million)
7.5.5.5. Market estimates & forecast, by application, 2021 – 2033 (USD Million)
7.5.6. Argentina
7.5.6.1. Key country dynamics
7.5.6.2. Market Estimates & Forecast, 2021 – 2033 (USD Million)
7.5.6.3. Market estimates & forecast, by type, 2021 – 2033 (USD Million)
7.5.6.4. Market estimates & forecast, by product, 2021 – 2033 (USD Million)
7.5.6.5. Market estimates & forecast, by application, 2021 – 2033 (USD Million)
7.6. Middle East & Africa
7.6.1. Market Estimates & Forecast, 2021 – 2033 (USD Million)
7.6.2. Market estimates & forecast, by type, 2021 – 2033 (USD Million)
7.6.3. Market estimates & forecast, by product, 2021 – 2033 (USD Million)
7.6.4. Market estimates & forecast, by application, 2021 – 2033 (USD Million)
7.6.5. Saudi Arabia
7.6.5.1. Key country dynamics
7.6.5.2. Market Estimates & Forecast, 2021 – 2033 (USD Million)
7.6.5.3. Market estimates & forecast, by type, 2021 – 2033 (USD Million)
7.6.5.4. Market estimates & forecast, by product, 2021 – 2033 (USD Million)
7.6.5.5. Market estimates & forecast, by application, 2021 – 2033 (USD Million)
7.6.6. UAE
7.6.6.1. Key country dynamics
7.6.6.2. Market Estimates & Forecast, 2021 – 2033 (USD Million)
7.6.6.3. Market estimates & forecast, by type, 2021 – 2033 (USD Million)
7.6.6.4. Market estimates & forecast, by product, 2021 – 2033 (USD Million)
7.6.6.5. Market estimates & forecast, by application, 2021 – 2033 (USD Million)
7.6.7. South Africa
7.6.7.1. Key country dynamics
7.6.7.2. Market Estimates & Forecast, 2021 – 2033 (USD Million)
7.6.7.3. Market estimates & forecast, by type, 2021 – 2033 (USD Million)
7.6.7.4. Market estimates & forecast, by product, 2021 – 2033 (USD Million)
7.6.7.5. Market estimates & forecast, by application, 2021 – 2033 (USD Million)
Chapter 8. Global Liquid Handling System Market – Competitive Landscape
8.1. Recent Developments & Impact Analysis, By Key Market Participants
8.2. Company Categorization
8.3. Company Dashboard Analysis
8.4. Company Positioning Analysis, 2025
8.5. Company Heat Map Analysis, 2025
8.6. Strategy Mapping
8.7. Company Profiles
8.7.1. Thermo Fisher Scientific Inc.
8.7.1.1. Participant’s overview
8.7.1.2. Financial performance
8.7.1.3. Product benchmarking
8.7.1.4. Recent developments
8.7.2. Danaher Corporation
8.7.2.1. Participant’s overview
8.7.2.2. Financial performance
8.7.2.3. Product benchmarking
8.7.2.4. Recent developments
8.7.3. PerkinElmer
8.7.3.1. Participant’s overview
8.7.3.2. Financial performance
8.7.3.3. Product benchmarking
8.7.3.4. Recent developments
8.7.4. Mettler-Toledo International Inc.
8.7.4.1. Participant’s overview
8.7.4.2. Financial performance
8.7.4.3. Product benchmarking
8.7.4.4. Recent developments
8.7.5. QIAGEN
8.7.5.1. Participant’s overview
8.7.5.2. Financial performance
8.7.5.3. Product benchmarking
8.7.5.4. Recent developments
8.7.6. Corning Incorporated
8.7.6.1. Participant’s overview
8.7.6.2. Financial performance
8.7.6.3. Product benchmarking
8.7.6.4. Recent developments
8.7.7. Sartorius AG
8.7.7.1. Participant’s overview
8.7.7.2. Financial performance
8.7.7.3. Product benchmarking
8.7.7.4. Recent developments
8.7.8. Lonza
8.7.8.1. Participant’s overview
8.7.8.2. Financial performance
8.7.8.3. Product benchmarking
8.7.8.4. Recent developments
8.7.9. Tecan Trading AG
8.7.9.1. Participant’s overview
8.7.9.2. Financial performance
8.7.9.3. Product benchmarking
8.7.9.4. Recent developments
8.7.10. Ependorf SE
8.7.10.1. Participant’s overview
8.7.10.2. Financial performance
8.7.10.3. Product benchmarking
8.7.10.4. Recent developments
8.7.11. Beckman Coulter
8.7.11.1. Participant’s overview
8.7.11.2. Financial performance
8.7.11.3. Product benchmarking
8.7.11.4. Recent developments
8.7.12. Agilent Technologies
8.7.12.1. Participant’s overview
8.7.12.2. Financial performance
8.7.12.3. Product benchmarking
8.7.12.4. Recent developments
8.7.13. Aurora Biomed Ltd.
8.7.13.1. Participant’s overview
8.7.13.2. Financial performance
8.7.13.3. Product benchmarking
8.7.13.4. Recent developments
8.7.14. Gilson Inc.
8.7.14.1. Participant’s overview
8.7.14.2. Financial performance
8.7.14.3. Product benchmarking
8.7.14.4. Recent developments
8.7.15. BRAND GmbH + Co. KG
8.7.15.1. Participant’s overview
8.7.15.2. Financial performance
8.7.15.3. Product benchmarking
8.7.15.4. Recent developments
List of Tables
Table 1 Global liquid handling system market estimates and forecasts, 2021 – 2033 (USD Million)
Table 2 Global liquid handling system market estimates and forecasts, by type, 2021 – 2033 (USD Million)
Table 3 Global liquid handling system market estimates and forecasts, by product, 2021 – 2033 (USD Million)
Table 4 Global liquid handling system market estimates and forecasts, by application, 2021 – 2033 (USD Million)
Table 5 Global liquid handling system market estimates and forecasts, by region, 2021 – 2033 (USD Million)
Table 6 North America liquid handling system market estimates and forecasts, 2021 – 2033 (USD Million)
Table 7 North America liquid handling system market estimates and forecasts, by type, 2021 – 2033 (USD Million)
Table 8 North America liquid handling system market estimates and forecasts, by product, 2021 – 2033 (USD Million)
Table 9 North America liquid handling system market estimates and forecasts, by application, 2021 – 2033 (USD Million)
Table 10 U.S. liquid handling system market estimates and forecasts, 2021 – 2033 (USD Million)
Table 11 U.S. liquid handling system market estimates and forecasts, by type, 2021 – 2033 (USD Million)
Table 12 U.S. liquid handling system market estimates and forecasts, by product, 2021 – 2033 (USD Million)
Table 13 U.S. liquid handling system market estimates and forecasts, by application, 2021 – 2033 (USD Million)
Table 14 Canada liquid handling system market estimates and forecasts, 2021 – 2033 (USD Million)
Table 15 Canada liquid handling system market estimates and forecasts, by type, 2021 – 2033 (USD Million)
Table 16 Canada liquid handling system market estimates and forecasts, by product, 2021 – 2033 (USD Million)
Table 17 Canada liquid handling system market estimates and forecasts, by application, 2021 – 2033 (USD Million)
Table 18 Mexico liquid handling system market estimates and forecasts, 2021 – 2033 (USD Million)
Table 19 Mexico liquid handling system market estimates and forecasts, by type, 2021 – 2033 (USD Million)
Table 20 Mexico liquid handling system market estimates and forecasts, by product, 2021 – 2033 (USD Million)
Table 21 Mexico liquid handling system market estimates and forecasts, by application, 2021 – 2033 (USD Million)
Table 22 Europe liquid handling system market estimates and forecasts, 2021 – 2033 (USD Million)
Table 23 Europe liquid handling system market estimates and forecasts, by type, 2021 – 2033 (USD Million)
Table 24 Europe liquid handling system market estimates and forecasts, by product, 2021 – 2033 (USD Million)
Table 25 Europe liquid handling system market estimates and forecasts, by application, 2021 – 2033 (USD Million)
Table 26 Germany liquid handling system market estimates and forecasts, 2021 – 2033 (USD Million)
Table 27 Germany liquid handling system market estimates and forecasts, by type, 2021 – 2033 (USD Million)
Table 28 Germany liquid handling system market estimates and forecasts, by product, 2021 – 2033 (USD Million)
Table 29 Germany liquid handling system market estimates and forecasts, by application, 2021 – 2033 (USD Million)
Table 30 France liquid handling system market estimates and forecasts, 2021 – 2033 (USD Million)
Table 31 France liquid handling system market estimates and forecasts, by type, 2021 – 2033 (USD Million)
Table 32 France liquid handling system market estimates and forecasts, by product, 2021 – 2033 (USD Million)
Table 33 France liquid handling system market estimates and forecasts, by application, 2021 – 2033 (USD Million)
Table 34 Italy liquid handling system market estimates and forecasts, 2021 – 2033 (USD Million)
Table 35 Italy liquid handling system market estimates and forecasts, by type, 2021 – 2033 (USD Million)
Table 36 Italy liquid handling system market estimates and forecasts, by product, 2021 – 2033 (USD Million)
Table 37 Italy liquid handling system market estimates and forecasts, by application, 2021 – 2033 (USD Million)
Table 38 Spain liquid handling system market estimates and forecasts, 2021 – 2033 (USD Million)
Table 39 Spain liquid handling system market estimates and forecasts, by type, 2021 – 2033 (USD Million)
Table 40 Spain liquid handling system market estimates and forecasts, by product, 2021 – 2033 (USD Million)
Table 41 Spain liquid handling system market estimates and forecasts, by application, 2021 – 2033 (USD Million)
Table 42 UK liquid handling system market estimates and forecasts, 2021 – 2033 (USD Million)
Table 43 UK liquid handling system market estimates and forecasts, by type, 2021 – 2033 (USD Million)
Table 44 UK liquid handling system market estimates and forecasts, by product, 2021 – 2033 (USD Million)
Table 45 UK liquid handling system market estimates and forecasts, by application, 2021 – 2033 (USD Million)
Table 46 Asia Pacific liquid handling system market estimates and forecasts, 2021 – 2033 (USD Million)
Table 47 Asia Pacific liquid handling system market estimates and forecasts, by type, 2021 – 2033 (USD Million)
Table 48 Asia Pacific liquid handling system market estimates and forecasts, by product, 2021 – 2033 (USD Million)
Table 49 Asia Pacific liquid handling system market estimates and forecasts, by application, 2021 – 2033 (USD Million)
Table 50 China liquid handling system market estimates and forecasts, 2021 – 2033 (USD Million)
Table 51 China liquid handling system market estimates and forecasts, by type, 2021 – 2033 (USD Million)
Table 52 China liquid handling system market estimates and forecasts, by product, 2021 – 2033 (USD Million)
Table 53 China liquid handling system market estimates and forecasts, by application, 2021 – 2033 (USD Million)
Table 54 India liquid handling system market estimates and forecasts, 2021 – 2033 (USD Million)
Table 55 India liquid handling system market estimates and forecasts, by type, 2021 – 2033 (USD Million)
Table 56 India liquid handling system market estimates and forecasts, by product, 2021 – 2033 (USD Million)
Table 57 India liquid handling system market estimates and forecasts, by application, 2021 – 2033 (USD Million)
Table 58 Japan liquid handling system market estimates and forecasts, 2021 – 2033 (USD Million)
Table 59 Japan liquid handling system market estimates and forecasts, by type, 2021 – 2033 (USD Million)
Table 60 Japan liquid handling system market estimates and forecasts, by product, 2021 – 2033 (USD Million)
Table 61 Japan liquid handling system market estimates and forecasts, by application, 2021 – 2033 (USD Million)
Table 62 South Korea liquid handling system market estimates and forecasts, 2021 – 2033 (USD Million)
Table 63 South Korea liquid handling system market estimates and forecasts, by type, 2021 – 2033 (USD Million)
Table 64 South Korea liquid handling system market estimates and forecasts, by product, 2021 – 2033 (USD Million)
Table 65 South Korea liquid handling system market estimates and forecasts, by application, 2021 – 2033 (USD Million)
Table 66 Australia liquid handling system market estimates and forecasts, 2021 – 2033 (USD Million)
Table 67 Australia liquid handling system market estimates and forecasts, by type, 2021 – 2033 (USD Million)
Table 68 Australia liquid handling system market estimates and forecasts, by product, 2021 – 2033 (USD Million)
Table 69 Australia liquid handling system market estimates and forecasts, by application, 2021 – 2033 (USD Million)
Table 70 Latin America liquid handling system market estimates and forecasts, 2021 – 2033 (USD Million)
Table 71 Latin America liquid handling system market estimates and forecasts, by type, 2021 – 2033 (USD Million)
Table 72 Latin America liquid handling system market estimates and forecasts, by product, 2021 – 2033 (USD Million)
Table 73 Latin America liquid handling system market estimates and forecasts, by application, 2021 – 2033 (USD Million)
Table 74 Brazil liquid handling system market estimates and forecasts, 2021 – 2033 (USD Million)
Table 75 Brazil liquid handling system market estimates and forecasts, by type, 2021 – 2033 (USD Million)
Table 76 Brazil liquid handling system market estimates and forecasts, by product, 2021 – 2033 (USD Million)
Table 77 Brazil liquid handling system market estimates and forecasts, by application, 2021 – 2033 (USD Million)
Table 78 Argentina liquid handling system market estimates and forecasts, 2021 – 2033 (USD Million)
Table 79 Argentina liquid handling system market estimates and forecasts, by type, 2021 – 2033 (USD Million)
Table 80 Argentina liquid handling system market estimates and forecasts, by product, 2021 – 2033 (USD Million)
Table 81 Argentina liquid handling system market estimates and forecasts, by application, 2021 – 2033 (USD Million)
Table 82 Middle East & Africa liquid handling system market estimates and forecasts, 2021 – 2033 (USD Million)
Table 83 Middle East & Africa liquid handling system market estimates and forecasts, by type, 2021 – 2033 (USD Million)
Table 84 Middle East & Africa liquid handling system market estimates and forecasts, by product, 2021 – 2033 (USD Million)
Table 85 Middle East & Africa liquid handling system market estimates and forecasts, by application, 2021 – 2033 (USD Million)
Table 86 Saudi Arabia liquid handling system market estimates and forecasts, 2021 – 2033 (USD Million)
Table 87 Saudi Arabia liquid handling system market estimates and forecasts, by type, 2021 – 2033 (USD Million)
Table 88 Saudi Arabia liquid handling system market estimates and forecasts, by product, 2021 – 2033 (USD Million)
Table 89 Saudi Arabia liquid handling system market estimates and forecasts, by application, 2021 – 2033 (USD Million)
Table 90 UAE liquid handling system market estimates and forecasts, 2021 – 2033 (USD Million)
Table 91 UAE liquid handling system market estimates and forecasts, by type, 2021 – 2033 (USD Million)
Table 92 UAE liquid handling system market estimates and forecasts, by product, 2021 – 2033 (USD Million)
Table 93 UAE liquid handling system market estimates and forecasts, by application, 2021 – 2033 (USD Million)
Table 94 South Africa liquid handling system market estimates and forecasts, 2021 – 2033 (USD Million)
Table 95 South Africa liquid handling system market estimates and forecasts, by type, 2021 – 2033 (USD Million)
Table 96 South Africa liquid handling system market estimates and forecasts, by product, 2021 – 2033 (USD Million)
Table 97 South Africa liquid handling system market estimates and forecasts, by application, 2021 – 2033 (USD Million)
Table 98 Company Heat Map Analysis, 2025
Table 99 Strategy Mapping
List of Figures
Fig. 1 Market research process
Fig. 2 Data triangulation techniques
Fig. 3 Primary research pattern
Fig. 4 Market research approaches
Fig. 5 QFD modeling for market share assessment
Fig. 6 Information Procurement
Fig. 7 Market Formulation and Validation
Fig. 8 Data Validating & Publishing
Fig. 9 Market Segmentation & Scope
Fig. 10 Global Liquid Handling System Market Snapshot
Fig. 11 Segment Snapshot
Fig. 12 Competitive Landscape Snapshot
Fig. 13 Parent market outlook
Fig. 14 Global Liquid Handling System Market Value, 2025 (USD Million)
Fig. 15 Global Liquid Handling System Market – Value Chain Analysis
Fig. 16 Global Liquid Handling System Market – Market Dynamics
Fig. 17 Global Liquid Handling System Market – PORTER’s Analysis
Fig. 18 Global Liquid Handling System Market – PESTEL Analysis
Fig. 19 Global Liquid Handling System Market Estimates & Forecasts, By Type: Key Takeaways
Fig. 20 Global Liquid Handling System Market Share, By Type, 2025 & 2033
Fig. 21 Global Liquid Handling System Market Estimates and Forecast, By Manual Liquid Handling, 2021 – 2033 (USD Million)
Fig. 22 Global Liquid Handling System Market Estimates and Forecast, By Semi-Automated Liquid Handling, 2021 – 2033 (USD Million)
Fig. 23 Global Liquid Handling System Market Estimates and Forecast, By Automated Liquid Handling, 2021 – 2033 (USD Million)
Fig. 24 Global Liquid Handling System Market Estimates & Forecasts, By Product: Key Takeaways
Fig. 25 Global Liquid Handling System Market Share, By Product, 2025 & 2033
Fig. 26 Global Liquid Handling System Market Estimates and Forecast, By Pipettes, 2021 – 2033 (USD Million)
Fig. 27 Global Liquid Handling System Market Estimates and Forecast, By Burettes, 2021 – 2033 (USD Million)
Fig. 28 Global Liquid Handling System Market Estimates and Forecast, By Workstations, 2021 – 2033 (USD Million)
Fig. 29 Global Liquid Handling System Market Estimates and Forecast, By Consumables, 2021 – 2033 (USD Million)
Fig. 30 Global Liquid Handling System Market Estimates and Forecast, By Others, 2021 – 2033 (USD Million)
Fig. 31 Global Liquid Handling System Market Estimates & Forecasts, By Application: Key Takeaways
Fig. 32 Global Liquid Handling System Market Share, By Application, 2025 & 2033
Fig. 33 Global Liquid Handling System Market Estimates and Forecast, In Drug Discovery, 2021 – 2033 (USD Million)
Fig. 34 Global Liquid Handling System Market Estimates and Forecast, In Clinical Diagnostics, 2021 – 2033 (USD Million)
Fig. 35 Global Liquid Handling System Market Estimates and Forecast, In Cell & Gene Therapy Manufacturing, 2021 – 2033 (USD Million)
Fig. 36 Global Liquid Handling System Market Estimates and Forecast, In Others, 2021 – 2033 (USD Million)
Fig. 37 North America Liquid Handling System Market Estimates & Forecasts, 2021 – 2033 (USD Million)
Fig. 38 US Liquid Handling System Market Estimates & Forecasts, 2021 – 2033 (USD Million)
Fig. 39 Canada Liquid Handling System Market Estimates & Forecasts, 2021 – 2033 (USD Million)
Fig. 40 Mexico Liquid Handling System Market Estimates & Forecasts, 2021 – 2033 (USD Million)
Fig. 41 Europe Liquid Handling System Market Estimates & Forecasts, 2021 – 2033 (USD Million)
Fig. 42 Germany Liquid Handling System Market Estimates & Forecasts, 2021 – 2033 (USD Million)
Fig. 43 France Liquid Handling System Market Estimates & Forecasts, 2021 – 2033 (USD Million)
Fig. 44 UK Liquid Handling System Market Estimates & Forecasts, 2021 – 2033 (USD Million)
Fig. 45 Italy Liquid Handling System Market Estimates & Forecasts, 2021 – 2033 (USD Million)
Fig. 46 Spain Liquid Handling System Market Estimates & Forecasts, 2021 – 2033 (USD Million)
Fig. 47 Asia Pacific Liquid Handling System Market Estimates & Forecasts, 2021 – 2033 (USD Million)
Fig. 48 China Liquid Handling System Market Estimates & Forecasts, 2021 – 2033 (USD Million)
Fig. 49 Japan Liquid Handling System Market Estimates & Forecasts, 2021 – 2033 (USD Million)
Fig. 50 India Liquid Handling System Market Estimates & Forecasts, 2021 – 2033 (USD Million)
Fig. 51 Australia Liquid Handling System Market Estimates & Forecasts, 2021 – 2033 (USD Million)
Fig. 52 South Korea Liquid Handling System Market Estimates & Forecasts, 2021 – 2033 (USD Million)
Fig. 53 Latin America Liquid Handling System Market Estimates & Forecasts, 2021 – 2033 (USD Million)
Fig. 54 Brazil Liquid Handling System Market Estimates & Forecasts, 2021 – 2033 (USD Million)
Fig. 55 Argentina Liquid Handling System Market Estimates & Forecasts, 2021 – 2033 (USD Million)
Fig. 56 Middle East & Africa Liquid Handling System Market Estimates & Forecasts, 2021 – 2033 (USD Million)
Fig. 57 Saudi Arabia Liquid Handling System Market Estimates & Forecasts, 2021 – 2033 (USD Million)
Fig. 58 UAE Liquid Handling System Market Estimates & Forecasts, 2021 – 2033 (USD Million)
Fig. 59 South Africa Liquid Handling System Market Estimates & Forecasts, 2021 – 2033 (USD Million)
Fig. 60 Key Company Categorization
Fig. 61 Company Market Positioning
Fig. 62 Strategy Mapping