Enzymes Market Size, Share & Trends Analysis Report By Type (Industrial Enzyme, Specialty Enzyme), By Product (Carbohydrase, Proteases, Polymerases & Nucleases), By Source (Plants, Animals, Microorganisms), By Region, And Segment Forecasts, 2026 - 2033
酵素市場 - 種類別(工業用酵素、特殊酵素)、製品別(炭水化物分解酵素、プロテアーゼ、ポリメラーゼ、ヌクレアーゼ)、供給源別(植物、動物、微生物)、地域、セグメント別予測による市場規模、成長と動向分析レポート 2026-2033年
| 出版 | Grand View Research |
| 出版年月 | 2026年02月 |
| ページ数 | 80 |
| 価格 | 記載以外のライセンスについてはお問合せください |
| シングルユーザ | USD 5,950 |
| 種別 | 英文調査報告書 |
| 商品番号 | SMR-16581 |

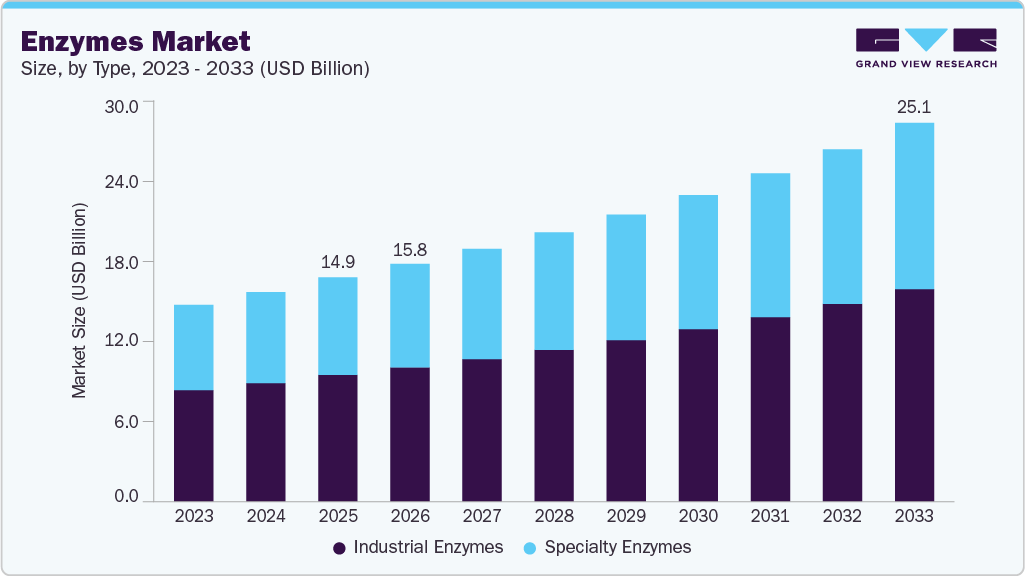
世界の酵素市場規模は、2024年に148億7990万米ドルと推定され、2033年までに251億4930万米ドルに達すると予測されており、2026年から2033年にかけて年平均成長率(CAGR)6.9%で成長すると見込まれています。この業界は、食品加工、医薬品、バイオ燃料における需要の高まり、持続可能で環境に優しい工業プロセスの採用拡大、酵素工学の進歩、動物飼料や診断における利用拡大によって牽引されています。
主要市場動向と洞察
- 北米は2025年に世界酵素市場を牽引し、売上高シェアは36.3%と最大となりました。
- 米国の酵素市場は、2026年から2033年にかけて年平均成長率(CAGR)7.1%という高い成長が見込まれています。
- タイプ別に見ると、特殊酵素セグメントは、売上高ベースで2026年から2033年にかけて年平均成長率7.0%と最も高い成長が見込まれています。
- 製品別に見ると、炭水化物分解酵素セグメントは、2026年から2033年にかけて年平均成長率7.1%と最も高い成長が見込まれています。
- 原料別に見ると、微生物由来の酵素セグメントは、2026年から2033年にかけて年平均成長率6.9%と最も高い成長が見込まれています。
酵素産業は、食品加工、動物栄養、医薬品、産業バイオテクノロジーなど幅広い分野での用途拡大により、持続的な成長を遂げています。主な成長要因としては、製造工程における生体触媒としての酵素の利用拡大、エネルギー消費量の削減、化学廃棄物の削減などが挙げられます。食品・飲料製品における天然由来成分やクリーンラベル成分へのシフトは、酵素製剤の需要を加速させています。動物飼料においては、酵素は栄養吸収の促進、動物の健康増進、環境負荷の低減に貢献しています。さらに、酵素工学や組換えDNA技術への研究開発投資の増加は、効率的かつ拡張性の高い生産を支えています。
酵素産業における大きな制約の一つは、原材料の入手可能性と価格の変動性です。特に、膵臓や胃などの臓器由来の動物性酵素においては、この変動性が顕著です。これは、製造業者のコスト構造と利益率に影響を与えます。加えて、酵素の生産には複雑な発酵システムが必要となることが多く、このシステムは汚染や工程変動に敏感であるため、収量や有効性が不安定になるという問題があります。遺伝子組み換え生物(GMO)、特に酵素産生微生物に関する規制上の障壁は、特定の地域において障壁となっている。知的財産権やバイオセーフティに関する懸念も、新しい酵素製品の自由な開発と流通を制限している。
Enzymes Market Summary
The global enzymes market size was estimated at USD 14,879.9 million in 2024 and is projected to reach USD 25,149.3 million by 2033, growing at a CAGR of 6.9% from 2026 to 2033. The industry is driven by rising demand across food processing, pharmaceuticals, and biofuels; increased adoption of sustainable and eco-friendly industrial processes; advancements in enzyme engineering; and growing use in animal feed and diagnostics.
Key Market Trends & Insights
- North America dominated the global enzymes market with the largest revenue share of 36.3% in 2025.
- The U.S. enzymes market is expected to grow at a substantial CAGR of 7.1% from 2026 to 2033.
- By type, the specialty enzymes segment is expected to grow at the fastest CAGR of 7.0% from 2026 to 2033 in terms of revenue.
- By product, the carbohydrase segment is expected to grow at the fastest CAGR of 7.1% from 2026 to 2033.
- By source, the microorganisms segment is expected to grow at the fastest CAGR of 6.9% from 2026 to 2033.
Market Size & Forecast
- 2025 Market Size: USD 14,879.9 Million
- 2033 Projected Market Size: USD 25,149.3 Million
- CAGR (2026-2033): 6.9%
- North America: Largest market in 2025
- Asia Pacific: Fastest growing market
The enzymes industry is experiencing sustained growth due to the expanding applications across food processing, animal nutrition, pharmaceuticals, and industrial biotechnology. Key drivers include the rising adoption of enzymes as biocatalysts in manufacturing processes, reducing energy consumption, and chemical waste. The shift toward natural and clean-label ingredients in food and beverage products is accelerating demand for enzyme-based formulations. In animal feed, enzymes are enhancing nutrient absorption, improving animal health, and reducing environmental impact. In addition, increased R&D investment in enzyme engineering and recombinant DNA technologies is supporting efficient and scalable production.
One of the major restraints in the enzymes industry is the volatility in raw material availability and pricing, especially for animal-derived enzymes sourced from organs like the pancreas or stomach. This affects the cost structure and profit margins of manufacturers. Moreover, the production of enzymes often requires complex fermentation systems, sensitive to contamination and process variation, leading to inconsistent yield or efficacy. Regulatory hurdles around genetically modified organisms (GMOs), especially in enzyme-producing microorganisms, create barriers in certain regions. Intellectual property rights and biosafety concerns also limit the free development and distribution of new enzyme products.
There is a significant opportunity in the development of enzyme-based solutions tailored for green chemistry and sustainability. The growing interest in plant-based and microbial enzymes opens doors for enzyme manufacturers to reduce reliance on animal sources and align with ethical, halal, and kosher requirements. Industrial sectors such as textiles, detergents, pulp and paper, and biofuels are adopting enzyme technologies to reduce chemical load and waste generation. In the food and beverage industry, emerging markets are seeking advanced enzymatic solutions for yield improvement and shelf-life enhancement. Further, synthetic biology and precision fermentation offer untapped potential for high-specificity enzyme development at a commercial scale.
Type Insights
The industrial enzymes segment led the market with the largest revenue share of 56.5% in 2025. This growth is driven by its extensive application across high-volume industries such as nutraceuticals, personal care and cosmetics, food and beverages, detergents, textiles, pulp and paper, animal feed, biofuels, and wastewater treatment. In food processing, enzymes improve yield, texture, and flavor, while in detergents, they enable low-temperature cleaning and stain removal. Enzymes enhance nutrient digestibility in animal feed and optimize ethanol yields in biofuel production. Their role in textile desizing, paper bleaching, and wastewater biodegradation highlights their industrial versatility. Demand is further fueled by sustainability efforts and energy-efficient processes, making industrial enzymes essential across environmentally conscious manufacturing sectors.
The specialty enzymes segment is expected to grow at the fastest CAGR of 7.0% during the forecast period. This segment is propelled due to advanced applications in pharmaceuticals, research and biotechnology, diagnostics, biocatalysis, and other high-precision sectors. In pharmaceuticals, these enzymes are used in drug formulation, delivery, and therapeutic enzyme replacement. The biotechnology and diagnostics sectors rely heavily on specialty enzymes for molecular diagnostics, PCR techniques, and DNA modification. Enzyme-based biocatalysts are replacing traditional chemical catalysts due to their specificity, sustainability, and efficiency. As personalized medicine, molecular research, and precision diagnostics expand globally, the demand for high-purity, targeted enzymes continues to accelerate innovation and commercial adoption.
Product Insights
The carbohydrase segment led the market with the largest revenue share of 47.9% in 2025. This growth is driven by its extensive utility in industries such as food and beverages, animal feed, biofuel production, and textiles. This group of enzymes, including amylases, cellulases, and xylanases, facilitates the breakdown of complex carbohydrates into simple sugars, enhancing efficiency in processes like starch conversion, juice clarification, and dough conditioning. In the biofuel industry, carbohydrases are critical for the saccharification of biomass to fermentable sugars, supporting sustainable fuel production. Their growing adoption in animal feed improves nutrient digestibility and feed efficiency. The demand is reinforced by the clean-label trend and a shift toward enzymatic processing for cost-effective, eco-friendly manufacturing across industrial sectors.
The proteases segment is predicted to grow at the fastest CAGR of 6.9% from 2026 to 2033 during the forecast period. This segment is increasing due to heightened demand owing to its indispensable role in protein hydrolysis across multiple industries. In the detergent industry, they are employed to break down protein-based stains under mild conditions, allowing energy-efficient, cold-water washing. In food processing, proteases contribute to meat tenderization, cheese ripening, and flavor development in fermented products. Pharmaceutical and diagnostic applications also utilize proteases in therapeutic formulations and disease marker detection. Their incorporation into animal feed enhances protein digestibility, improving animal health and productivity. Increased focus on sustainable processing and the replacement of harsh chemical agents further supports the broader integration of proteases in industrial and specialty applications.
Source Insights
The microorganisms segment led the market with the largest revenue share of 85.8% in 2025. This growth is driven due to their scalability, rapid growth, and genetic manipulability, enabling high-yield, cost-effective fermentation processes. Fungi, bacteria, and enzyme-producing yeasts are widely used for their ability to secrete extracellular enzymes, simplifying downstream purification. Advances in recombinant DNA technology and synthetic biology have enhanced strain engineering, allowing tailored enzyme profiles for industrial, pharmaceutical, and food applications. Their use ensures consistency, purity, and compliance with regulatory standards, making microbial enzymes the preferred choice for large-scale commercial production across sectors such as detergents, food processing, and bioenergy.
The plants segment is anticipated to grow at the fastest CAGR of 6.7% from 2026 to 2033 during the forecast period. This market momentum is due to their natural origin, safety, and alignment with consumer demand for clean-label, animal-free products. Their application spans the food, nutraceutical, and cosmetic industries, where plant-sourced proteases like bromelain and papain are favored for digestive aids and anti-inflammatory benefits. Technological advancements in plant tissue culture and transgenic expression systems are improving enzyme yields and stability. Plant-based systems also offer advantages in enzyme extraction for halal, kosher, and vegan-certified applications, driving their increasing use in formulations where ethical, dietary, or religious concerns influence product development.
Regional Insights
North America enzymes market dominated with the largest revenue share of 36.3% in 2025. It is primarily attributed to the region’s robust growth driven by a strong presence of established enzyme manufacturers, advanced biotechnological infrastructure, and significant research and development investment. The region benefits from diversified demand across sectors such as food processing, pharmaceuticals, animal feed, and industrial applications, including detergents and biofuels. Consumer preference for clean-label and functional foods, combined with regulatory support for green technologies and industrial enzyme use, continues to position North America as a key global driver.
Key Enzymes Company Insights
Key players operating in the enzymes market are undertaking various initiatives to strengthen their presence and increase the reach of their products and services. Strategies such as expansion activities and partnerships are key in propelling the market growth. Some of the key players operating in the market comprise Novonesis, International Flavors & Fragrances (IFF), DSM, and others.
- Novonesis specializes in the development and commercialization of industrial enzymes and microorganisms. The company focuses on identifying naturally occurring enzymes and enhancing their performance for diverse industrial applications. Its solutions are widely used across sectors such as laundry and dishwashing detergents, food and beverages, animal nutrition, and biofuel production. With a global footprint, Novonesis operates in over 30 countries and supplies enzyme solutions to more than 40 end-use industries. It maintains production facilities in Denmark, Brazil, Argentina, China, Canada, the United States, and India.
- DSM is a globally active, science-driven enterprise involved in nutrition, health, and sustainable living. Its extensive portfolio spans industries including animal health and nutrition, food and beverages, renewable energy, healthcare, paints and coatings, personal care, and performance materials. DSM operates through three core segments: Nutrition, Materials, and Innovation Center. Its Nutrition business unit leads the production and distribution of enzymes for varied applications. DSM’s reach extends to customers in more than 50 countries, supported by a robust innovation pipeline and commitment to sustainable product development.
Key Enzymes Companies:
The following key companies have been profiled for this study on the enzymes market.
- BASF
- Novonesis
- International Flavors & Fragrances (IFF)
- DSM
- Novus International, Inc.
- Associated British Foods plc
- Kerry
- Advanced Enzyme Technologies
- Amano Enzyme Inc.
- Adisseo
Recent Development
- In January 2024, Novozymes and Chr. Hansen officially merged to form Novonesis, marking the creation of a global leader in biosolutions. The news highlights the successful integration of two major biotechnology players with a combined focus on sustainability, innovation, and enzyme-driven applications. The aim is to deliver transformative biosolutions across industries. This development significantly strengthens the enzyme market by expanding capabilities, global reach, and product diversity in both industrial and specialty enzyme segments.
- In March 2025, IFF and Kemira announced the formation of Alpha Bio, a joint venture to scale production of sustainable biobased materials using enzymatic technology. The news outlines their commitmentto replacing fossil-based polymers with enzyme-enabled biopolymers derived from plant sugars. The aim is to meet growing demand for biodegradable, high-performance materials. This move reinforces the role of enzymes in advancing green chemistry and expands their industrial applications within the global enzymes industry.
Enzymes Market Report Scope
Global Enzymes Market Report Segmentation
This report forecasts volume & revenue growth at the global, regional and country levels and provides an analysis of the latest industry trends in each of the sub-segments from 2018 to 2033. For this study, Grand View Research has segmented the global enzymes market report based on type, product, source, and region:
- Type Outlook (Volume, Kilotons; Revenue, USD Million, 2018 – 2033)
- Industrial Enzymes
- Food & Beverages
- Detergents
- Animal Feed
- Biofuels
- Textiles
- Pulp & Paper
- Nutraceutical
- Personal Care & Cosmetics
- Wastewater
- Others
- Specialty Enzymes
- Pharmaceutical
- Research & Biotechnology
- Diagnostics
- Biocatalyst
- Industrial Enzymes
- Product Outlook (Volume, Kilotons; Revenue, USD Million, 2018 – 2033)
- Carbohydrases
- Proteases
- Lipases
- Polymerases & Nucleases
- Others
- Source Outlook (Volume, Kilotons; Revenue, USD Million, 2018 – 2033)
- Plants
- Animals
- Microorganisms
- Region Outlook (Volume, Kilotons; Revenue, USD Million, 2018 – 2033)
- North America
- U.S.
- Canada
- Mexico
- Europe
- Germany
- UK
- France
- Italy
- Spain
- Asia Pacific
- China
- India
- Japan
- South Korea
- Indonesia
- Australia
- Latin America
- Brazil
- Argentina
- Middle East & Africa
- Saudi Arabia
- South Africa
- Türkiye
- North America
o Australia
- Latin America
o Brazil
o Argentina
- Middle East & Africa
o Saudi Arabia
o South Africa
o Türkiye
Table of Contents
Chapter 1. Methodology and Scope
1.1. Research Methodology
1.1.1. Market Segmentation
1.1.2. Market Definition
1.2. Research Scope & Assumptions
1.3. Information Procurement
1.3.1. Purchased Database
1.3.2. GVR’s Internal Database
1.3.3. Secondary Sources & Third-Party Perspectives
1.3.4. Primary Research
1.4. Information Analysis
1.4.1. Data Analysis Models
1.5. Market Formulation & Data Visualization
1.6. Data Validation & Publishing
1.7. List of Abbreviations
Chapter 2. Executive Summary
2.1. Market Snapshot, 2025 (USD Million)
2.2. Segmental Snapshot
2.3. Competitive Landscape Snapshot
Chapter 3. Global Enzymes Market Variables, Trends, and Scope
3.1. Market Lineage Outlook
3.2. Industry Value Chain Analysis
3.2.1. Raw Material Trends
3.2.2. Product Trends
3.2.3. Sales Channel Analysis
3.3. Price Trend Analysis, 2018 – 2033
3.3.1. Factors Influencing Prices
3.4. Regulatory Framework
3.5. Market Dynamics
3.5.1. Market Driver Analysis
3.5.2. Market Restraint Analysis
3.5.3. Market Opportunity Analysis
3.5.4. Market Challenge Analysis
3.6. Business Environment Analysis
3.6.1. Porter’s Five Forces Analysis
3.6.2. PESTEL Analysis
Chapter 4. Global Enzymes Market: Type Estimates & Trend Analysis
4.1. Key Takeaways
4.2. Type Movement Analysis & Market Share, 2025 & 2033
4.2.1. Industrial Enzymes
4.2.1.1. Market estimates and forecasts, 2018 – 2033 (Kilotons) (USD Million)
4.2.1.2. Food & Beverages
4.2.1.2.1. Market estimates and forecasts, 2018 – 2033 (Kilotons) (USD Million)
4.2.1.3. Detergents
4.2.1.3.1. Market estimates and forecasts, 2018 – 2033 (Kilotons) (USD Million)
4.2.1.4. Animal Feed
4.2.1.4.1. Market estimates and forecasts, 2018 – 2033 (Kilotons) (USD Million)
4.2.1.5. Biofuels
4.2.1.5.1. Market estimates and forecasts, 2018 – 2033 (Kilotons) (USD Million)
4.2.1.6. Textiles
4.2.1.6.1. Market estimates and forecasts, 2018 – 2033 (Kilotons) (USD Million)
4.2.1.7. Pulp & Paper
4.2.1.7.1. Market estimates and forecasts, 2018 – 2033 (Kilotons) (USD Million)
4.2.1.8. Nutraceutical
4.2.1.8.1. Market estimates and forecasts, 2018 – 2033 (Kilotons) (USD Million)
4.2.1.9. Personal Care & Cosmetics
4.2.1.9.1. Market estimates and forecasts, 2018 – 2033 (Kilotons) (USD Million)
4.2.1.10. Wastewater
4.2.1.10.1. Market estimates and forecasts, 2018 – 2033 (Kilotons) (USD Million)
4.2.1.11. Others
4.2.1.11.1. Market estimates and forecasts, 2018 – 2033 (Kilotons) (USD Million)
4.2.2. Specialty Enzymes
4.2.2.1. Market estimates and forecasts, 2018 – 2033 (Kilotons) (USD Million)
4.2.2.2. Pharmaceutical
4.2.2.2.1. Market estimates and forecasts, 2018 – 2033 (Kilotons) (USD Million)
4.2.2.3. Research & Biotechnology
4.2.2.3.1. Market estimates and forecasts, 2018 – 2033 (Kilotons) (USD Million)
4.2.2.4. Diagnostics
4.2.2.4.1. Market estimates and forecasts, 2018 – 2033 (Kilotons) (USD Million)
4.2.2.5. Biocatalyst
4.2.2.5.1. Market estimates and forecasts, 2018 – 2033 (Kilotons) (USD Million)
Chapter 5. Global Enzymes Market: Product Estimates & Trend Analysis
5.1. Key Takeaways
5.2. Product Movement Analysis & Market Share, 2025 & 2033
5.2.1. Carbohydrases
5.2.1.1. Market estimates and forecasts, 2018 – 2033 (Kilotons) (USD Million)
5.2.2. Proteases
5.2.2.1. Market estimates and forecasts, 2018 – 2033 (Kilotons) (USD Million)
5.2.3. Lipases
5.2.3.1. Market estimates and forecasts, 2018 – 2033 (Kilotons) (USD Million)
5.2.4. Polymerases & Nucleases
5.2.4.1. Market estimates and forecasts, 2018 – 2033 (Kilotons) (USD Million)
5.2.5. Others
5.2.5.1. Market estimates and forecasts, 2018 – 2033 (Kilotons) (USD Million)
Chapter 6. Global Enzymes Market: Source Estimates & Trend Analysis
6.1. Key Takeaways
6.2. Source Movement Analysis & Market Share, 2025 & 2033
6.2.1. Plants
6.2.1.1. Market estimates and forecasts, 2018 – 2033 (Kilotons) (USD Million)
6.2.2. Animals
6.2.2.1. Market estimates and forecasts, 2018 – 2033 (Kilotons) (USD Million)
6.2.3. Microorganisms
6.2.3.1. Market estimates and forecasts, 2018 – 2033 (Kilotons) (USD Million)
Chapter 7. Global Enzymes Market: Region Estimates & Trend Analysis
7.1. Key Takeaways
7.2. Regional Movement Analysis & Market Share, 2025 & 2033
7.3. North America
7.3.1. North America Enzymes Market Estimates & Forecasts, 2018 – 2033 (Kilotons) (USD Million)
7.3.2. Market estimates and forecasts, By Type, 2018 – 2033 (Kilotons) (USD Million)
7.3.3. Market estimates and forecasts, By Product, 2018 – 2033 (Kilotons) (USD Million)
7.3.4. Market estimates and forecasts, By Source, 2018 – 2033 (Kilotons) (USD Million)
7.3.5. U.S.
7.3.5.1. U.S. Enzymes Market Estimates & Forecasts, 2018 – 2033 (Kilotons) (USD Million)
7.3.5.2. Market estimates and forecasts, By Type, 2018 – 2033 (Kilotons) (USD Million)
7.3.5.3. Market estimates and forecasts, By Product, 2018 – 2033 (Kilotons) (USD Million)
7.3.5.4. Market estimates and forecasts, By Source, 2018 – 2033 (Kilotons) (USD Million)
7.3.6. Canada
7.3.6.1. Canada Enzymes Market Estimates & Forecasts, 2018 – 2033 (Kilotons) (USD Million)
7.3.6.2. Market estimates and forecasts, By Type, 2018 – 2033 (Kilotons) (USD Million)
7.3.6.3. Market estimates and forecasts, By Product, 2018 – 2033 (Kilotons) (USD Million)
7.3.6.4. Market estimates and forecasts, By Source, 2018 – 2033 (Kilotons) (USD Million)
7.3.7. Mexico
7.3.7.1. Mexico Enzymes Market Estimates & Forecasts, 2018 – 2033 (Kilotons) (USD Million)
7.3.7.2. Market estimates and forecasts, By Type, 2018 – 2033 (Kilotons) (USD Million)
7.3.7.3. Market estimates and forecasts, By Product, 2018 – 2033 (Kilotons) (USD Million)
7.3.7.4. Market estimates and forecasts, By Source, 2018 – 2033 (Kilotons) (USD Million)
7.4. Europe
7.4.1. Europe Enzymes Market Estimates & Forecasts, 2018 – 2033 (Kilotons) (USD Million)
7.4.2. Market estimates and forecasts, By Type, 2018 – 2033 (Kilotons) (USD Million)
7.4.3. Market estimates and forecasts, By Product, 2018 – 2033 (Kilotons) (USD Million)
7.4.4. Market estimates and forecasts, By Source, 2018 – 2033 (Kilotons) (USD Million)
7.4.5. Germany
7.4.5.1. Germany Enzymes Market Estimates & Forecasts, 2018 – 2033 (Kilotons) (USD Million)
7.4.5.2. Market estimates and forecasts, By Type, 2018 – 2033 (Kilotons) (USD Million)
7.4.5.3. Market estimates and forecasts, By Product, 2018 – 2033 (Kilotons) (USD Million)
7.4.5.4. Market estimates and forecasts, By Source, 2018 – 2033 (Kilotons) (USD Million)
7.4.6. UK
7.4.6.1. UK Enzymes Market Estimates & Forecasts, 2018 – 2033 (Kilotons) (USD Million)
7.4.6.2. Market estimates and forecasts, By Type, 2018 – 2033 (Kilotons) (USD Million)
7.4.6.3. Market estimates and forecasts, By Product, 2018 – 2033 (Kilotons) (USD Million)
7.4.6.4. Market estimates and forecasts, By Source, 2018 – 2033 (Kilotons) (USD Million)
7.4.7. France
7.4.7.1. France Enzymes Market Estimates & Forecasts, 2018 – 2033 (Kilotons) (USD Million)
7.4.7.2. Market estimates and forecasts, By Type, 2018 – 2033 (Kilotons) (USD Million)
7.4.7.3. Market estimates and forecasts, By Product, 2018 – 2033 (Kilotons) (USD Million)
7.4.7.4. Market estimates and forecasts, By Source, 2018 – 2033 (Kilotons) (USD Million)
7.4.8. Italy
7.4.8.1. Italy Enzymes Market Estimates & Forecasts, 2018 – 2033 (Kilotons) (USD Million)
7.4.8.2. Market estimates and forecasts, By Type, 2018 – 2033 (Kilotons) (USD Million)
7.4.8.3. Market estimates and forecasts, By Product, 2018 – 2033 (Kilotons) (USD Million)
7.4.8.4. Market estimates and forecasts, By Source, 2018 – 2033 (Kilotons) (USD Million)
7.4.9. Spain
7.4.9.1. Spain Enzymes Market Estimates & Forecasts, 2018 – 2033 (Kilotons) (USD Million)
7.4.9.2. Market estimates and forecasts, By Type, 2018 – 2033 (Kilotons) (USD Million)
7.4.9.3. Market estimates and forecasts, By Product, 2018 – 2033 (Kilotons) (USD Million)
7.4.9.4. Market estimates and forecasts, By Source, 2018 – 2033 (Kilotons) (USD Million)
7.5. Asia Pacific
7.5.1. Asia Pacific Enzymes Market Estimates & Forecasts, 2018 – 2033 (Kilotons) (USD Million)
7.5.2. Market estimates and forecasts, By Type, 2018 – 2033 (Kilotons) (USD Million)
7.5.3. Market estimates and forecasts, By Product, 2018 – 2033 (Kilotons) (USD Million)
7.5.4. Market estimates and forecasts, By Source, 2018 – 2033 (Kilotons) (USD Million)
7.5.5. China
7.5.5.1. China Enzymes Market Estimates & Forecasts, 2018 – 2033 (Kilotons) (USD Million)
7.5.5.2. Market estimates and forecasts, By Type, 2018 – 2033 (Kilotons) (USD Million)
7.5.5.3. Market estimates and forecasts, By Product, 2018 – 2033 (Kilotons) (USD Million)
7.5.5.4. Market estimates and forecasts, By Source, 2018 – 2033 (Kilotons) (USD Million)
7.5.6. India
7.5.6.1. India Enzymes Market Estimates & Forecasts, 2018 – 2033 (Kilotons) (USD Million)
7.5.6.2. Market estimates and forecasts, By Type, 2018 – 2033 (Kilotons) (USD Million)
7.5.6.3. Market estimates and forecasts, By Product, 2018 – 2033 (Kilotons) (USD Million)
7.5.6.4. Market estimates and forecasts, By Source, 2018 – 2033 (Kilotons) (USD Million)
7.5.7. Japan
7.5.7.1. Japan Enzymes Market Estimates & Forecasts, 2018 – 2033 (Kilotons) (USD Million)
7.5.7.2. Market estimates and forecasts, By Type, 2018 – 2033 (Kilotons) (USD Million)
7.5.7.3. Market estimates and forecasts, By Product, 2018 – 2033 (Kilotons) (USD Million)
7.5.7.4. Market estimates and forecasts, By Source, 2018 – 2033 (Kilotons) (USD Million)
7.5.8. South Korea
7.5.8.1. South Korea Enzymes Market Estimates & Forecasts, 2018 – 2033 (Kilotons) (USD Million)
7.5.8.2. Market estimates and forecasts, By Type, 2018 – 2033 (Kilotons) (USD Million)
7.5.8.3. Market estimates and forecasts, By Product, 2018 – 2033 (Kilotons) (USD Million)
7.5.8.4. Market estimates and forecasts, By Source, 2018 – 2033 (Kilotons) (USD Million)
7.5.9. Indonesia
7.5.9.1. Indonesia Enzymes Market Estimates & Forecasts, 2018 – 2033 (Kilotons) (USD Million)
7.5.9.2. Market estimates and forecasts, By Type, 2018 – 2033 (Kilotons) (USD Million)
7.5.9.3. Market estimates and forecasts, By Product, 2018 – 2033 (Kilotons) (USD Million)
7.5.9.4. Market estimates and forecasts, By Source, 2018 – 2033 (Kilotons) (USD Million)
7.5.10. Australia
7.5.10.1. Australia Enzymes Market Estimates & Forecasts, 2018 – 2033 (Kilotons) (USD Million)
7.5.10.2. Market estimates and forecasts, By Type, 2018 – 2033 (Kilotons) (USD Million)
7.5.10.3. Market estimates and forecasts, By Product, 2018 – 2033 (Kilotons) (USD Million)
7.5.10.4. Market estimates and forecasts, By Source, 2018 – 2033 (Kilotons) (USD Million)
7.6. Latin America
7.6.1. Latin America Enzymes Market Estimates & Forecasts, 2018 – 2033 (Kilotons) (USD Million)
7.6.2. Market estimates and forecasts, By Type, 2018 – 2033 (Kilotons) (USD Million)
7.6.3. Market estimates and forecasts, By Product, 2018 – 2033 (Kilotons) (USD Million)
7.6.4. Market estimates and forecasts, By Source, 2018 – 2033 (Kilotons) (USD Million)
7.6.5. Brazil
7.6.5.1. Brazil Enzymes Market Estimates & Forecasts, 2018 – 2033 (Kilotons) (USD Million)
7.6.5.2. Market estimates and forecasts, By Type, 2018 – 2033 (Kilotons) (USD Million)
7.6.5.3. Market estimates and forecasts, By Product, 2018 – 2033 (Kilotons) (USD Million)
7.6.5.4. Market estimates and forecasts, By Source, 2018 – 2033 (Kilotons) (USD Million)
7.6.6. Argentina
7.6.6.1. Argentina Enzymes Market Estimates & Forecasts, 2018 – 2033 (Kilotons) (USD Million)
7.6.6.2. Market estimates and forecasts, By Type, 2018 – 2033 (Kilotons) (USD Million)
7.6.6.3. Market estimates and forecasts, By Product, 2018 – 2033 (Kilotons) (USD Million)
7.6.6.4. Market estimates and forecasts, By Source, 2018 – 2033 (Kilotons) (USD Million)
7.7. Middle East & Africa
7.7.1. Middle East & Africa Enzymes Market Estimates & Forecasts, 2018 – 2033 (Kilotons) (USD Million)
7.7.2. Market estimates and forecasts, By Type, 2018 – 2033 (Kilotons) (USD Million)
7.7.3. Market estimates and forecasts, By Product, 2018 – 2033 (Kilotons) (USD Million)
7.7.4. Market estimates and forecasts, By Source, 2018 – 2033 (Kilotons) (USD Million)
7.7.5. Saudi Arabia
7.7.5.1. Saudi Arabia Enzymes Market Estimates & Forecasts, 2018 – 2033 (Kilotons) (USD Million)
7.7.5.2. Market estimates and forecasts, By Type, 2018 – 2033 (Kilotons) (USD Million)
7.7.5.3. Market estimates and forecasts, By Product, 2018 – 2033 (Kilotons) (USD Million)
7.7.5.4. Market estimates and forecasts, By Source, 2018 – 2033 (Kilotons) (USD Million)
7.7.6. South Africa
7.7.6.1. South Africa Enzymes Market Estimates & Forecasts, 2018 – 2033 (Kilotons) (USD Million)
7.7.6.2. Market estimates and forecasts, By Type, 2018 – 2033 (Kilotons) (USD Million)
7.7.6.3. Market estimates and forecasts, By Product, 2018 – 2033 (Kilotons) (USD Million)
7.7.6.4. Market estimates and forecasts, By Source, 2018 – 2033 (Kilotons) (USD Million)
7.7.7. Türkiye
7.7.7.1. Türkiye Enzymes Market Estimates & Forecasts, 2018 – 2033 (Kilotons) (USD Million)
7.7.7.2. Market estimates and forecasts, By Type, 2018 – 2033 (Kilotons) (USD Million)
7.7.7.3. Market estimates and forecasts, By Product, 2018 – 2033 (Kilotons) (USD Million)
7.7.7.4. Market estimates and forecasts, By Source, 2018 – 2033 (Kilotons) (USD Million)
Chapter 8. Competitive Landscape
8.1. Key Global Players & Recent Developments & Their Impact on the Industry
8.2. Company/Competition Categorization
8.3. Company Market Position Analysis, 2025
8.4. Company Heat Map Analysis
8.5. Strategy Mapping
8.5.1. Expansions
8.5.2. Mergers & Acquisitions
8.5.3. Collaborations/Partnerships/Agreements
8.5.4. New Product Launches
8.5.5. Others
Chapter 9. Company Listing (Overview, Financial Performance, Products Overview)
9.1. BASF
9.1.1. Company Overview
9.1.2. Financial Performance
9.1.3. Product Benchmarking
9.2. Novonesis
9.2.1. Company Overview
9.2.2. Financial Performance
9.2.3. Product Benchmarking
9.3. International Flavors & Fragrances (IFF)
9.3.1. Company Overview
9.3.2. Financial Performance
9.3.3. Product Benchmarking
9.4. DSM
9.4.1. Company Overview
9.4.2. Financial Performance
9.4.3. Product Benchmarking
9.5. Novus International, Inc.
9.5.1. Company Overview
9.5.2. Financial Performance
9.5.3. Product Benchmarking
9.6. Associated British Foods plc
9.6.1. Company Overview
9.6.2. Financial Performance
9.6.3. Product Benchmarking
9.7. Kerry
9.7.1. Company Overview
9.7.2. Financial Performance
9.7.3. Product Benchmarking
9.8. Advanced Enzyme Technologies
9.8.1. Company Overview
9.8.2. Financial Performance
9.8.3. Product Benchmarking
9.9. Amano Enzyme Inc.
9.9.1. Company Overview
9.9.2. Financial Performance
9.9.3. Product Benchmarking
9.10. Adisseo
9.10.1. Company Overview
9.10.2. Financial Performance
9.10.3. Product Benchmarking
List of Tables
Table 1 Global enzymes market estimates and forecasts, by Type, 2018 – 2033 (Kilotons) (USD Million)
Table 2 Industrial enzymes market estimates and forecasts, 2018 – 2033 (Kilotons) (USD Million)
Table 3 Food & Beverages Industrial enzymes market estimates and forecasts, 2018 – 2033 (Kilotons) (USD Million)
Table 4 Detergents Industrial enzymes market estimates and forecasts, 2018 – 2033 (Kilotons) (USD Million)
Table 5 Animal Feed Industrial enzymes market estimates and forecasts, 2018 – 2033 (Kilotons) (USD Million)
Table 6 Biofuels Industrial enzymes market estimates and forecasts, 2018 – 2033 (Kilotons) (USD Million)
Table 7 Textiles Industrial enzymes market estimates and forecasts, 2018 – 2033 (Kilotons) (USD Million)
Table 8 Pulp & Paper Industrial enzymes market estimates and forecasts, 2018 – 2033 (Kilotons) (USD Million)
Table 9 Nutraceutical Industrial enzymes market estimates and forecasts, 2018 – 2033 (Kilotons) (USD Million)
Table 10 Personal Care & Cosmetics Industrial enzymes market estimates and forecasts, 2018 – 2033 (Kilotons) (USD Million)
Table 11 Wastewater Industrial enzymes market estimates and forecasts, 2018 – 2033 (Kilotons) (USD Million)
Table 12 Other Industrial enzymes market estimates and forecasts, 2018 – 2033 (Kilotons) (USD Million)
Table 13 Specialty enzymes market estimates and forecasts, 2018 – 2033 (Kilotons) (USD Million)
Table 14 Pharmaceutical Specialty enzymes market estimates and forecasts, 2018 – 2033 (Kilotons) (USD Million)
Table 15 Research & Biotechnology Specialty enzymes market estimates and forecasts, 2018 – 2033 (Kilotons) (USD Million)
Table 16 Diagnostics Specialty enzymes market estimates and forecasts, 2018 – 2033 (Kilotons) (USD Million)
Table 17 Biocatalyst Specialty enzymes market estimates and forecasts, 2018 – 2033 (Kilotons) (USD Million)
Table 18 Global enzymes market estimates and forecasts, by Product, 2018 – 2033 (Kilotons) (USD Million)
Table 19 Carbohydrases Product enzymes market estimates and forecasts, 2018 – 2033 (Kilotons) (USD Million)
Table 20 Proteases Product enzymes market estimates and forecasts, 2018 – 2033 (Kilotons) (USD Million)
Table 21 Lipases Product enzymes market estimates and forecasts, 2018 – 2033 (Kilotons) (USD Million)
Table 22 Polymerases & Nucleases Product enzymes market estimates and forecasts, 2018 – 2033 (Kilotons) (USD Million)
Table 23 Other Product enzymes market estimates and forecasts, 2018 – 2033 (Kilotons) (USD Million)
Table 24 Global enzymes market estimates and forecasts, by Source, 2018 – 2033 (Kilotons) (USD Million)
Table 25 Plant based enzymes market estimates and forecasts, 2018 – 2033 (Kilotons) (USD Million)
Table 26 Animals based enzymes market estimates and forecasts, 2018 – 2033 (Kilotons) (USD Million)
Table 27 Microorganisms-based enzymes market estimates and forecasts, 2018 – 2033 (Kilotons) (USD Million)
Table 28 Global enzymes market estimates and forecasts, by Region, 2018 – 2033 (Kilotons) (USD Million)
Table 29 North America Enzymes market estimates and forecasts, 2018 – 2033 (Kilotons) (USD Million)
Table 30 North America Enzymes market estimates and forecasts, by Type, 2018 – 2033 (Kilotons) (USD Million)
Table 31 North America Enzymes market estimates and forecasts, by Product, 2018 – 2033 (Kilotons) (USD Million)
Table 32 North America Enzymes market estimates and forecasts, by Source, 2018 – 2033 (Kilotons) (USD Million)
Table 33 U.S. Enzymes market estimates and forecasts, 2018 – 2033 (Kilotons) (USD Million)
Table 34 U.S. Enzymes market estimates and forecasts, by Type, 2018 – 2033 (Kilotons) (USD Million)
Table 35 U.S. Enzymes market estimates and forecasts, by Product, 2018-2033 (Units) (USD Million) (Kilotons)
Table 36 U.S. Enzymes market estimates and forecasts, by Source, 2018-2033 (Units) (USD Million) (Kilotons)
Table 37 Canada Enzymes market estimates and forecasts, 2018 – 2033 (Kilotons) (USD Million)
Table 38 Canada Enzymes market estimates and forecasts, by Type, 2018 – 2033 (Kilotons) (USD Million)
Table 39 Canada Enzymes market estimates and forecasts, by Product, 2018 – 2033 (Kilotons) (USD Million)
Table 40 Canada Enzymes market estimates and forecasts, by Source, 2018 – 2033 (Kilotons) (USD Million)
Table 41 Mexico Enzymes market estimates and forecasts, 2018 – 2033 (Kilotons) (USD Million)
Table 42 Mexico Enzymes market estimates and forecasts, by Type, 2018 – 2033 (Kilotons) (USD Million)
Table 43 Mexico Enzymes market estimates and forecasts, by Product, 2018 – 2033 (Kilotons) (USD Million)
Table 44 Mexico Enzymes market estimates and forecasts, by Source, 2018 – 2033 (Kilotons) (USD Million)
Table 45 Europe Enzymes market estimates and forecasts, 2018 – 2033 (Kilotons) (USD Million)
Table 46 Europe Enzymes market estimates and forecasts, by Type, 2018 – 2033 (Kilotons) (USD Million)
Table 47 Europe Enzymes market estimates and forecasts, by Product, 2018 – 2033 (Kilotons) (USD Million)
Table 48 Europe Enzymes market estimates and forecasts, by Source, 2018 – 2033 (Kilotons) (USD Million)
Table 49 Germany Enzymes market estimates and forecasts, 2018 – 2033 (Kilotons) (USD Million)
Table 50 Germany Enzymes market estimates and forecasts, by Type, 2018 – 2033 (Kilotons) (USD Million)
Table 51 Germany Enzymes market estimates and forecasts, by Product, 2018 – 2033 (Kilotons) (USD Million)
Table 52 Germany Enzymes market estimates and forecasts, by Source, 2018 – 2033 (Kilotons) (USD Million)
Table 53 UK Enzymes market estimates and forecasts, 2018 – 2033 (Kilotons) (USD Million)
Table 54 UK Enzymes market estimates and forecasts, by Type, 2018 – 2033 (Kilotons) (USD Million)
Table 55 UK Enzymes market estimates and forecasts, by Product, 2018 – 2033 (Kilotons) (USD Million)
Table 56 UK Enzymes market estimates and forecasts, by Source, 2018 – 2033 (Kilotons) (USD Million)
Table 57 France Enzymes market estimates and forecasts, 2018 – 2033 (Kilotons) (USD Million)
Table 58 France Enzymes market estimates and forecasts, by Type, 2018 – 2033 (Kilotons) (USD Million)
Table 59 France Enzymes market estimates and forecasts, by Product, 2018 – 2033 (Kilotons) (USD Million)
Table 60 France Enzymes market estimates and forecasts, by Source, 2018 – 2033 (Kilotons) (USD Million)
Table 61 Italy Enzymes market estimates and forecasts, 2018 – 2033 (Kilotons) (USD Million)
Table 62 Italy Enzymes market estimates and forecasts, by Type, 2018 – 2033 (Kilotons) (USD Million)
Table 63 Italy Enzymes market estimates and forecasts, by Product, 2018 – 2033 (Kilotons) (USD Million)
Table 64 Italy Enzymes market estimates and forecasts, by Source, 2018 – 2033 (Kilotons) (USD Million)
Table 65 Spain Enzymes market estimates and forecasts, 2018 – 2033 (Kilotons) (USD Million)
Table 66 Spain Enzymes market estimates and forecasts, by Type, 2018 – 2033 (Kilotons) (USD Million)
Table 67 Spain Enzymes market estimates and forecasts, by Product, 2018 – 2033 (Kilotons) (USD Million)
Table 68 Spain Enzymes market estimates and forecasts, by Source, 2018 – 2033 (Kilotons) (USD Million)
Table 69 Asia Pacific Enzymes market estimates and forecasts, 2018 – 2033 (Kilotons) (USD Million)
Table 70 Asia Pacific Enzymes market estimates and forecasts, by Type, 2018 – 2033 (Kilotons) (USD Million)
Table 71 Asia Pacific Enzymes market estimates and forecasts, by Product, 2018 – 2033 (Kilotons) (USD Million)
Table 72 Asia Pacific Enzymes market estimates and forecasts, by Source, 2018 – 2033 (Kilotons) (USD Million)
Table 73 China Enzymes market estimates and forecasts, 2018 – 2033 (Kilotons) (USD Million)
Table 74 China Enzymes market estimates and forecasts, by Type, 2018 – 2033 (Kilotons) (USD Million)
Table 75 China Enzymes market estimates and forecasts, by Product, 2018 – 2033 (Kilotons) (USD Million)
Table 76 China Enzymes market estimates and forecasts, by Source, 2018 – 2033 (Kilotons) (USD Million)
Table 77 Japan Enzymes market estimates and forecasts, 2018 – 2033 (Kilotons) (USD Million)
Table 78 Japan Enzymes market estimates and forecasts, by Type, 2018 – 2033 (Kilotons) (USD Million)
Table 79 Japan Enzymes market estimates and forecasts, by Product, 2018 – 2033 (Kilotons) (USD Million)
Table 80 Japan Enzymes market estimates and forecasts, by Source, 2018 – 2033 (Kilotons) (USD Million)
Table 81 India Enzymes market estimates and forecasts, 2018 – 2033 (Kilotons) (USD Million)
Table 82 India Enzymes market estimates and forecasts, by Type, 2018 – 2033 (Kilotons) (USD Million)
Table 83 India Enzymes market estimates and forecasts, by Product, 2018 – 2033 (Kilotons) (USD Million)
Table 84 India Enzymes market estimates and forecasts, by Source, 2018 – 2033 (Kilotons) (USD Million)
Table 85 South Korea Enzymes market estimates and forecasts, 2018 – 2033 (Kilotons) (USD Million)
Table 86 South Korea Enzymes market estimates and forecasts, by Type, 2018 – 2033 (Kilotons) (USD Million)
Table 87 South Korea Enzymes market estimates and forecasts, by Product, 2018 – 2033 (Kilotons) (USD Million)
Table 88 South Korea Enzymes market estimates and forecasts, by Source, 2018 – 2033 (Kilotons) (USD Million)
Table 89 Indonesia Enzymes market estimates and forecasts, 2018 – 2033 (Kilotons) (USD Million)
Table 90 Indonesia Enzymes market estimates and forecasts, by Type, 2018 – 2033 (Kilotons) (USD Million)
Table 91 Indonesia Enzymes market estimates and forecasts, by Product, 2018 – 2033 (Kilotons) (USD Million)
Table 92 Indonesia Enzymes market estimates and forecasts, by Source, 2018 – 2033 (Kilotons) (USD Million)
Table 93 Australia Enzymes market estimates and forecasts, 2018 – 2033 (Kilotons) (USD Million)
Table 94 Australia Enzymes market estimates and forecasts, by Type, 2018 – 2033 (Kilotons) (USD Million)
Table 95 Australia Enzymes market estimates and forecasts, by Product, 2018 – 2033 (Kilotons) (USD Million)
Table 96 Australia Enzymes market estimates and forecasts, by Source, 2018 – 2033 (Kilotons) (USD Million)
Table 97 Latin America Enzymes market estimates and forecasts, 2018 – 2033 (Kilotons) (USD Million)
Table 98 Latin America Enzymes market estimates and forecasts, by Type, 2018 – 2033 (Kilotons) (USD Million)
Table 99 Latin America Enzymes market estimates and forecasts, by Product, 2018 – 2033 (Kilotons) (USD Million)
Table 100 Latin America Enzymes market estimates and forecasts, by Source, 2018 – 2033 (Kilotons) (USD Million)
Table 101 Brazil Enzymes market estimates and forecasts, 2018 – 2033 (Kilotons) (USD Million)
Table 102 Brazil Enzymes market estimates and forecasts, by Type, 2018 – 2033 (Kilotons) (USD Million)
Table 103 Brazil Enzymes market estimates and forecasts, by Product, 2018 – 2033 (Kilotons) (USD Million)
Table 104 Brazil Enzymes market estimates and forecasts, by Source, 2018 – 2033 (Kilotons) (USD Million)
Table 105 Argentina Enzymes market estimates and forecasts, 2018 – 2033 (Kilotons) (USD Million)
Table 106 Argentina Enzymes market estimates and forecasts, by Type, 2018 – 2033 (Kilotons) (USD Million)
Table 107 Argentina Enzymes market estimates and forecasts, by Product, 2018 – 2033 (Kilotons) (USD Million)
Table 108 Argentina Enzymes market estimates and forecasts, by Source, 2018 – 2033 (Kilotons) (USD Million)
Table 109 Middle East & Africa Enzymes market estimates and forecasts, 2018 – 2033 (Kilotons) (USD Million)
Table 110 Middle East & Africa Enzymes market estimates and forecasts, by Type, 2018 – 2033 (Kilotons) (USD Million)
Table 111 Middle East & Africa Enzymes market estimates and forecasts, by Product, 2018 – 2033 (Kilotons) (USD Million)
Table 112 Middle East & Africa Enzymes market estimates and forecasts, by Source, 2018 – 2033 (Kilotons) (USD Million)
Table 113 Saudi Arabia Enzymes market estimates and forecasts, 2018 – 2033 (Kilotons) (USD Million)
Table 114 Saudi Arabia Enzymes market estimates and forecasts, by Type, 2018 – 2033 (Kilotons) (USD Million)
Table 115 Saudi Arabia Enzymes market estimates and forecasts, by Product, 2018 – 2033 (Kilotons) (USD Million)
Table 116 Saudi Arabia Enzymes market estimates and forecasts, by Source, 2018 – 2033 (Kilotons) (USD Million)
Table 117 South Africa Enzymes market estimates and forecasts, 2018 – 2033 (Kilotons) (USD Million)
Table 118 South Africa Enzymes market estimates and forecasts, by Type, 2018 – 2033 (Kilotons) (USD Million)
Table 119 South Africa Enzymes market estimates and forecasts, by Product, 2018 – 2033 (Kilotons) (USD Million)
Table 120 South Africa Enzymes market estimates and forecasts, by Source, 2018 – 2033 (Kilotons) (USD Million)
Table 121 Türkiye Enzymes market estimates and forecasts, 2018 – 2033 (Kilotons) (USD Million)
Table 122 Türkiye Enzymes market estimates and forecasts, by Type, 2018 – 2033 (Kilotons) (USD Million)
Table 123 Türkiye Enzymes market estimates and forecasts, by Product, 2018 – 2033 (Kilotons) (USD Million)
Table 124 Türkiye Enzymes market estimates and forecasts, by Source, 2018 – 2033 (Kilotons) (USD Million)
List of Figures
Fig. 1 Information Procurement
Fig. 2 Primary Research Pattern
Fig. 3 Primary Research Process
Fig. 4 Market Research Approaches – Bottom-Up Approach
Fig. 5 Market Research Approaches – Top-down Approach
Fig. 6 Market Research Approaches – Combined Approach
Fig. 7 Global Enzymes Market- Market Snapshot
Fig. 8 Global Enzymes Market- Segment Snapshot (1/2)
Fig. 9 Global Enzymes Market- Segment Snapshot (2/2)
Fig. 10 Global Enzymes Market- Competitive Landscape Snapshot
Fig. 11 Global Enzymes Market: Value Chain Analysis
Fig. 12 Global Enzymes Market: Porter’s Five Force Analysis
Fig. 13 Global Enzymes Market: PESTEL Analysis
Fig. 14 Global Enzymes Market: Type Movement Analysis, 2025 & 2033
Fig. 15 Global Enzymes Market: Product Movement Analysis, 2025 & 2033
Fig. 16 Global Enzymes Market: Source Movement Analysis, 2025 & 2033
Fig. 17 Global Enzymes Market: Regional Movement Analysis, 2025 & 2033
Fig. 18 Global Enzymes Market: Company Positioning Analysis
Fig. 19 Global Enzymes Market: Strategy Mapping