Biodegradable Cutlery Market Size, Share & Trends Analysis Report By Raw Material (Wood, Husk, Paper, Plastic), By Region (North America, Europe, Asia Pacific, Latin America, Middle East & Africa), And Segment Forecasts, 2026 - 2033
生分解性カトラリー市場 - 原材料(木材、殻、紙、プラスチック)、地域別(北米、欧州、アジア太平洋、ラテンアメリカ、中東・アフリカ)、およびセグメント別予測による市場規模、成長と動向分析レポート 2026-2033年
| 出版 | Grand View Research |
| 出版年月 | 2026年02月 |
| ページ数 | 110 |
| 価格 | 記載以外のライセンスについてはお問合せください |
| シングルユーザ | USD 3,950 |
| 種別 | 英文調査報告書 |
| 商品番号 | SMR-16567 |

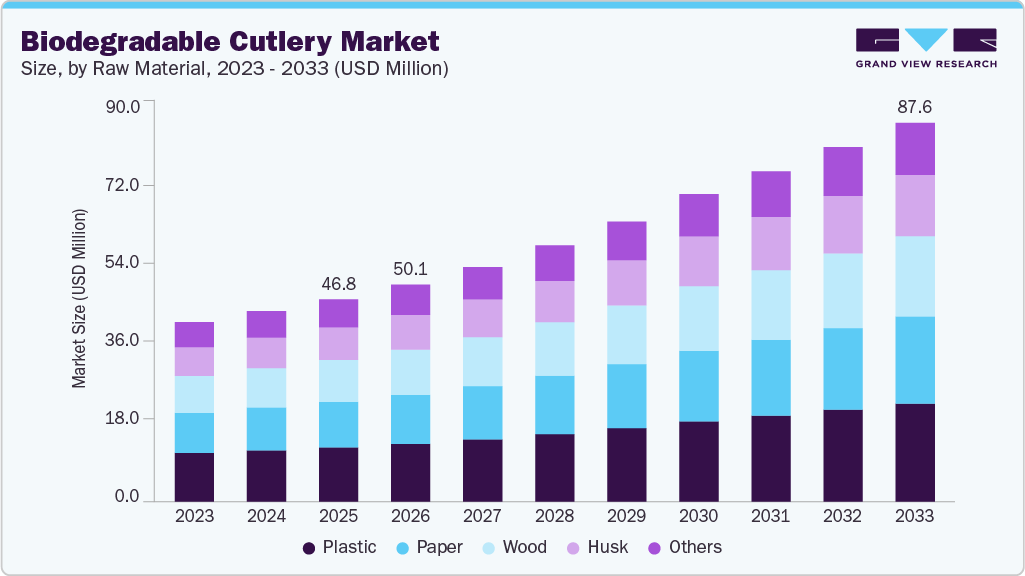
世界の生分解性カトラリー市場規模は、2025年には4,680万米ドルと推定され、2033年には8,760万米ドルに達するとGrand View Researchでは予測しています、2026年から2033年にかけて年平均成長率(CAGR)8.3%で成長すると見込まれています。環境意識の高まりが大きな成長要因となっており、消費者はプラスチック廃棄物、埋め立て地への蓄積、海洋汚染によって引き起こされる長期的な被害をますます認識するようになり、マイクロプラスチックを発生させない堆肥化可能で自然分解可能な代替品を好むようになっています。
主要市場動向と洞察
- 地域別に見ると、生分解性カトラリー市場は欧州が牽引し、2025年には36.6%のシェアを占めると予測されています。
- ドイツの生分解性カトラリー産業は、2026年から2033年にかけて最も高い年平均成長率(CAGR)で成長すると見込まれています。
- 原材料別に見ると、生分解性プラスチックが市場をリードし、2025年には26.8%のシェアを占めると予測されています。
同時に、多くの国で実施されている政府の政策やプラスチック禁止措置は、厳しい規制、制限、罰則を課すことで、使い捨てプラスチックからの脱却を加速させています。これにより、食品サービス事業者や小売業者は生分解性プラスチック製品の採用を余儀なくされています。
企業は、環境への取り組みを示すとともに事業活動における環境負荷を軽減するため、環境に優しいカトラリーを企業の社会的責任(CSR)戦略にますます組み込んでいます。ホスピタリティ、食品サービス、小売業界の企業は、従来のプラスチック製食器を生分解性代替品、特に成長著しい竹製カトラリー市場に置き換えています。竹製カトラリーは、耐久性、天然素材、堆肥化可能なソリューションを提供し、持続可能性目標に合致し、環境基準を満たし、環境意識の高い消費者のニーズに応えるものです。この変化は、廃棄物の削減に役立つだけでなく、ブランドイメージの向上、顧客からの信頼構築、そして競争の激しい持続可能性重視の市場における企業の差別化にもつながります。
Biodegradable Cutlery Market Summary
The global biodegradable cutlery market size was estimated at USD 46.8 million in 2025 and is expected to reach USD 87.6 million by 2033, growing at a CAGR of 8.3% from 2026 to 2033. Rising environmental awareness is a major growth driver, as consumers increasingly recognize the long-term damage caused by plastic waste, landfill accumulation, and marine pollution, leading them to prefer compostable and naturally degradable alternatives that do not generate microplastics.
Key Market Trends & Insights
- By region, Europeled the biodegradable cutlery market and accounted for a share of 36.6% in 2025.
- The Germany biodegradable cutlery industry is expected to grow at the fastest CAGR from 2026 to 2033
- By raw material, biodegradable plastic led the market, accounting for a share of 26.8% in 2025.
Market Size & Forecast
- 2025 Market Size: USD 46.8 Million
- 2033 Projected Market Size: USD 87.6 Million
- CAGR (2026-2033): 8.3%
- Europe: Largest market in 2025
At the same time, government policies and plastic bans across many countries are accelerating the shift away from single-use plastics by enforcing strict regulations, restrictions, and penalties, compelling foodservice providers and retailers to adopt biodegradable options.
Companies are increasingly integrating eco-friendly cutlery into their corporate social responsibility (CSR) strategies to demonstrate environmental commitment and reduce their operational footprint. Businesses in the hospitality, foodservice, and retail sectors are replacing conventional plastic utensils with biodegradable alternatives, particularly from the growing bamboo cutlery market, which offers durable, natural, and compostable solutions to align with sustainability goals, comply with green standards, and appeal to environmentally conscious consumers. This shift not only helps minimize waste but also strengthens brand reputation, builds customer trust, and differentiates companies in a competitive, sustainability-focused market.
Innovation and product diversity are playing a key role in the growth of the biodegradable cutlery industry, with manufacturers introducing new formats such as edible cutlery, compostable plant-based materials, and enhanced bamboo or fiber-based variants to improve durability, functionality, and sustainability. These advancements not only reduce environmental impact but also cater to evolving consumer preferences for convenient, waste-free dining solutions, helping brands differentiate their offerings while supporting the broader shift toward sustainable and eco-friendly foodservice practices.
In India, several companies are making edible, eco-friendly cutlery mainstream as part of this trend, blending sustainability with local enterprise and social impact. For example, Kerala-based Thoosan produces edible tableware from wheat bran that can either be eaten or biodegraded without harm, reducing single-use plastic waste and providing additional income to farmers. Likewise, Bangalore-based Gajamukha Foods’ EdiblePRO offers over 80 natural, zero-waste cutlery variants made from grains and pulses, supporting rural employment while promoting sustainable consumption habits. These initiatives highlight how innovative, consumable cutlery products are gaining traction and contributing to broader sustainable dining and environmental goals.
Compostable cutlery and tableware are the best alternatives to non-biodegradable plastics and are one of the emerging green businesses. The rising awareness of the adverse effects of non-biodegradable plastic includes severe consequences for aquatic animals. This is one of the major drivers of market growth. For instance, according to the data provided by the U.S., more than 8 million tons of plastic is dumped into the ocean every year globally. Another global report suggests there may already be more than 5.25 trillion micro- and macroplastic particles in the ocean. These adverse effects drive the usage of biodegradable materials.
Key Biodegradable Cutlery Company Insights
Leading players in the biodegradable cutlery market include Huhtamäki Oyj, Biotrem, and Vegware. Companies are increasingly focusing on material innovation, certified compostable products, and performance-enhanced designs, such as sturdy plant-based forks, heat-resistant spoons, and durable knives, to meet the evolving needs of environmentally conscious consumers and commercial buyers. In addition, brands are introducing premium sustainable options made from wood, bamboo, bagasse, and bioplastics, along with customizable and bulk solutions for restaurants, catering services, and events, helping differentiate offerings while aligning with global sustainability and plastic-reduction goals.
Key Biodegradable Cutlery Companies:
The following key companies have been profiled for this study on the biodegradable cutlery market.
- Huhtamäki Oyj
- Biotrem
- BIOPAK; BETTER EARTH LLC
- Vegware
- Pactiv LLC
- Eco Guardian
- Genpak, LLC
- Bionatic GmbH & Co. KG
- GreenGood USA
Recent Developments
- In June 2025, designers and startups in Bengaluru turned agricultural waste such as rice husk and wheat straw into biodegradable tableware and cutlery as alternatives to single-use plastics ahead of World Environment Day 2025. They used these materials to make durable, eco-friendly plates, cups, and utensils that could decompose naturally and reduce plastic pollution.
- In October 2025, researchers at the Indian Institute of Technology Roorkee’s INNOPAP Lab developed eco-friendly tableware from wheat straw, an agricultural residue that was often burned, causing air pollution. They converted the wheat straw into durable, heat-resistant, biodegradable, and compostable tableware that was food-safe, offering an alternative to single-use plastics and helping reduce both plastic waste and crop residue burning.
Biodegradable Cutlery Market Report Scope
| Report Attribute | Details |
| Market size value in 2026 | USD 50.1 million |
| Revenue forecast in 2033 | USD 87.6 million |
| Growth rate | CAGR of 8.3% from 2026 to 2033 |
| Actuals | 2021 – 2025 |
| Forecast period | 2026 – 2033 |
| Quantitative units | Revenue in USD million and CAGR from 2026 to 2033 |
| Report coverage | Revenue forecast, company ranking, competitive landscape, growth factors, and trends |
| Segments covered | Raw material, region |
| Region covered | North America; Europe; Asia Pacific; Central & South America; Middle East & Africa |
| Country covered | U.S.; Canada; Mexico; UK; Germany; France; Spain; Italy; China; Japan; India ; South Korea; Australia & New Zealand; Brazil; South Africa |
| Key companies profiled | Huhtamäki Oyj; Biotrem; BIOPAK; BETTER EARTH LLC; Vegware; Pactiv LLC; Eco Guardian; Genpak, LLC; Bionatic GmbH & Co. KG; GreenGood USA |
| Customization scope | Free report customization (equivalent up to 8 analysts’ working days) with purchase. Addition or alteration to country, regional & segment scope. |
Global Biodegradable Cutlery Market Report Segmentation
This report forecasts revenue growth at the global, regional & country levels and provides an analysis of the latest trends and opportunities in each sub-segment from 2021 to 2033. For this study, Grand View Research has segmented the biodegradable cutlery market report based on raw material and region:
- Raw Material Outlook (Revenue, USD Million, 2021 – 2033)
- Wood
- Husk
- Paper
- Plastic
- Others
- Regional Outlook (Revenue, USD Million, 2021 – 2033)
- North America
- U.S.
- Canada
- Mexico
- Europe
- UK
- Germany
- France
- Spain
- Italy
- Asia Pacific
- China
- Japan
- India
- South Korea
- Australia & New Zealand
- Latin America
- Brazil
- Middle East and Africa (MEA)
- South Africa
- North America
Table of Contents
Chapter 1. Methodology and Scope
1.1. Market Segmentation & Scope
1.2. Market Definition
1.3. Information Procurement
1.3.1. Purchased Database
1.3.2. GVR’s Internal Database
1.3.3. Secondary Sources & Third-Party Perspectives
1.3.4. Primary Research
1.4. Information Analysis
1.4.1. Data Analysis Models
1.5. Market Formulation & Data Visualization
1.6. Data Validation & Publishing
Chapter 2. Executive Summary
2.1. Market Outlook
2.2. Raw Material Outlook
2.3. Region Outlook
Chapter 3. Biodegradable Cutlery Market Variables, Trends & Scope
3.1. Market Lineage Outlook
3.2. Penetration and Growth Mapping Prospect
3.3. Industry Value Chain Analysis
3.3.1. Raw Material Outlook
3.3.2. Technology Trends
3.4. Market Dynamics
3.4.1. Market Driver Analysis
3.4.2. Market Restraint Analysis
3.4.3. Industry Challenges
3.4.4. Industry Opportunities
3.5. Business Environment Analysis
3.5.1. Industry Analysis – Porter’s
3.6. Market Entry Strategies
Chapter 4. Consumer Behavior Analysis
4.1. Demographics Analysis
4.2. Consumer Trends & Preferences
4.3. Factors Influencing Buying Behavior
4.4. Consumer Product Adoption Trends
4.5. Observations & Recommendations
Chapter 5. Biodegradable Cutlery Market: Raw Material Estimates & Trend Analysis
5.1. Biodegradable Cutlery Market, By Raw Material: Key Takeaways
5.2. Raw Material Movement Analysis & Market Share, 2025 & 2033
5.3. Market Estimates & Forecasts, by Raw Material, 2021 – 2033 (USD Million)
5.4. Wood
5.4.1. Market estimates and forecast, 2021 – 2033 (USD Million)
5.5. Husk
5.5.1. Market estimates and forecast, 2021 – 2033 (USD Million)
5.6. Paper
5.6.1. Market estimates and forecast, 2021 – 2033 (USD Million)
5.7. Plastic
5.7.1. Market estimates and forecast, 2021 – 2033 (USD Million)
5.8. Others
5.8.1. Market estimates and forecast, 2021 – 2033 (USD Million)
Chapter 6. Biodegradable Cutlery Market Regional Estimates & Trend Analysis
6.1. Biodegradable Cutlery Market: Regional Outlook
6.2. Regional Movement Analysis & Market Share, 2025 & 2033
6.3. Market Estimates & Forecasts, by Region & Country, 2021 – 2033 (USD Million)
6.4. North America
6.4.1. Market estimates and forecast, 2021 – 2033 (USD Million)
6.4.2. U.S.
6.4.2.1. Key country dynamics
6.4.2.2. Market estimates and forecast, 2021 – 2033 (USD Million)
6.4.3. Canada
6.4.3.1. Key country dynamics
6.4.3.2. Market estimates and forecast, 2021 – 2033 (USD Million)
6.4.4. Mexico
6.4.4.1. Key country dynamics
6.4.4.2. Market estimates and forecast, 2021 – 2033 (USD Million)
6.5. Europe
6.5.1. Market estimates and forecast, 2021 – 2033 (USD Million)
6.5.2. UK
6.5.2.1. Key country dynamics
6.5.2.2. Market estimates and forecast, 2021 – 2033 (USD Million)
6.5.3. Germany
6.5.3.1. Key country dynamics
6.5.3.2. Market estimates and forecast, 2021 – 2033 (USD Million)
6.5.4. France
6.5.4.1. Key country dynamics
6.5.4.2. Market estimates and forecast, 2021 – 2033 (USD Million)
6.5.5. Spain
6.5.5.1. Key country dynamics
6.5.5.2. Market estimates and forecast, 2021 – 2033 (USD Million)
6.5.6. Italy
6.5.6.1. Key country dynamics
6.5.6.2. Market estimates and forecast, 2021 – 2033 (USD Million)
6.6. Asia Pacific
6.6.1. Market estimates and forecast, 2021 – 2033 (USD Million)
6.6.2. China
6.6.2.1. Key country dynamics
6.6.2.2. Market estimates and forecast, 2021 – 2033 (USD Million)
6.6.3. Japan
6.6.3.1. Key country dynamics
6.6.3.2. Market estimates and forecast, 2021 – 2033 (USD Million)
6.6.4. India
6.6.4.1. Market estimates and forecast, 2021 – 2033 (USD Million)
6.6.5. South Korea
6.6.5.1. Key country dynamics
6.6.5.2. Market estimates and forecast, 2021 – 2033 (USD Million)
6.6.6. Australia & New Zealand
6.6.6.1. Key country dynamics
6.6.6.2. Market estimates and forecast, 2021 – 2033 (USD Million)
6.7. Latin America
6.7.1. Market estimates and forecast, 2021 – 2033 (USD Million)
6.7.2. Brazil
6.7.2.1. Key country dynamics
6.7.2.2. Market estimates and forecast, 2021 – 2033 (USD Million)
6.8. Middle East and Africa
6.8.1. Market estimates and forecast, 2021 – 2033 (USD Million)
6.8.2. South Africa
6.8.2.1. Key country dynamics
6.8.2.2. Market estimates and forecast, 2021 – 2033 (USD Million)
Chapter 7. Competitive Analysis
7.1. Recent developments & impact analysis, by key market participants
7.2. Company Categorization
7.3. Participant’s Overview
7.4. Financial Performance
7.5. Product Benchmarking
7.6. Company Market Share Analysis, 2025 (%)
7.7. Company Heat Map Analysis
7.8. Strategy Mapping
7.9. Company Profiles
7.9.1. Huhtamäki Oyj
7.9.1.1. Company Overview
7.9.1.2. Financial Performance
7.9.1.3. Product Portfolios
7.9.1.4. Strategic Initiatives
7.9.2. Biotrem
7.9.2.1. Company Overview
7.9.2.2. Financial Performance
7.9.2.3. Product Portfolios
7.9.2.4. Strategic Initiatives
7.9.3. BIOPAK; BETTER EARTH LLC
7.9.3.1. Company Overview
7.9.3.2. Financial Performance
7.9.3.3. Product Portfolios
7.9.3.4. Strategic Initiatives
7.9.4. Vegware
7.9.4.1. Company Overview
7.9.4.2. Financial Performance
7.9.4.3. Product Portfolios
7.9.4.4. Strategic Initiatives
7.9.5. Pactiv LLC
7.9.5.1. Company Overview
7.9.5.2. Financial Performance
7.9.5.3. Product Portfolios
7.9.5.4. Strategic Initiatives
7.9.6. Eco Guardian
7.9.6.1. Company Overview
7.9.6.2. Financial Performance
7.9.6.3. Product Portfolios
7.9.6.4. Strategic Initiatives
7.9.7. Genpak, LLC
7.9.7.1. Company Overview
7.9.7.2. Financial Performance
7.9.7.3. Product Portfolios
7.9.7.4. Strategic Initiatives
7.9.8. Bionatic GmbH & Co. KG
7.9.8.1. Company Overview
7.9.8.2. Financial Performance
7.9.8.3. Product Portfolios
7.9.8.4. Strategic Initiatives
7.9.9. GreenGood USA
7.9.9.1. Company Overview
7.9.9.2. Financial Performance
7.9.9.3. Product Portfolios
7.9.9.4. Strategic Initiatives
List of Tables
Table 1. Biodegradable cutlery market – Key market driver analysis
Table 2. Biodegradable cutlery market – Key market restraint analysis
Table 3. Biodegradable cutlery market estimates and forecast 2021 – 2033 (USD Million)
Table 4. Biodegradable cutlery market revenue estimates and forecast by raw material, 2021 – 2033 (USD Million)
Table 5. Biodegradable cutlery market revenue estimates and forecast by Region, 2021 – 2033 (USD Million)
Table 6. North America biodegradable cutlery market revenue estimates and forecast by country, 2021 – 2033 (USD Million)
Table 7. U.S. macro-economic outlay
Table 8. U.S. biodegradable cutlery market estimates and forecast, 2021 – 2033 (USD Million)
Table 9. U.S. biodegradable cutlery market revenue estimates and forecast by raw material, 2021 – 2033 (USD Million)
Table 10. Canada macro-economic outlay
Table 11. Canada biodegradable cutlery market estimates and forecast, 2021 – 2033 (USD Million)
Table 12. Canada biodegradable cutlery market revenue estimates and forecast by raw material, 2021 – 2033 (USD Million)
Table 13. Mexico macro-economic outlay
Table 14. Mexico biodegradable cutlery market estimates and forecast, 2021 – 2033 (USD Million)
Table 15. Mexico biodegradable cutlery market revenue estimates and forecast by raw material, 2021 – 2033 (USD Million)
Table 16. Europe biodegradable cutlery market estimates and forecast, 2021 – 2033 (USD Million)
Table 17. UK macro-economic outlay
Table 18. UK biodegradable cutlery market estimates and forecast, 2021 – 2033 (USD Million)
Table 19. UK biodegradable cutlery market revenue estimates and forecast by raw material, 2021 – 2033 (USD Million)
Table 20. Germany macro-economic outlay
Table 21. Germany biodegradable cutlery market estimates and forecast 2021 – 2033 (USD Million)
Table 22. Germany biodegradable cutlery market revenue estimates and forecast by raw material, 2021 – 2033 (USD Million)
Table 23. France macro-economic outlay
Table 24. France biodegradable cutlery market estimates and forecast 2021 – 2033 (USD Million)
Table 25. France biodegradable cutlery market revenue estimates and forecast by raw material, 2021 – 2033 (USD Million)
Table 26. Italy macro-economic outlay
Table 27. Italy biodegradable cutlery market estimates and forecast 2021 – 2033 (USD Million)
Table 28. Italy biodegradable cutlery market revenue estimates and forecast by raw material, 2021 – 2033 (USD Million)
Table 29. Spain macro-economic outlay
Table 30. Spain biodegradable cutlery market estimates and forecast 2021 – 2033 (USD Million)
Table 31. Spain biodegradable cutlery market revenue estimates and forecast by raw material, 2021 – 2033 (USD Million)
Table 32. Asia Pacific biodegradable cutlery market estimates and forecast, 2021 – 2033 (USD Million)
Table 33. China macro-economic outlay
Table 34. China biodegradable cutlery market estimates and forecast, 2021 – 2033 (USD Million)
Table 35. China biodegradable cutlery market revenue estimates and forecast by raw material, 2021 – 2033 (USD Million)
Table 36. India macro-economic outlay
Table 37. India biodegradable cutlery market estimates and forecast 2021 – 2033 (USD Million)
Table 38. India biodegradable cutlery market revenue estimates and forecast by raw material, 2021 – 2033 (USD Million)
Table 39. Japan macro-economic outlay
Table 40. Japan biodegradable cutlery market estimates and forecast 2021 – 2033 (USD Million)
Table 41. Japan biodegradable cutlery market revenue estimates and forecast by raw material, 2021 – 2033 (USD Million)
Table 42. South Korea macro-economic outlay
Table 43. South Korea biodegradable cutlery market estimates and forecast 2021 – 2033 (USD Million)
Table 44. South Korea biodegradable cutlery market revenue estimates and forecast by raw material, 2021 – 2033 (USD Million)
Table 45. Australia & New Zealand macro-economic outlay
Table 46. Australia & New Zealand biodegradable cutlery market estimates and forecast 2021 – 2033 (USD Million)
Table 47. Australia & New Zealand biodegradable cutlery market revenue estimates and forecast by raw material, 2021 – 2033 (USD Million)
Table 48. Latin America biodegradable cutlery market estimates and forecast, 2021 – 2033 (USD Million)
Table 49. Brazil macro-economic outlay
Table 50. Brazil biodegradable cutlery market estimates and forecast, 2021 – 2033 (USD Million)
Table 51. Brazil biodegradable cutlery market estimates and forecast by raw material, 2021 – 2033 (USD Million)
Table 52. Middle East & Africa biodegradable cutlery market estimates and forecast, 2021 – 2033 (USD Million)
Table 53. South Africa macro-economic outlay
Table 54. South Africa biodegradable cutlery market estimates and forecast, 2021 – 2033 (USD Million)
Table 55. South Africa biodegradable cutlery market revenue estimates and forecast by raw material, 2021 – 2033 (USD Million)
List of Figures
Fig. 1 Biodegradable cutlery market snapshot
Fig. 2 Biodegradable cutlery market segmentation & scope
Fig. 3 Biodegradable cutlery market: Value chain analysis
Fig. 4 Biodegradable cutlery market dynamics
Fig. 5 Biodegradable cutlery market: Porter’s Five Forces analysis
Fig. 6 Biodegradable cutlery market, by raw material: Key takeaways
Fig. 7 Biodegradable cutlery market, by raw material: Market share, 2025 & 2033
Fig. 8 Wood cutlery market estimates & forecasts, 2021 – 2033 (USD Million)
Fig. 9 Husk cutlery market estimates & forecasts, 2021 – 2033 (USD Million)
Fig. 10 Paper cutlery market estimates & forecasts, 2021 – 2033 (USD Million)
Fig. 11 Biodegradable plastic cutlery market estimates & forecasts, 2021 – 2033 (USD Million)
Fig. 12 Other biodegradable cutlery market estimates & forecasts, by others, 2021 – 2033 (USD Million)
Fig. 13 Biodegradable cutlery market: regional movement analysis, 2025 & 2033 (%)
Fig. 14 North America biodegradable cutlery market estimates & forecasts, 2021 – 2033 (USD Million)
Fig. 15 US biodegradable cutlery market estimates & forecasts, 2021 – 2033 (USD Million)
Fig. 16 Canada biodegradable cutlery market estimates & forecasts, 2021 – 2033 (USD Million)
Fig. 17 Mexico biodegradable cutlery market estimates & forecasts, 2021 – 2033 (USD Million)
Fig. 18 Europe biodegradable cutlery market estimates & forecasts, 2021 – 2033 (USD Million)
Fig. 19 UK biodegradable cutlery market estimates & forecasts, 2021 – 2033 (USD Million)
Fig. 20 Germany biodegradable cutlery market estimates & forecasts, 2021 – 2033 (USD Million)
Fig. 21 France biodegradable cutlery market estimates & forecasts, 2021 – 2033 (USD Million)
Fig. 22 Spain biodegradable cutlery market estimates & forecasts, 2021 – 2033 (USD Million)
Fig. 23 Italy biodegradable cutlery market estimates & forecast, 2021 – 2033 (USD Million)
Fig. 24 Asia Pacific biodegradable cutlery market estimates & forecasts, 2021 – 2033 (USD Million)
Fig. 25 China biodegradable cutlery market estimates & forecasts, 2021 – 2033 (USD Million)
Fig. 26 Japan biodegradable cutlery market estimates & forecasts, 2021 – 2033 (USD Million)
Fig. 27 India biodegradable cutlery market estimates & forecasts, 2021 – 2033 (USD Million)
Fig. 28 South Korea biodegradable cutlery market estimates & forecasts, 2021 – 2033 (USD Million)
Fig. 29 Australia & New Zealand biodegradable cutlery market estimates & forecasts, 2021 – 2033 (USD Million)
Fig. 30 Latin America biodegradable cutlery market estimates & forecasts, 2021 – 2033 (USD Million)
Fig. 31 Brazil biodegradable cutlery market estimates & forecasts, 2021 – 2033 (USD Million)
Fig. 32 Middle East & Africa biodegradable cutlery market estimates & forecasts, 2021 – 2033 (USD Million)
Fig. 33 South Africa biodegradable cutlery market estimates & forecasts, 2021 – 2033 (USD Million)
Fig. 34 Key company categorization
Fig. 35 Company market share analysis, 2025