Carbon Capture & Storage Market Size, Share & Trends Analysis Report By Capture Technology (Post Combustion, Industrial Process, Pre-combustion, Oxy-Combustion), By Application (Power Generation, Oil & Gas), By Region, And Segment Forecasts, 2026 - 2033
二酸化炭素回収・貯留市場 - 回収技術(燃焼後回収、工業プロセス回収、燃焼前回収、酸素燃焼)、用途別(発電、石油・ガス)、地域、セグメント別予測による市場規模、成長と動向分析レポート 2026-2033年
| 出版 | Grand View Research |
| 出版年月 | 2026年02月 |
| ページ数 | 150 |
| 価格 | 記載以外のライセンスについてはお問合せください |
| シングルユーザ | USD 5,950 |
| 種別 | 英文調査報告書 |
| 商品番号 | SMR-1642416424 |

世界の二酸化炭素回収・貯留市場規模は、2025年には39億2155万米ドルと評価され、2033年までに67億1931万米ドルに達すると予測されており、2026年から2033年にかけて年平均成長率(CAGR)7.0%で成長すると見込まれています。この業界は、脱炭素化に対する世界的な関心の高まり、厳格な排出削減義務、そして産業および発電部門における炭素排出削減技術への投資の増加によって牽引されている。
主要市場動向と洞察
- 北米の二酸化炭素回収・貯留(CCS)市場は、2025年時点で世界市場の36.89%を占め、最大のシェアを獲得しました。
- 米国のCCS市場は、予測期間中に大幅な成長が見込まれています。
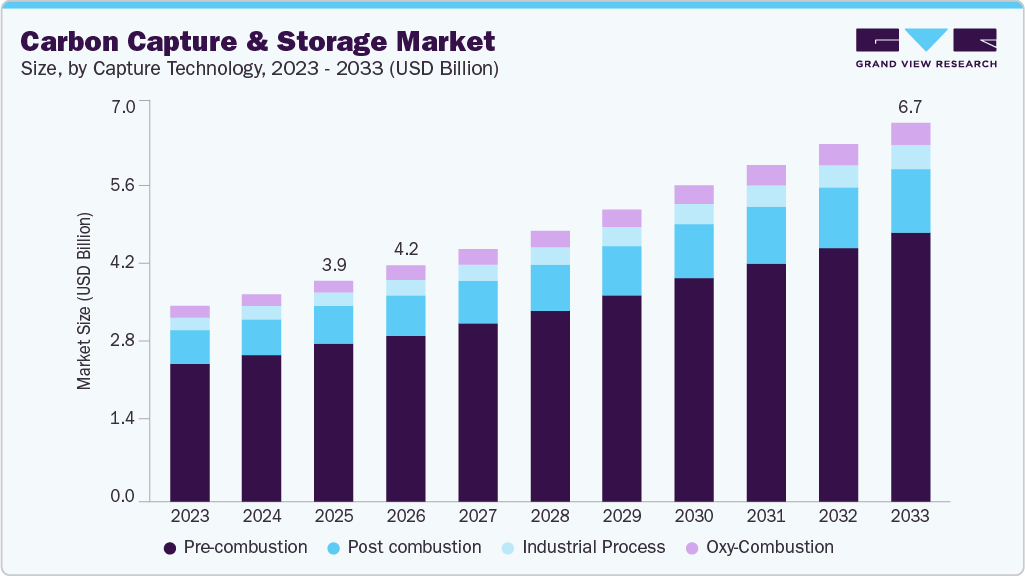
- 回収技術別に見ると、燃焼前回収方式が2025年時点で71.80%と最大の市場シェアを占めました。
二酸化炭素回収・輸送・利用・貯蔵(CCS)システムは、セメント、鉄鋼、石油・ガスといったエネルギー集約型産業からのCO₂排出量削減において極めて重要な役割を果たしています。回収効率の継続的な技術革新に加え、炭素利用プロジェクトや石油増進回収(EOR)技術の導入拡大が、CCSの普及をさらに加速させています。さらに、政府の支援政策、税制優遇措置、大規模実証プロジェクトへの資金提供などが市場開発を促進し、CCSは長期的なネットゼロ目標と気候変動対策目標の達成に不可欠な要素として位置づけられています。
世界のCCS市場は発電部門が中心であり、導入規模の大部分を占めています。石炭火力発電所やガス火力発電所は依然として主要なCO₂排出源であり、厳しい排出削減目標や規制要件を満たすためにCCS技術の導入がますます進んでいます。発電施設からの二酸化炭素回収は、温室効果ガス排出量の削減に貢献するだけでなく、既存インフラの継続的な利用を可能にしながら、低炭素エネルギーシステムへの移行を支援します。 CCSを、統合ガス化複合発電(IGCC)や熱電併給(CHP)プラントなどの先進的な発電技術と統合することで、システム全体の効率が向上し、CCSは世界の電力セクターの脱炭素化において重要な役割を果たすものとなる。
Carbon Capture & Storage Market Summary
The global carbon capture & storage market size was valued at USD 3,921.55 million in 2025 and is projected to reach USD 6,719.31 million by 2033, growing at a CAGR of 7.0% from 2026 to 2033. The industry is driven by the rising global focus on decarbonization, stringent emission reduction mandates, and increasing investments in carbon mitigation technologies across industrial and power generation sectors.
Key Market Trends & Insights
- North America carbon capture & storage market held the largest share of 36.89% of the global market in 2025.
- The carbon capture & storage market in the U.S. is expected to grow significantly over the forecast period.
- By capture technology, pre-combustion held the highest market share of 71.80% in 2025.
Market Size & Forecast
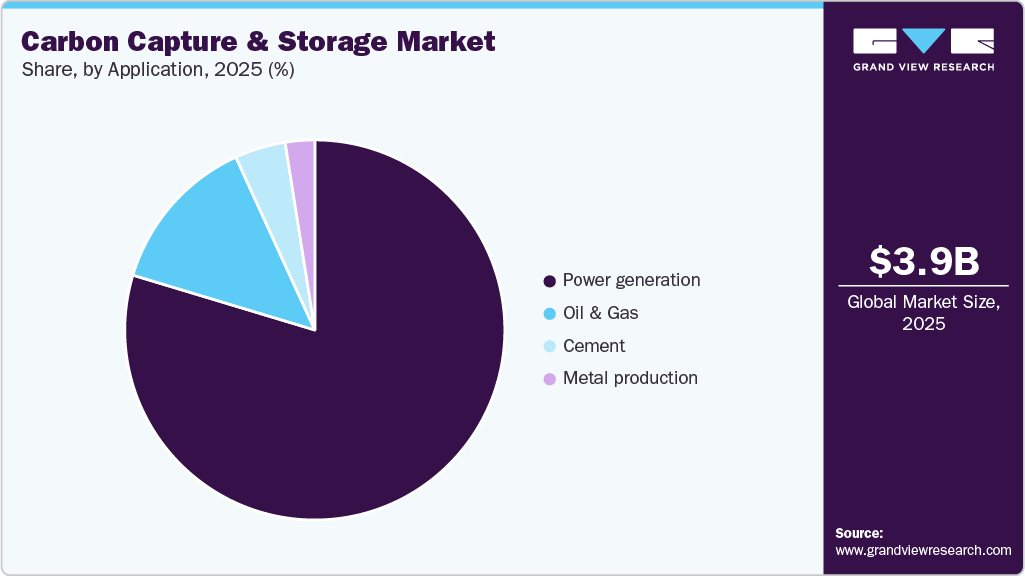
- 2025 Market Size: USD 3,921.55 Million
- 2033 Projected Market Size: USD 6,719.31 Million
- CAGR (2026-2033): 7.0%
- North America: Largest market in 2025
- Asia Pacific: Fastest growing market
CCS systems, encompassing carbon capture, transportation, utilization, and storage, play a vital role in reducing CO₂ emissions from energy-intensive industries such as cement, steel, and oil & gas. Continuous technological advancements in capture efficiency, coupled with growing deployment of carbon utilization projects and enhanced oil recovery applications, are further accelerating adoption. Moreover, supportive government policies, tax incentives, and funding for large-scale demonstration projects are enhancing market development, positioning CCS as a critical enabler in achieving long-term net-zero and climate sustainability goals.
The global CCS market is dominated by the power generation sector, which accounts for a significant share of deployment. Coal- and gas-fired power plants remain major CO₂ emitters, and CCS technologies are increasingly implemented to meet stringent emission reduction targets and regulatory requirements. Capturing carbon from power generation facilities not only helps reduce greenhouse gas emissions but also supports the transition to low-carbon energy systems while allowing continued use of existing infrastructure. Integration of CCS with advanced power generation technologies, such as integrated gasification combined cycle (IGCC) and combined heat and power (CHP) plants, enhances overall system efficiency and positions CCS as a critical enabler in decarbonizing the electricity sector globally.
In addition to power generation, industrial applications-including oil & gas, metal production, cement, and other heavy industries-represent significant growth opportunities for the CCS market. In the oil & gas sector, captured CO₂ is often utilized for enhanced oil recovery (EOR), providing both economic value and emission reduction benefits. Industries such as cement and steel face inherent process emissions that cannot be fully mitigated through renewable energy, making CCS a vital tool for achieving net-zero goals. Furthermore, emerging applications in chemicals, bioenergy, and hydrogen production are driving diversification within the market. Across these sectors, ongoing investments in pilot projects, technological advancements, and supportive policies are fostering broader adoption, positioning CCS as an essential solution for industrial decarbonization and sustainable development.
Application Insights
The power generation segment held the largest revenue share of 70.11% in 2025, leading the application landscape of the global carbon capture & storage market. This dominance is largely driven by the significant carbon emissions produced by coal- and natural gas-fired power plants, prompting utilities to integrate carbon capture technologies to comply with tightening environmental regulations and decarbonization targets. The ability of carbon capture systems to substantially reduce greenhouse gas emissions while maintaining a baseload power supply has reinforced their adoption across large-scale power facilities.
carbon-capture-storage-market-share
Increasing investments in retrofitting existing power plants with capture systems, along with the development of new low-emission thermal plants, have further accelerated segment growth. Supportive government policies, carbon pricing mechanisms, and funding for clean energy infrastructure continue to encourage deployment in the power sector. Moreover, the growing need for reliable electricity alongside the global transition toward net-zero emissions is expected to sustain the segment’s leadership, particularly in regions heavily dependent on fossil fuel-based power generation.
Key Carbon Capture & Storage Company Insights
Some of the key players operating in the global carbon capture & storage market include Shell PLC; Aker Solutions; Equinor ASA; Dakota Gasification Company; Linde plc; Siemens Energy; Fluor Corporation; Sulzer Ltd.; Mitsubishi Heavy Industries Ltd. (MHI); Japan CCS Co. Ltd; Carbon Engineering Ltd; LanzaTech. These companies focus on the development, deployment, and management of carbon capture, transportation, utilization, and storage solutions. Their activities include industrial-scale CCS projects, enhanced oil recovery applications, direct air capture systems, and integration with hydrogen and bioenergy facilities, driving technological advancement and market growth across all regions.
Key Carbon Capture & Storage Companies:
The following key companies have been profiled for this study on the carbon capture & storage market.
- Aker Solutions
- Dakota Gasification Company
- Equinor ASA
- Fluor Corporation
- Japan CCS Co. Ltd
- Linde plc
- Mitsubishi Heavy Industries Ltd. (MHI)
- Shell PLC
- Siemens Energy
- Sulzer Ltd.
Recent Developments
- In March 2025, Equinor, Shell, and TotalEnergies announced a USD 714 million investment to expand the Northern Lights CCS project. This expansion aims to increase CO₂ storage capacity from 1.5 million to over 5 million tons annually by 2028.
- In February 2025, Carbfix hf. announced an expansion in its global footprint by launching a new carbon capture plant in Iceland. This plant is expected to capture 3,000 tons of carbon annually.
Global Carbon Capture & Storage Market Report Segmentation
This report forecasts volume & revenue growth at global, regional, and country levels and provides an analysis of the latest industry trends in each of the sub-segments from 2021 to 2033. For this study, Grand View Research has segmented the global carbon capture & storage market report on the basis of capture technology, application, and region.
- Capture Technology Outlook (Volume in Million Tons; Revenue, USD Million, 2021 – 2033)
- Post combustion
- Industrial Process
- Pre-combustion
- Oxy-Combustion
- Application Outlook (Volume in Million Tons; Revenue, USD Million, 2021 – 2033)
- Power generation
- Oil & Gas
- Metal production
- Cement
- Others
- Regional Outlook (Volume in Million Tons; Revenue, USD Million, 2021 – 2033)
- North America
- U.S.
- Canada
- Mexico
- Europe
- Germany
- UK
- France
- Italy
- Spain
- Norway
- Asia Pacific
- China
- India
- Japan
- South Korea
- Australia
- Latin America
- Brazil
- Argentina
- Middle East & Africa
- Saudi Arabia
- UAE
- South Africa
- North America
Table of Contents
Chapter 1. Methodology and Scope
1.1. Market Segmentation & Scope
1.2. Market Definition
1.3. Information Procurement
1.3.1. Information Analysis
1.3.2. Market Formulation & Data Visualization
1.3.3. Data Validation & Publishing
1.4. Research Scope and Assumptions
1.4.1. List of Data Sources
Chapter 2. Executive Summary
2.1. Market Snapshot
2.2. Segmental Outlook
2.3. Competitive Outlook
Chapter 3. Market Variables, Trends, and Scope
3.1. Market Lineage Outlook
3.2. Value Chain Analysis
3.3. Regulatory Framework
3.3.1. Standards & Compliance
3.3.2. Regulatory Impact Analysis
3.4. Market Dynamics
3.4.1. Market Driver Analysis
3.4.2. Market Restraint Analysis
3.4.3. Market Opportunities
3.4.4. Market Challenges
3.5. Porter’s Five Forces Analysis
3.5.1. Bargaining Power of Suppliers
3.5.2. Bargaining Power of Buyers
3.5.3. Threat of Substitution
3.5.4. Threat of New Entrants
3.5.5. Competitive Rivalry
3.6. PESTLE Analysis
3.6.1. Political
3.6.2. Economic
3.6.3. Social Landscape
3.6.4. Technology
3.6.5. Environmental
3.6.6. Legal
Chapter 4. Carbon Capture & Storage Market: Capture Technology Estimates & Trend Analysis
4.1. Carbon Capture & Storage Market: Capture Technology Movement Analysis, 2025 & 2033
4.2. Post combustion
4.2.1. Market estimates and forecasts, 2021 – 2033 (Volume Million Tons, USD Million)
4.3. Industrial Process
4.3.1. Market estimates and forecasts, 2021 – 2033 (Volume Million Tons, USD Million)
4.4. Pre-combustion
4.4.1. Market estimates and forecasts, 2021 – 2033 (Volume Million Tons, USD Million)
4.5. Oxy-Combustion
4.5.1. Market estimates and forecasts, 2021 – 2033 (Volume Million Tons, USD Million)
Chapter 5. Carbon Capture & Storage Market: Application Estimates & Trend Analysis
5.1. Carbon Capture & Storage Market: Application Movement Analysis, 2025 & 2033
5.2. Power Generation
5.2.1. Market estimates and forecasts, 2021 – 2033 (Volume Million Tons, USD Million)
5.3. Oil & Gas
5.3.1. Market estimates and forecasts, 2021 – 2033 (Volume Million Tons, USD Million)
5.4. Metal Production
5.4.1. Market estimates and forecasts, 2021 – 2033 (Volume Million Tons, USD Million)
5.5. Cement
5.5.1. Market estimates and forecasts, 2021 – 2033 (Volume Million Tons, USD Million)
5.6. Others
5.6.1. Market estimates and forecasts, 2021 – 2033 (Volume Million Tons, USD Million)
Chapter 6. Carbon Capture & Storage Market: Regional Estimates & Trend Analysis
6.1. Regional Analysis, 2025 & 2033
6.2. North America
6.2.1. Market estimates and forecasts, 2021 – 2033 (Volume Million Tons, USD Million)
6.2.2. Market estimates and forecasts, by technology, 2021 – 2033 (Volume Million Tons, USD Million)
6.2.3. Market estimates and forecasts, by application, 2021 – 2033 (Volume Million Tons, USD Million)
6.2.4. U.S.
6.2.4.1. Market estimates and forecasts, 2021 – 2033 (Volume Million Tons, USD Million)
6.2.4.2. Market estimates and forecasts, by technology, 2021 – 2033 (Volume Million Tons, USD Million)
6.2.4.3. Market estimates and forecasts, by application, 2021 – 2033 (Volume Million Tons, USD Million)
6.2.5. Canada
6.2.5.1. Market estimates and forecasts, 2021 – 2033 (Volume Million Tons, USD Million)
6.2.5.2. Market estimates and forecasts, by technology, 2021 – 2033 (Volume Million Tons, USD Million)
6.2.5.3. Market estimates and forecasts, by application, 2021 – 2033 (Volume Million Tons, USD Million)
6.2.6. Mexico
6.2.6.1. Market estimates and forecasts, 2021 – 2033 (Volume Million Tons, USD Million)
6.2.6.2. Market estimates and forecasts, by technology, 2021 – 2033 (Volume Million Tons, USD Million)
6.2.6.3. Market estimates and forecasts, by application, 2021 – 2033 (Volume Million Tons, USD Million)
6.3. Europe
6.3.1. Market estimates and forecasts, 2021 – 2033 (Volume Million Tons, USD Million)
6.3.2. Market estimates and forecasts, by technology, 2021 – 2033 (Volume Million Tons, USD Million)
6.3.3. Market estimates and forecasts, by application, 2021 – 2033 (Volume Million Tons, USD Million)
6.3.4. Germany
6.3.4.1. Market estimates and forecasts, 2021 – 2033 (Volume Million Tons, USD Million)
6.3.4.2. Market estimates and forecasts, by technology, 2021 – 2033 (Volume Million Tons, USD Million)
6.3.4.3. Market estimates and forecasts, by application, 2021 – 2033 (Volume Million Tons, USD Million)
6.3.5. UK
6.3.5.1. Market estimates and forecasts, 2021 – 2033 (Volume Million Tons, USD Million)
6.3.5.2. Market estimates and forecasts, by technology, 2021 – 2033 (Volume Million Tons, USD Million)
6.3.5.3. Market estimates and forecasts, by application, 2021 – 2033 (Volume Million Tons, USD Million)
6.3.6. France
6.3.6.1. Market estimates and forecasts, 2021 – 2033 (Volume Million Tons, USD Million)
6.3.6.2. Market estimates and forecasts, by technology, 2021 – 2033 (Volume Million Tons, USD Million)
6.3.6.3. Market estimates and forecasts, by application, 2021 – 2033 (Volume Million Tons, USD Million)
6.3.7. Italy
6.3.7.1. Market estimates and forecasts, 2021 – 2033 (Volume Million Tons, USD Million)
6.3.7.2. Market estimates and forecasts, by technology, 2021 – 2033 (Volume Million Tons, USD Million)
6.3.7.3. Market estimates and forecasts, by application, 2021 – 2033 (Volume Million Tons, USD Million)
6.3.8. Spain
6.3.8.1. Market estimates and forecasts, 2021 – 2033 (Volume Million Tons, USD Million)
6.3.8.2. Market estimates and forecasts, by technology, 2021 – 2033 (Volume Million Tons, USD Million)
6.3.8.3. Market estimates and forecasts, by application, 2021 – 2033 (Volume Million Tons, USD Million)
6.3.9. Norway
6.3.9.1. Market estimates and forecasts, 2021 – 2033 (Volume Million Tons, USD Million)
6.3.9.2. Market estimates and forecasts, by technology, 2021 – 2033 (Volume Million Tons, USD Million)
6.3.9.3. Market estimates and forecasts, by application, 2021 – 2033 (Volume Million Tons, USD Million)
6.4. Asia Pacific
6.4.1. Market estimates and forecasts, 2021 – 2033 (Volume Million Tons, USD Million)
6.4.2. Market estimates and forecasts, by technology, 2021 – 2033 (Volume Million Tons, USD Million)
6.4.3. Market estimates and forecasts, by application, 2021 – 2033 (Volume Million Tons, USD Million)
6.4.4. China
6.4.4.1. Market estimates and forecasts, 2021 – 2033 (Volume Million Tons, USD Million)
6.4.4.2. Market estimates and forecasts, by technology, 2021 – 2033 (Volume Million Tons, USD Million)
6.4.4.3. Market estimates and forecasts, by application, 2021 – 2033 (Volume Million Tons, USD Million)
6.4.5. India
6.4.5.1. Market estimates and forecasts, 2021 – 2033 (Volume Million Tons, USD Million)
6.4.5.2. Market estimates and forecasts, by technology, 2021 – 2033 (Volume Million Tons, USD Million)
6.4.5.3. Market estimates and forecasts, by application, 2021 – 2033 (Volume Million Tons, USD Million)
6.4.6. Japan
6.4.6.1. Market estimates and forecasts, 2021 – 2033 (Volume Million Tons, USD Million)
6.4.6.2. Market estimates and forecasts, by technology, 2021 – 2033 (Volume Million Tons, USD Million)
6.4.6.3. Market estimates and forecasts, by application, 2021 – 2033 (Volume Million Tons, USD Million)
6.4.7. South Korea
6.4.7.1. Market estimates and forecasts, 2021 – 2033 (Volume Million Tons, USD Million)
6.4.7.2. Market estimates and forecasts, by technology, 2021 – 2033 (Volume Million Tons, USD Million)
6.4.7.3. Market estimates and forecasts, by application, 2021 – 2033 (Volume Million Tons, USD Million)
6.4.8. Australia
6.4.8.1. Market estimates and forecasts, 2021 – 2033 (Volume Million Tons, USD Million)
6.4.8.2. Market estimates and forecasts, by technology, 2021 – 2033 (Volume Million Tons, USD Million)
6.4.8.3. Market estimates and forecasts, by application, 2021 – 2033 (Volume Million Tons, USD Million)
6.5. Latin America
6.5.1. Market estimates and forecasts, 2021 – 2033 (Volume Million Tons, USD Million)
6.5.2. Market estimates and forecasts, by technology, 2021 – 2033 (Volume Million Tons, USD Million)
6.5.3. Market estimates and forecasts, by application, 2021 – 2033 (Volume Million Tons, USD Million)
6.5.4. Brazil
6.5.4.1. Market estimates and forecasts, 2021 – 2033 (Volume Million Tons, USD Million)
6.5.4.2. Market estimates and forecasts, by technology, 2021 – 2033 (Volume Million Tons, USD Million)
6.5.4.3. Market estimates and forecasts, by application, 2021 – 2033 (Volume Million Tons, USD Million)
6.5.5. Argentina
6.5.5.1. Market estimates and forecasts, 2021 – 2033 (Volume Million Tons, USD Million)
6.5.5.2. Market estimates and forecasts, by technology, 2021 – 2033 (Volume Million Tons, USD Million)
6.5.5.3. Market estimates and forecasts, by application, 2021 – 2033 (Volume Million Tons, USD Million)
6.6. Middle East & Africa
6.6.1. Market estimates and forecasts, 2021 – 2033 (Volume Million Tons, USD Million)
6.6.2. Market estimates and forecasts, by technology, 2021 – 2033 (Volume Million Tons, USD Million)
6.6.3. Market estimates and forecasts, by application, 2021 – 2033 (Volume Million Tons, USD Million)
6.6.4. Saudi Arabia
6.6.4.1. Market estimates and forecasts, 2021 – 2033 (Volume Million Tons, USD Million)
6.6.4.2. Market estimates and forecasts, by technology, 2021 – 2033 (Volume Million Tons, USD Million)
6.6.4.3. Market estimates and forecasts, by application, 2021 – 2033 (Volume Million Tons, USD Million)
6.6.5. UAE
6.6.5.1. Market estimates and forecasts, 2021 – 2033 (Volume Million Tons, USD Million)
6.6.5.2. Market estimates and forecasts, by technology, 2021 – 2033 (Volume Million Tons, USD Million)
6.6.5.3. Market estimates and forecasts, by application, 2021 – 2033 (Volume Million Tons, USD Million)
6.6.6. South Africa
6.6.6.1. Market estimates and forecasts, 2021 – 2033 (Volume Million Tons, USD Million)
6.6.6.2. Market estimates and forecasts, by technology, 2021 – 2033 (Volume Million Tons, USD Million)
6.6.6.3. Market estimates and forecasts, by application, 2021 – 2033 (Volume Million Tons, USD Million)
Chapter 7. Competitive Landscape
7.1. Recent Developments By Key Market Participants
7.2. Company Categorization
7.3. List of Key Component Suppliers & Channel Partners
7.4. Company Market Share & Positioning Analysis, 2025
7.5. Heat Map Analysis
7.6. Vendor Landscape
7.6.1. List of Raw Material Suppliers
7.6.2. List of Distributors/Traders
7.6.3. List of Other Prominent Manufacturers
7.7. List of Prospective End Users
7.8. Strategy Mapping
7.9. Company Profiles/Listing
7.9.1. Shell PLC
7.9.1.1. Company Overview
7.9.1.2. Financial Performance
7.9.1.3. Product Benchmarking
7.9.2. Aker Solutions
7.9.2.1. Company Overview
7.9.2.2. Financial Performance
7.9.2.3. Product Benchmarking
7.9.3. Equinor ASA
7.9.3.1. Company Overview
7.9.3.2. Financial Performance
7.9.3.3. Product Benchmarking
7.9.4. Dakota Gasification Company
7.9.4.1. Company Overview
7.9.4.2. Financial Performance
7.9.4.3. Product Benchmarking
7.9.5. Linde plc
7.9.5.1. Company Overview
7.9.5.2. Financial Performance
7.9.5.3. Product Benchmarking
7.9.6. Siemens Energy
7.9.6.1. Company Overview
7.9.6.2. Financial Performance
7.9.6.3. Product Benchmarking
7.9.7. Fluor Corporation
7.9.7.1. Company Overview
7.9.7.2. Financial Performance
7.9.7.3. Product Benchmarking
7.9.8. Sulzer Ltd.
7.9.8.1. Company Overview
7.9.8.2. Financial Performance
7.9.8.3. Product Benchmarking
7.9.9. Mitsubishi Heavy Industries Ltd. (MHI)
7.9.9.1. Company Overview
7.9.9.2. Financial Performance
7.9.9.3. Product Benchmarking
7.9.10. Japan CCS Co. Ltd
7.9.10.1. Company Overview
7.9.10.2. Financial Performance
7.9.10.3. Product Benchmarking
List of Tables
Table 1 Carbon Capture & Storage Market estimates & forecasts, 2021 – 2033 (Volume Million Tons, USD Million)
Table 2 Post combustion market estimates & forecasts, 2021 – 2033 (Volume Million Tons, USD Million)
Table 3 Industrial Process market estimates & forecasts, 2021 – 2033 (Volume Million Tons, USD Million)
Table 4 Pre-combustion market estimates & forecasts, 2021 – 2033 (Volume Million Tons, USD Million)
Table 5 Power Generation market estimates & forecasts, 2021 – 2033 (Volume Million Tons, USD Million)
Table 6 Oil & Gas market estimates & forecasts, 2021 – 2033 (Volume Million Tons, USD Million)
Table 7 Metal Production market estimates & forecasts, 2021 – 2033 (Volume Million Tons, USD Million)
Table 8 Cement market estimates & forecasts, 2021 – 2033 (Volume Million Tons, USD Million)
Table 9 Others market estimates & forecasts, 2021 – 2033 (Volume Million Tons, USD Million)
Table 10 North America Carbon Capture & Storage Market estimates & forecast, 2021 – 2033 (Volume Million Tons, USD Million)
Table 11 North America Carbon Capture & Storage Market estimates & forecasts by capture technology, 2021 – 2033 (Volume Million Tons, USD Million)
Table 12 North America Carbon Capture & Storage Market estimates & forecasts by application, 2021 – 2033 (Volume Million Tons, USD Million)
Table 13 U.S. Carbon Capture & Storage Market estimates & forecasts, 2021 – 2033 (Volume Million Tons, USD Million)
Table 14 U.S. Carbon Capture & Storage Market estimates & forecasts by capture technology, 2021 – 2033 (Volume Million Tons, USD Million)
Table 15 U.S. Carbon Capture & Storage Market estimates & forecasts by application, 2021 – 2033 (Volume Million Tons, USD Million)
Table 16 Canada Carbon Capture & Storage Market estimates & forecasts, 2021 – 2033 (Volume Million Tons, USD Million)
Table 17 Canada Carbon Capture & Storage Market estimates & forecasts by capture technology, 2021 – 2033 (Volume Million Tons, USD Million)
Table 18 Canada Carbon Capture & Storage Market estimates & forecasts by application, 2021 – 2033 (Volume Million Tons, USD Million)
Table 19 Mexico Carbon Capture & Storage Market estimates & forecasts, 2021 – 2033 (Volume Million Tons, USD Million)
Table 20 Mexico Carbon Capture & Storage Market estimates & forecasts by capture technology, 2021 – 2033 (Volume Million Tons, USD Million)
Table 21 Mexico Carbon Capture & Storage Market estimates & forecasts by application, 2021 – 2033 (Volume Million Tons, USD Million)
Table 22 Europe Carbon Capture & Storage Market estimates & forecasts, 2021 – 2033 (Volume Million Tons, USD Million)
Table 23 Europe Carbon Capture & Storage Market estimates & forecasts by capture technology, 2021 – 2033 (Volume Million Tons, USD Million)
Table 24 Europe Carbon Capture & Storage Market estimates & forecasts by application, 2021 – 2033 (Volume Million Tons, USD Million)
Table 25 Germany Carbon Capture & Storage Market estimates & forecasts, 2021 – 2033 (Volume Million Tons, USD Million)
Table 26 Germany Carbon Capture & Storage Market estimates & forecasts by capture technology, 2021 – 2033 (Volume Million Tons, USD Million)
Table 27 Germany Carbon Capture & Storage Market estimates & forecasts by application, 2021 – 2033 (Volume Million Tons, USD Million)
Table 28 France Carbon Capture & Storage Market estimates & forecasts, 2021 – 2033 (Volume Million Tons, USD Million)
Table 29 France Carbon Capture & Storage Market estimates & forecasts by capture technology, 2021 – 2033 (Volume Million Tons, USD Million)
Table 30 France Carbon Capture & Storage Market estimates & forecasts by application, 2021 – 2033 (Volume Million Tons, USD Million)
Table 31 UK Carbon Capture & Storage Market estimates & forecast, 2021 – 2033 (Volume Million Tons, USD Million)
Table 32 UK Carbon Capture & Storage Market estimates & forecasts by capture technology, 2021 – 2033 (Volume Million Tons, USD Million)
Table 33 UK Carbon Capture & Storage Market estimates & forecasts by application, 2021 – 2033 (Volume Million Tons, USD Million)
Table 34 Italy Carbon Capture & Storage Market estimates & forecast, 2021 – 2033 (Volume Million Tons, USD Million)
Table 35 Italy Carbon Capture & Storage Market estimates & forecasts by capture technology, 2021 – 2033 (Volume Million Tons, USD Million)
Table 36 Italy Carbon Capture & Storage Market estimates & forecasts by application, 2021 – 2033 (Volume Million Tons, USD Million)
Table 37 Spain Carbon Capture & Storage Market estimates & forecast, 2021 – 2033 (Volume Million Tons, USD Million)
Table 38 Spain Carbon Capture & Storage Market estimates & forecasts by capture technology, 2021 – 2033 (Volume Million Tons, USD Million)
Table 39 Spain Carbon Capture & Storage Market estimates & forecasts by application, 2021 – 2033 (Volume Million Tons, USD Million)
Table 40 Norway Carbon Capture & Storage Market estimates & forecast, 2021 – 2033 (Volume Million Tons, USD Million)
Table 41 Norway Carbon Capture & Storage Market estimates & forecasts by capture technology, 2021 – 2033 (Volume Million Tons, USD Million)
Table 42 Norway Carbon Capture & Storage Market estimates & forecasts by application, 2021 – 2033 (Volume Million Tons, USD Million)
Table 43 Asia Pacific Carbon Capture & Storage Market estimates & forecast, 2021 – 2033 (Volume Million Tons, USD Million)
Table 44 Asia Pacific Carbon Capture & Storage Market estimates & forecasts by capture technology, 2021 – 2033 (Volume Million Tons, USD Million)
Table 45 Asia Pacific Carbon Capture & Storage Market estimates & forecasts by application, 2021 – 2033 (Volume Million Tons, USD Million)
Table 46 China Carbon Capture & Storage Market estimates & forecast, 2021 – 2033 (Volume Million Tons, USD Million)
Table 47 China Carbon Capture & Storage Market estimates & forecasts by capture technology, 2021 – 2033 (Volume Million Tons, USD Million)
Table 48 China Carbon Capture & Storage Market estimates & forecasts by application, 2021 – 2033 (Volume Million Tons, USD Million)
Table 49 Japan Carbon Capture & Storage Market estimates & forecast, 2021 – 2033 (Volume Million Tons, USD Million)
Table 50 Japan Carbon Capture & Storage Market estimates & forecasts by capture technology, 2021 – 2033 (Volume Million Tons, USD Million)
Table 51 Japan Carbon Capture & Storage Market estimates & forecasts by application, 2021 – 2033 (Volume Million Tons, USD Million)
Table 52 India Carbon Capture & Storage Market estimates & forecast, 2021 – 2033 (Volume Million Tons, USD Million)
Table 53 India Carbon Capture & Storage Market estimates & forecasts by capture technology, 2021 – 2033 (Volume Million Tons, USD Million)
Table 54 India Carbon Capture & Storage Market estimates & forecasts by application, 2021 – 2033 (Volume Million Tons, USD Million)
Table 55 South Korea Carbon Capture & Storage Market estimates & forecast, 2021 – 2033 (Volume Million Tons, USD Million)
Table 56 South Korea Carbon Capture & Storage Market estimates & forecasts by capture technology, 2021 – 2033 (Volume Million Tons, USD Million)
Table 57 South Korea Carbon Capture & Storage Market estimates & forecasts by application, 2021 – 2033 (Volume Million Tons, USD Million)
Table 58 Australia Carbon Capture & Storage Market estimates & forecast, 2021 – 2033 (Volume Million Tons, USD Million)
Table 59 Australia Carbon Capture & Storage Market estimates & forecasts by capture technology, 2021 – 2033 (Volume Million Tons, USD Million)
Table 60 Australia Carbon Capture & Storage Market estimates & forecasts by application, 2021 – 2033 (Volume Million Tons, USD Million)
Table 61 Latin America Carbon Capture & Storage Market Estimates & forecasts, 2021 – 2033 (Volume Million Tons, USD Million)
Table 62 Latin America Carbon Capture & Storage Market estimates & forecasts by capture technology, 2021 – 2033 (Volume Million Tons, USD Million)
Table 63 Latin America Carbon Capture & Storage Market estimates & forecasts by application, 2021 – 2033 (Volume Million Tons, USD Million)
Table 64 Brazil Carbon Capture & Storage Market estimates & forecasts, 2021 – 2033 (Volume Million Tons, USD Million)
Table 65 Brazil Carbon Capture & Storage Market estimates & forecasts by capture technology, 2021 – 2033 (Volume Million Tons, USD Million)
Table 66 Brazil Carbon Capture & Storage Market estimates & forecasts by application, 2021 – 2033 (Volume Million Tons, USD Million)
Table 67 Argentina Carbon Capture & Storage Market estimates & forecasts, 2021 – 2033 (Volume Million Tons, USD Million)
Table 68 Argentina Carbon Capture & Storage Market estimates & forecasts by capture technology, 2021 – 2033 (Volume Million Tons, USD Million)
Table 69 Argentina Carbon Capture & Storage Market estimates & forecasts by application, 2021 – 2033 (Volume Million Tons, USD Million)
Table 70 Middle East & Africa Carbon Capture & Storage Market estimates & forecast, 2021 – 2033 (Volume Million Tons, USD Million)
Table 71 Middle East & Africa Carbon Capture & Storage Market estimates & forecasts by capture technology, 2021 – 2033 (Volume Million Tons, USD Million)
Table 72 Middle East & Africa Carbon Capture & Storage Market estimates & forecasts by application, 2021 – 2033 (Volume Million Tons, USD Million)
Table 73 Saudi Arabia Carbon Capture & Storage Market estimates & forecasts, 2021 – 2033 (Volume Million Tons, USD Million)
Table 74 Saudi Arabia Carbon Capture & Storage Market estimates & forecasts by capture technology, 2021 – 2033 (Volume Million Tons, USD Million)
Table 75 Saudi Arabia Carbon Capture & Storage Market estimates & forecasts by application, 2021 – 2033 (Volume Million Tons, USD Million)
Table 76 UAE Carbon Capture & Storage Market estimates & forecast, 2021 – 2033 (Volume Million Tons, USD Million)
Table 77 UAE Carbon Capture & Storage Market estimates & forecasts by capture technology, 2021 – 2033 (Volume Million Tons, USD Million)
Table 78 UAE Carbon Capture & Storage Market estimates & forecasts by application, 2021 – 2033 (Volume Million Tons, USD Million)
Table 79 South Africa Carbon Capture & Storage Market estimates & forecast, 2021 – 2033 (Volume Million Tons, USD Million)
Table 80 South Africa Carbon Capture & Storage Market estimates & forecasts by capture technology, 2021 – 2033 (Volume Million Tons, USD Million)
Table 81 South Africa Carbon Capture & Storage Market estimates & forecasts by application, 2021 – 2033 (Volume Million Tons, USD Million)
List of Figures
Fig. 1 Market segmentation
Fig. 2 Information procurement
Fig. 3 Data analysis models
Fig. 4 Market formulation and validation
Fig. 5 Data validating & publishing
Fig. 6 Market snapshot
Fig. 7 Segmental outlook – Technology
Fig. 8 Competitive Outlook
Fig. 9 Carbon Capture & Storage Market outlook, 2021 – 2033 (Volume Million Tons, USD Million)
Fig. 10 Value chain analysis
Fig. 11 Market dynamics
Fig. 12 Porter’s Analysis
Fig. 13 PESTEL Analysis
Fig. 14 Carbon Capture & Storage Market, by capture technology: Key takeaways
Fig. 15 Carbon Capture & Storage Market, by capture technology: Market share, 2025 & 2033
Fig. 16 Carbon Capture & Storage Market, by application: Key takeaways
Fig. 17 Carbon Capture & Storage Market, by application: Market share, 2025 & 2033
Fig. 18 Carbon Capture & Storage Market: regional analysis, 2025 & 2033
Fig. 19 Carbon Capture & Storage Market, by region: Key takeaways