電線・ケーブル市場 - 電圧(低、中、高、超高)、設置(架空、地下)、用途(航空宇宙・防衛、建築・建設)、地域、セグメント別予測による市場規模、成長と動向分析レポート 2026-2033年
Wires And Cables Market Size, Share & Trends Analysis Report By Voltage (Low, Medium, High, Extra-High), By Installation (Overhead, Underground), By End Use (Aerospace and Defense, Building & Construction), By Region, And Segment Forecasts, 2026 - 2033
| 出版 | Grand View Research |
| 出版年月 | 2025年12月 |
| ページ数 | 150 |
| 価格 | 記載以外のライセンスについてはお問合せください |
| シングルユーザ | USD 4,950 |
| 種別 | 英文調査報告書 |
| 商品番号 | SMR-1389413894 |

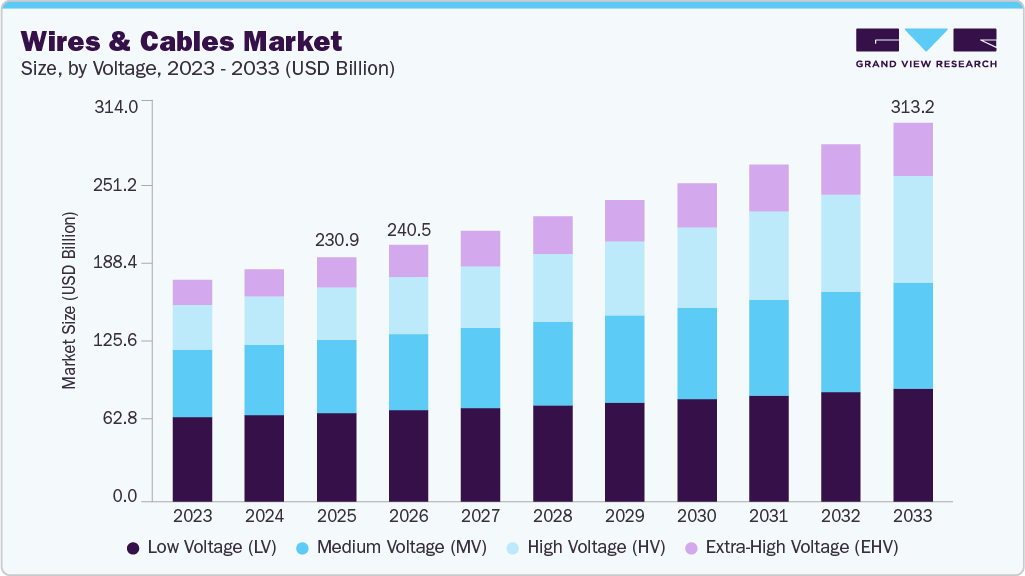
世界の電線・ケーブル市場規模は2025年に2,309億米ドルと評価され、2026年から2033年にかけて年平均成長率3.8%で成長し、2033年には3,131億9,000万米ドルに達すると予測されています。送電・配電システムのスマートなアップグレードやスマートグリッドの開発への投資増加が、市場の成長を牽引すると予想されています。スマートグリッド技術の導入により、グリッド相互接続の需要の高まりが満たされ、新しい地下ケーブルや海底ケーブルへの投資が増加しました。
世界的な都市化の進展とインフラ整備の拡大は、市場を牽引する主要な要因の一つです。これらの要因は、商業、工業、住宅部門における電力・エネルギー需要に影響を与えています。電力網の技術革新は、暴風雨や停電の頻度と期間を低減し、停電後の迅速なサービス復旧を実現するために不可欠です。地球全体の機能は、タイムリーな電力供給にかかっています。
さらに、人口増加は電力需要の増加につながります。スマートグリッドとは、制御、自動化、コンピューター、そして革新的な機器と技術が連携して効率的な電力送電を実現する電力網です。スマートグリッドは、効率的な再生可能エネルギー発電、信頼性の高い電力供給、二酸化炭素排出量の削減、エネルギー源の混合利用、スマートデバイスやスマートホームとの連携、そして電気自動車の利用促進に貢献します。
Wires and Cables Market Summary
The global wires and cables market size was valued at USD 230.90 billion in 2025 and is projected to reach USD 313.19 billion by 2033, growing at a CAGR of 3.8% from 2026 to 2033. Increased investments in smart upgrading of the power transmission and distribution systems and development of smart grids are anticipated to drive the market’s growth.
wires-cables-market-size
Implementation of smart grid technology has met the increasing need for grid interconnections, thus resulting in rising investments in the new underground and submarine cables.
Rising urbanization and growing infrastructure worldwide are some of the major factors driving the market. The said factors have impacted on the power and energy demand in commercial, industrial, and residential sectors. Technological advancement in grids is necessary to reduce the frequency and duration of storm impacts, power outages, and restore service quickly after outages. The functioning of the entire globe depends on the timely delivery of electric supply.
Furthermore, the increasing population leads to a rise in demand for power. The smart grid is an electric grid that includes controls, automation, computers, and innovative equipment & technologies that function together and offer efficient electricity transmission. Smart grid helps generate efficient renewable power, reliable power, reducing carbon footprint, using a mix of energy sources, working with smart devices and smart homes, and encouraging the use of electric vehicles.
Additionally, growing consumer preference for energy management solutions and real-time monitoring systems is raising demand for smarter grid infrastructures. Increasing adoption of distributed energy resources, such as rooftop solar panels and home battery storage, is encouraging grid modernization efforts. Enhanced regulatory frameworks and government incentives aimed at promoting sustainable energy practices also support market expansion.
Wires and Cables Market Report Scope
| Report Attribute | Details |
| Market size in 2026 | USD 240.46 billion |
| Revenue forecast in 2033 | USD 313.19 billion |
| Growth rate | CAGR of 3.8% from 2026 to 2033 |
| Base year for estimation | 2025 |
| Actual data | 2021 – 2024 |
| Forecast period | 2026 – 2033 |
| Quantitative units | Revenue in USD million/billion and CAGR from 2026 to 2033 |
| Report coverage | Revenue forecast, company ranking, competitive landscape, growth factors, and trends |
| Segments covered | Voltage, Installation, End Use, and Regional. |
| Regional scope | North America; Europe; Asia Pacific; Latin America; Middle East & Africa |
| Country scope | U.S.; Canada; Europe; UK; Germany; France; China; Japan; India; South Korea; Australia; Brazil; KSA; UAE; South Africa |
| Key companies profiled | American Wire Group; Amphenol TPC.; Belden Inc.; Encore Wire Corporation; Finolex Cables.; Fujikura Ltd.; Furukawa Electric Co., Ltd.; KEI Industries Limited.; LEONI AG; LS Cable & System Ltd.; Nexans; NKT A/S; Prysmian S.p. A; Sumitomo Electric Industries, Ltd.; Southwire Company, LLC |
| Customization scope | Free report customization (equivalent up to 8 analysts working days) with purchase. Addition or alteration to country, regional & segment scope. |
Global Wires And Cables Market Report Segmentation
This report forecasts revenue growth at global, regional, and country levels and provides an analysis of the latest industry trends in each of the sub-segments from 2021 to 2033. For this study, Grand View Research has segmented the global wires and cables market report based on voltage, installation, end use, and region:
- Voltage Outlook (Revenue, USD Billion, 2021 – 2033)
- Low Voltage (LV)
- Medium Voltage (MV)
- High Voltage (HV)
- Extra-High Voltage (EHV)
- Installation Outlook (Revenue, USD Billion, 2021 – 2033)
- Overhead
- Underground
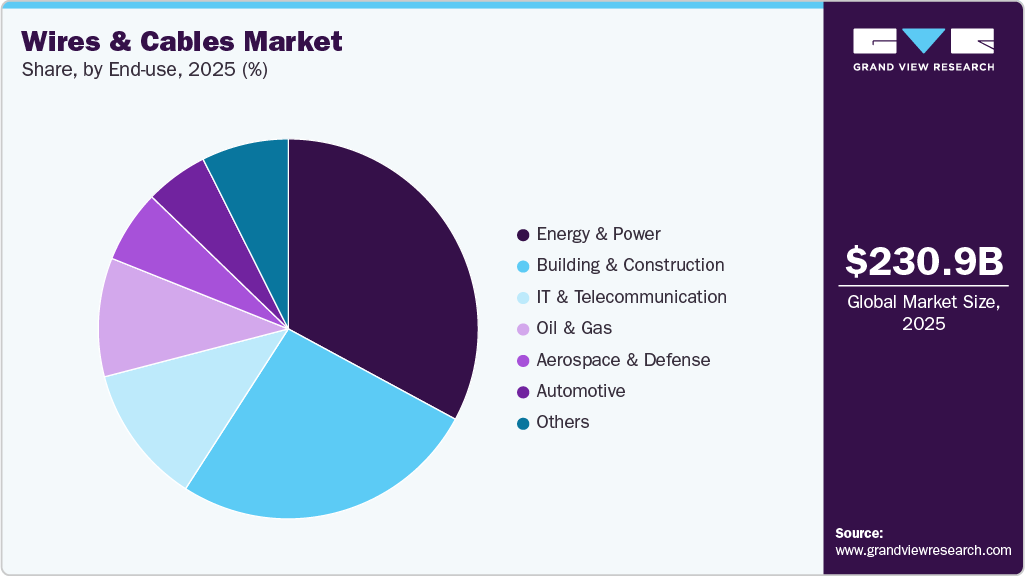
- End Use Outlook (Revenue, USD Billion, 2021 – 2033)
- Aerospace and Defense
- Building & Construction
- Oil and Gas
- Energy and Power
- IT & Telecommunication
- Automotive
- Others
- Regional Outlook (Revenue, USD Billion, 2021 – 2033)
- North America
o U.S.
o Canada
o Mexico
- Europe
o UK
o Germany
o France
- Asia Pacific
o China
o Japan
o India
o South Korea
o Australia
- Latin America
o Brazil
- Middle East and Africa (MEA)
o KSA
o UAE
o South Africa
Table of Contents
Chapter 1. Methodology and Scope
1.1. Market Segmentation and Scope
1.2. Market Definition
1.3. Research Methodology
1.3.1. Information Procurement
1.3.2. Information or Data Analysis
1.3.3. Market Formulation & Data Visualization
1.3.4. Data Validation & Publishing
1.4. Research Scope and Assumptions
1.4.1. List of Data Sources
Chapter 2. Executive Summary
2.1. Market Outlook
2.2. Segment Outlook
2.3. Competitive Insights
Chapter 3. Wires and Cables Market Variables, Trends, & Scope
3.1. Market Introduction/Lineage Outlook
3.2. Market Dynamics
3.2.1. Market Driver Analysis
3.2.2. Market Restraint Analysis
3.2.3. Industry Challenge
3.3. Wires and Cables Market Analysis Tools
3.3.1. Porter’s Analysis
3.3.2. PESTEL Analysis
Chapter 4. Wires and Cables Market: Voltage Estimates & Trend Analysis
4.1. Segment Dashboard
4.2. Wires and Cables market: Voltage Movement Analysis, USD Billion, 2025 & 2033
4.3. Low Voltage (LV)
4.3.1. Low Voltage (LV) Wires and Cables Market Revenue Estimates and Forecasts, 2021 – 2033 (USD Billion)
4.4. Medium Voltage (MV)
4.4.1. Medium Voltage (MV) Wires and Cables Market Revenue Estimates and Forecasts, 2021 – 2033 (USD Billion)
4.5. High Voltage (HV)
4.5.1. High Voltage (HV) Wires and Cables Market Revenue Estimates and Forecasts, 2021 – 2033 (USD Billion)
4.6. Extra-High Voltage (EHV)
4.6.1. Extra-High Voltage (EHV) Wires and Cables Market Revenue Estimates and Forecasts, 2021 – 2033 (USD Billion)
Chapter 5. Wires and Cables Market: Installation Estimates & Trend Analysis
5.1. Segment Dashboard
5.2. Wires and Cables market: Installation Movement Analysis, USD Billion, 2025 & 2033
5.3. Underground
5.3.1. Underground Wires and Cables Market Revenue Estimates and Forecasts, 2021 – 2033 (USD Billion)
5.4. Overhead
5.4.1. Overhead Wires and Cables Market Revenue Estimates and Forecasts, 2021 – 2033 (USD Billion)
Chapter 6. Wires and Cables Market: End Use Estimates & Trend Analysis
6.1. Segment Dashboard
6.2. Wires and Cables market: End Use Movement Analysis, USD Billion, 2025 & 2033
6.3. Aerospace and Defense
6.3.1. Aerospace and Defense Wires and Cables Market Revenue Estimates and Forecasts, 2021 – 2033 (USD Billion)
6.4. Building & Construction
6.4.1. Building & Construction Wires and Cables Market Revenue Estimates and Forecasts, 2021 – 2033 (USD Billion)
6.5. Oil and Gas
6.5.1. Oil and Gas Wires and Cables Market Revenue Estimates and Forecasts, 2021 – 2033 (USD Billion)
6.6. Energy and Power
6.6.1. Energy and Power Wires and Cables Market Revenue Estimates and Forecasts, 2021 – 2033 (USD Billion)
6.7. IT & Telecommunication
6.7.1. IT & Telecommunication Wires and Cables Market Revenue Estimates and Forecasts, 2021 – 2033 (USD Billion)
6.8. Automotive
6.8.1. Automotive Wires and Cables Market Revenue Estimates and Forecasts, 2021 – 2033 (USD Billion)
6.9. Others
6.9.1. Others Wires and Cables Market Revenue Estimates and Forecasts, 2021 – 2033 (USD Billion)
Chapter 7. Wires and Cables: Regional Estimates & Trend Analysis
7.1. Wires and Cables Share, By Region, 2025 & 2033 USD Billion
7.2. North America
7.2.1. North America Wires and Cables Estimates and Forecasts, 2025 – 2033 (USD Billion)
7.2.1.1. North America Wires and Cables Estimates and Forecasts, by Country, 2025 – 2033 (USD Billion)
7.2.1.2. North America Wires and Cables Estimates and Forecasts, by Voltage, 2025 – 2033 (USD Billion)
7.2.1.3. North America Wires and Cables Estimates and Forecasts, by Installation, 2025 – 2033 (USD Billion)
7.2.1.4. North America Wires and Cables Estimates and Forecasts, by End Use, 2025 – 2033 (USD Billion)
7.2.2. U.S.
7.2.2.1. U.S. Wires and Cables Estimates and Forecasts, by Voltage, 2025 – 2033 (USD Billion)
7.2.2.2. U.S. Wires and Cables Estimates and Forecasts, by Installation, 2025 – 2033 (USD Billion)
7.2.2.3. U.S. Wires and Cables Estimates and Forecasts, by End Use, 2025 – 2033 (USD Billion)
7.2.3. Canada
7.2.3.1. Canada Wires and Cables Estimates and Forecasts, by Voltage, 2025 – 2033 (USD Billion)
7.2.3.2. Canada Wires and Cables Estimates and Forecasts, by Installation, 2025 – 2033 (USD Billion)
7.2.3.3. Canada Wires and Cables Estimates and Forecasts, by End Use, 2025 – 2033 (USD Billion)
7.2.4. Mexico
7.2.4.1. Mexico Wires and Cables Estimates and Forecasts, by Voltage, 2025 – 2033 (USD Billion)
7.2.4.2. Mexico Wires and Cables Estimates and Forecasts, by Installation, 2025 – 2033 (USD Billion)
7.2.4.3. Mexico Wires and Cables Estimates and Forecasts, by End Use, 2025 – 2033 (USD Billion)
7.3. Europe
7.3.1. Europe Wires and Cables Estimates and Forecasts, 2025 – 2033 (USD Billion)
7.3.1.1. Europe Wires and Cables Estimates and Forecasts, by Country, 2025 – 2033 (USD Billion)
7.3.1.2. Europe Wires and Cables Estimates and Forecasts, by Voltage, 2025 – 2033 (USD Billion)
7.3.1.3. Europe Wires and Cables Estimates and Forecasts, by Installation, 2025 – 2033 (USD Billion)
7.3.1.4. Europe Wires and Cables Estimates and Forecasts, by End Use, 2025 – 2033 (USD Billion)
7.3.2. UK
7.3.2.1. UK Wires and Cables Estimates and Forecasts, by Voltage, 2025 – 2033 (USD Billion)
7.3.2.2. UK Wires and Cables Estimates and Forecasts, by Installation, 2025 – 2033 (USD Billion)
7.3.2.3. UK Wires and Cables Estimates and Forecasts, by End Use, 2025 – 2033 (USD Billion)
7.3.3. Germany
7.3.3.1. Germany Wires and Cables Estimates and Forecasts, by Voltage, 2025 – 2033 (USD Billion)
7.3.3.2. Germany Wires and Cables Estimates and Forecasts, by Installation, 2025 – 2033 (USD Billion)
7.3.3.3. Germany Wires and Cables Estimates and Forecasts, by End Use, 2025 – 2033 (USD Billion)
7.3.4. France
7.3.4.1. France Wires and Cables Estimates and Forecasts, by Voltage, 2025 – 2033 (USD Billion)
7.3.4.2. France Wires and Cables Estimates and Forecasts, by Installation, 2025 – 2033 (USD Billion)
7.3.4.3. France Wires and Cables Estimates and Forecasts, by End Use, 2025 – 2033 (USD Billion)
7.4. Asia Pacific
7.4.1. Asia Pacific Wires and Cables Estimates and Forecasts, 2025 – 2033 (USD Billion)
7.4.1.1. Asia Pacific Wires and Cables Estimates and Forecasts, by Voltage, 2025 – 2033 (USD Billion)
7.4.1.2. Asia Pacific Wires and Cables Estimates and Forecasts, by Installation, 2025 – 2033 (USD Billion)
7.4.1.3. Asia Pacific Wires and Cables Estimates and Forecasts, by End Use, 2025 – 2033 (USD Billion)
7.4.2. China
7.4.2.1. China Wires and Cables Estimates and Forecasts, by Voltage, 2025 – 2033 (USD Billion)
7.4.2.2. China Wires and Cables Estimates and Forecasts, by Installation, 2025 – 2033 (USD Billion)
7.4.2.3. China Wires and Cables Estimates and Forecasts, by End Use, 2025 – 2033 (USD Billion)
7.4.3. Japan
7.4.3.1. Japan Wires and Cables Estimates and Forecasts, by Voltage, 2025 – 2033 (USD Billion)
7.4.3.2. Japan Wires and Cables Estimates and Forecasts, by Installation, 2025 – 2033 (USD Billion)
7.4.3.3. Japan Wires and Cables Estimates and Forecasts, by End Use, 2025 – 2033 (USD Billion)
7.4.4. India
7.4.4.1. India Wires and Cables Estimates and Forecasts, by Voltage, 2025 – 2033 (USD Billion)
7.4.4.2. India Wires and Cables Estimates and Forecasts, by Installation, 2025 – 2033 (USD Billion)
7.4.4.3. India Wires and Cables Estimates and Forecasts, by End Use, 2025 – 2033 (USD Billion)
7.4.5. South Korea
7.4.5.1. South Korea Wires and Cables Estimates and Forecasts, by Voltage, 2025 – 2033 (USD Billion)
7.4.5.2. South Korea Wires and Cables Estimates and Forecasts, by Installation, 2025 – 2033 (USD Billion)
7.4.5.3. South Korea Wires and Cables Estimates and Forecasts, by End Use, 2025 – 2033 (USD Billion)
7.4.6. Australia
7.4.6.1. Australia Wires and Cables Estimates and Forecasts, by Voltage, 2025 – 2033 (USD Billion)
7.4.6.2. Australia Wires and Cables Estimates and Forecasts, by Installation, 2025 – 2033 (USD Billion)
7.4.6.3. Australia Wires and Cables Estimates and Forecasts, by End Use, 2025 – 2033 (USD Billion)
7.5. Latin America
7.5.1. Latin America Wires and Cables Estimates and Forecasts, 2025 – 2033 (USD Billion)
7.5.1.1. Latin America Wires and Cables Estimates and Forecasts, by Country, 2025 – 2033 (USD Billion)
7.5.1.2. Latin America Wires and Cables Estimates and Forecasts, by Voltage, 2025 – 2033 (USD Billion)
7.5.1.3. Latin America Wires and Cables Estimates and Forecasts, by Installation, 2025 – 2033 (USD Billion)
7.5.1.4. Latin America Wires and Cables Estimates and Forecasts, by End Use, 2025 – 2033 (USD Billion)
7.5.2. Brazil
7.5.2.1. Brazil Wires and Cables Estimates and Forecasts, by Voltage, 2025 – 2033 (USD Billion)
7.5.2.2. Brazil Wires and Cables Estimates and Forecasts, by Installation, 2025 – 2033 (USD Billion)
7.5.2.3. Brazil Wires and Cables Estimates and Forecasts, by End Use, 2025 – 2033 (USD Billion)
7.6. Middle East and Africa
7.6.1. Middle East and Africa Wires and Cables Estimates and Forecasts, 2025 – 2033 (USD Billion)
7.6.1.1. Middle East and Africa Wires and Cables Estimates and Forecasts, by Voltage, 2025 – 2033 (USD Billion)
7.6.1.2. Middle East and Africa Wires and Cables Estimates and Forecasts, by Installation, 2025 – 2033 (USD Billion)
7.6.1.3. Middle East and Africa Wires and Cables Estimates and Forecasts, by End Use, 2025 – 2033 (USD Billion)
7.6.2. UAE
7.6.2.1. UAE Wires and Cables Estimates and Forecasts, by Voltage, 2025 – 2033 (USD Billion)
7.6.2.2. UAE Wires and Cables Estimates and Forecasts, by Installation, 2025 – 2033 (USD Billion)
7.6.2.3. UAE Wires and Cables Estimates and Forecasts, by End Use, 2025 – 2033 (USD Billion)
7.6.3. KSA
7.6.3.1. KSA Wires and Cables Estimates and Forecasts, by Voltage, 2025 – 2033 (USD Billion)
7.6.3.2. KSA Wires and Cables Estimates and Forecasts, by Installation, 2025 – 2033 (USD Billion)
7.6.3.3. KSA Wires and Cables Estimates and Forecasts, by End Use, 2025 – 2033 (USD Billion)
7.6.4. South Africa
7.6.4.1. South Africa Wires and Cables Estimates and Forecasts, by Voltage, 2025 – 2033 (USD Billion)
7.6.4.2. South Africa Wires and Cables Estimates and Forecasts, by Installation, 2025 – 2033 (USD Billion)
7.6.4.3. South Africa Wires and Cables Estimates and Forecasts, by End Use, 2025 – 2033 (USD Billion)
Chapter 8. Competitive Landscape
8.1. Company Categorization
8.2. Company Market Positioning
8.3. Participant’s Overview
8.4. Financial Performance
8.5. Installation Benchmarking
8.6. Company Heat Map Analysis
8.7. Strategy Mapping
8.8. Company Profiles/Listing
8.8.1. American Wire Group
8.8.1.1. Participant’s Overview
8.8.1.2. Financial Performance
8.8.1.3. Installation Benchmarking
8.8.1.4. Recent Developments
8.8.2. Amphenol TPC.
8.8.2.1. Participant’s Overview
8.8.2.2. Financial Performance
8.8.2.3. Installation Benchmarking
8.8.2.4. Recent Developments
8.8.3. Belden Inc.
8.8.3.1. Participant’s Overview
8.8.3.2. Financial Performance
8.8.3.3. Installation Benchmarking
8.8.3.4. Recent Developments
8.8.4. Encore Wire Corporation
8.8.4.1. Participant’s Overview
8.8.4.2. Financial Performance
8.8.4.3. Installation Benchmarking
8.8.4.4. Recent Developments
8.8.5. Finolex Cables.
8.8.5.1. Participant’s Overview
8.8.5.2. Financial Performance
8.8.5.3. Installation Benchmarking
8.8.5.4. Recent Developments
8.8.6. Fujikura Ltd.
8.8.6.1. Participant’s Overview
8.8.6.2. Financial Performance
8.8.6.3. Installation Benchmarking
8.8.6.4. Recent Developments
8.8.7. Furukawa Electric Co., Ltd.
8.8.7.1. Participant’s Overview
8.8.7.2. Financial Performance
8.8.7.3. Installation Benchmarking
8.8.7.4. Recent Developments
8.8.8. KEI Industries Limited.
8.8.8.1. Participant’s Overview
8.8.8.2. Financial Performance
8.8.8.3. Installation Benchmarking
8.8.8.4. Recent Developments
8.8.9. LEONI AG
8.8.9.1. Participant’s Overview
8.8.9.2. Financial Performance
8.8.9.3. Installation Benchmarking
8.8.9.4. Recent Developments
8.8.10. LS Cable & System Ltd.
8.8.10.1. Participant’s Overview
8.8.10.2. Financial Performance
8.8.10.3. Installation Benchmarking
8.8.10.4. Recent Developments
8.8.11. Nexans
8.8.11.1. Participant’s Overview
8.8.11.2. Financial Performance
8.8.11.3. Installation Benchmarking
8.8.11.4. Recent Developments
8.8.12. NKT A/S
8.8.12.1. Participant’s Overview
8.8.12.2. Financial Performance
8.8.12.3. Installation Benchmarking
8.8.12.4. Recent Developments
8.8.13. Prysmian S.p. A
8.8.13.1. Participant’s Overview
8.8.13.2. Financial Performance
8.8.13.3. Installation Benchmarking
8.8.13.4. Recent Developments
8.8.14. Sumitomo Corporation
8.8.14.1. Participant’s Overview
8.8.14.2. Financial Performance
8.8.14.3. Installation Benchmarking
8.8.14.4. Recent Developments
8.8.15. Southwire Company, LLC
8.8.15.1. Participant’s Overview
8.8.15.2. Financial Performance
8.8.15.3. Installation Benchmarking
8.8.15.4. Recent Developments
List of Tables
Table 1 Global Wires and Cables estimates and forecasts, by region, 2021 – 2033 (USD Billion)
Table 2 Global Wires and Cables Market estimates and Forecast by Voltage, 2021 – 2033 (USD Billion)
Table 3 Global Wires and Cables Market estimates and Forecast by Installation, 2021 – 2033 (USD Billion)
Table 4 Global Wires and Cables Market estimates and Forecast by End Use, 2021 – 2033 (USD Billion)
Table 5 North America Wires and Cables Market estimates and Forecast, 2021 – 2033 (USD Billion)
Table 6 North America Wires and Cables Market estimates and Forecast, by Voltage, 2021 – 2033 (USD Billion)
Table 7 North America Wires and Cables Market estimates and Forecast, by Installation, 2021 – 2033 (USD Billion)
Table 8 North America Wires and Cables Market estimates and Forecast, by End Use, 2021 – 2033 (USD Billion)
Table 9 U.S. Wires and Cables Market estimates and Forecast, 2021 – 2033 (USD Billion)
Table 10 U.S. Wires and Cables Market estimates and Forecast, by Voltage, 2021 – 2033 (USD Billion)
Table 11 U.S. Wires and Cables Market estimates and Forecast, by Installation, 2021 – 2033 (USD Billion)
Table 12 U.S. Wires and Cables Market estimates and Forecast, by End Use, 2021 – 2033 (USD Billion)
Table 13 Canada Wires and Cables Market estimates and Forecast, 2021 – 2033 (USD Billion)
Table 14 Canada Wires and Cables Market estimates and Forecast, by Voltage, 2021 – 2033 (USD Billion)
Table 15 Canada Wires and Cables Market estimates and Forecast, by Installation, 2021 – 2033 (USD Billion)
Table 16 Canada Wires and Cables Market estimates and Forecast, by End Use, 2021 – 2033 (USD Billion)
Table 17 Mexico Wires and Cables Market estimates and Forecast, 2021 – 2033 (USD Billion)
Table 18 Mexico Wires and Cables Market estimates and Forecast, by Voltage, 2021 – 2033 (USD Billion)
Table 19 Mexico Wires and Cables Market estimates and Forecast, by Installation, 2021 – 2033 (USD Billion)
Table 20 Mexico Wires and Cables Market estimates and Forecast, by End Use, 2021 – 2033 (USD Billion)
Table 21 Europe Wires and Cables Market estimates and Forecast, 2021 – 2033 (USD Billion)
Table 22 Europe Wires and Cables Market estimates and Forecast, by Voltage, 2021 – 2033 (USD Billion)
Table 23 Europe Wires and Cables Market estimates and Forecast, by Installation, 2021 – 2033 (USD Billion)
Table 24 Europe Wires and Cables Market estimates and Forecast, by End Use, 2021 – 2033 (USD Billion)
Table 25 UK Wires and Cables Market estimates and Forecast, 2021 – 2033 (USD Billion)
Table 26 UK Wires and Cables Market estimates and Forecast, by Voltage, 2021 – 2033 (USD Billion)
Table 27 UK Wires and Cables Market estimates and Forecast, by Installation, 2021 – 2033 (USD Billion)
Table 28 UK Wires and Cables Market estimates and Forecast, by End Use, 2021 – 2033 (USD Billion)
Table 29 Germany Wires and Cables Market estimates and Forecast, 2021 – 2033 (USD Billion)
Table 30 Germany Wires and Cables Market estimates and Forecast, by Voltage, 2021 – 2033 (USD Billion)
Table 31 Germany Wires and Cables Market estimates and Forecast, by Installation, 2021 – 2033 (USD Billion)
Table 32 Germany Wires and Cables Market estimates and Forecast, by End Use, 2021 – 2033 (USD Billion)
Table 33 France Wires and Cables Market estimates and Forecast, 2021 – 2033 (USD Billion)
Table 34 France Wires and Cables Market estimates and Forecast, by Voltage, 2021 – 2033 (USD Billion)
Table 35 France Wires and Cables Market estimates and Forecast, by Installation, 2021 – 2033 (USD Billion)
Table 36 France Wires and Cables Market estimates and Forecast, by End Use, 2021 – 2033 (USD Billion)
Table 37 Asia Pacific Wires and Cables Market estimates and Forecast, 2021 – 2033 (USD Billion)
Table 38 Asia Pacific Wires and Cables Market estimates and Forecast, by Voltage, 2021 – 2033 (USD Billion)
Table 39 Asia Pacific Wires and Cables Market estimates and Forecast, by Installation, 2021 – 2033 (USD Billion)
Table 40 Asia Pacific Wires and Cables Market estimates and Forecast, by End Use, 2021 – 2033 (USD Billion)
Table 41 China Wires and Cables Market estimates and Forecast, 2021 – 2033 (USD Billion)
Table 42 China Wires and Cables Market estimates and Forecast, by Voltage, 2021 – 2033 (USD Billion)
Table 43 China Wires and Cables Market estimates and Forecast, by Installation, 2021 – 2033 (USD Billion)
Table 44 China Wires and Cables Market estimates and Forecast, by End Use, 2021 – 2033 (USD Billion)
Table 45 Japan Wires and Cables Market estimates and Forecast, 2021 – 2033 (USD Billion)
Table 46 Japan Wires and Cables Market estimates and Forecast, by Voltage, 2021 – 2033 (USD Billion)
Table 47 Japan Wires and Cables Market estimates and Forecast, by Installation, 2021 – 2033 (USD Billion)
Table 48 Japan Wires and Cables Market estimates and Forecast, by End Use, 2021 – 2033 (USD Billion)
Table 49 India Wires and Cables Market estimates and Forecast, 2021 – 2033 (USD Billion)
Table 50 India Wires and Cables Market estimates and Forecast, by Voltage, 2021 – 2033 (USD Billion)
Table 51 India Wires and Cables Market estimates and Forecast, by Installation, 2021 – 2033 (USD Billion)
Table 52 India Wires and Cables Market estimates and Forecast, by End Use, 2021 – 2033 (USD Billion)
Table 53 South Korea Wires and Cables Market estimates and Forecast, 2021 – 2033 (USD Billion)
Table 54 South Korea Wires and Cables Market estimates and Forecast, by Voltage, 2021 – 2033 (USD Billion)
Table 55 South Korea Wires and Cables Market estimates and Forecast, by Installation, 2021 – 2033 (USD Billion)
Table 56 South Korea Wires and Cables Market estimates and Forecast, by End Use, 2021 – 2033 (USD Billion)
Table 57 Australia Wires and Cables Market estimates and Forecast, 2021 – 2033 (USD Billion)
Table 58 Australia Wires and Cables Market estimates and Forecast, by Voltage, 2021 – 2033 (USD Billion)
Table 59 Australia Wires and Cables Market estimates and Forecast, by Installation, 2021 – 2033 (USD Billion)
Table 60 Australia Wires and Cables Market estimates and Forecast, by End Use, 2021 – 2033 (USD Billion)
Table 61 Latin America Wires and Cables Market estimates and Forecast, 2021 – 2033 (USD Billion)
Table 62 Latin America Wires and Cables Market estimates and Forecast, by Voltage, 2021 – 2033 (USD Billion)
Table 63 Latin America Wires and Cables Market estimates and Forecast, by Installation, 2021 – 2033 (USD Billion)
Table 64 Latin America Wires and Cables Market estimates and Forecast, by End Use, 2021 – 2033 (USD Billion)
Table 65 Brazil Wires and Cables Market estimates and Forecast, 2021 – 2033 (USD Billion)
Table 66 Brazil Wires and Cables Market estimates and Forecast, by Voltage, 2021 – 2033 (USD Billion)
Table 67 Brazil Wires and Cables Market estimates and Forecast, by Installation, 2021 – 2033 (USD Billion)
Table 68 Brazil Wires and Cables Market estimates and Forecast, by End Use, 2021 – 2033 (USD Billion)
Table 69 MEA Wires and Cables Market estimates and Forecast, 2021 – 2033 (USD Billion)
Table 70 MEA Wires and Cables Market estimates and Forecast, by Voltage, 2021 – 2033 (USD Billion)
Table 71 MEA Wires and Cables Market estimates and Forecast, by Installation, 2021 – 2033 (USD Billion)
Table 72 MEA Wires and Cables Market estimates and Forecast, by End Use, 2021 – 2033 (USD Billion)
Table 73 KSA Wires and Cables Market estimates and Forecast, 2021 – 2033 (USD Billion)
Table 74 KSA Wires and Cables Market estimates and Forecast, by Voltage, 2021 – 2033 (USD Billion)
Table 75 KSA Wires and Cables Market estimates and Forecast, by Installation, 2021 – 2033 (USD Billion)
Table 76 KSA Wires and Cables Market estimates and Forecast, by End Use, 2021 – 2033 (USD Billion)
Table 77 UAE Wires and Cables Market estimates and Forecast, 2021 – 2033 (USD Billion)
Table 78 UAE Wires and Cables Market estimates and Forecast, by Voltage, 2021 – 2033 (USD Billion)
Table 79 UAE Wires and Cables Market estimates and Forecast, by Installation, 2021 – 2033 (USD Billion)
Table 80 UAE Wires and Cables Market estimates and Forecast, by End Use, 2021 – 2033 (USD Billion)
Table 81 South Africa Wires and Cables Market estimates and Forecast, 2021 – 2033 (USD Billion)
Table 82 South Africa Wires and Cables Market estimates and Forecast, by Voltage, 2021 – 2033 (USD Billion)
Table 83 South Africa Wires and Cables Market estimates and Forecast, by Installation, 2021 – 2033 (USD Billion)
Table 84 South Africa Wires and Cables Market estimates and Forecast, by End Use, 2021 – 2033 (USD Billion)
List of Figures
Fig. 1 Wires and Cables Market segmentation
Fig. 2 Market research voltage
Fig. 3 Information procurement
Fig. 4 Primary research pattern
Fig. 5 Market research approaches
Fig. 6 Market formulation & validation
Fig. 7 Wires and Cables Market snapshot
Fig. 8 Wires and Cables Market segment snapshot
Fig. 9 Wires and Cables Market competitive landscape snapshot
Fig. 10 Market driver impact analysis
Fig. 11 Market restraint impact analysis
Fig. 12 Wires and Cables Market: Voltage outlook key takeaways (USD Billion)
Fig. 13 Wires and Cables Market: Voltage movement analysis (USD Billion), 2025 & 2033
Fig. 14 Low Voltage (LV) Market Revenue estimates and forecasts, 2021 – 2033 (USD Billion)
Fig. 15 Medium Voltage (MV) Market Revenue estimates and forecasts, 2021 – 2033 (USD Billion)
Fig. 16 High Voltage (HV) Market Revenue estimates and forecasts, 2021 – 2033 (USD Billion)
Fig. 17 Extra-High Voltage (EHV) Market Revenue estimates and forecasts, 2021 – 2033 (USD Billion)
Fig. 18 Wires and Cables Market: Installation outlook key takeaways (USD Billion)
Fig. 19 Wires and Cables Market: Installation movement analysis (USD Billion), 2025 & 2033
Fig. 20 Underground Market Revenue estimates and forecasts, 2021 – 2033 (USD Billion)
Fig. 21 Overhead Market Revenue estimates and forecasts, 2021 – 2033 (USD Billion)
Fig. 22 Wires and Cables Market: End Use outlook key takeaways (USD Billion)
Fig. 23 Wires and Cables Market: End Use movement analysis (USD Billion), 2025 & 2033
Fig. 24 Aerospace and Defense market revenue estimates and forecasts, 2021 – 2033 (USD Billion)
Fig. 25 Energy and Power market revenue estimates and forecasts, 2021 – 2033 (USD Billion)
Fig. 26 Oil and Gas market revenue estimates and forecasts, 2021 – 2033 (USD Billion)
Fig. 27 Building & Construction market revenue estimates and forecasts, 2021 – 2033 (USD Billion)
Fig. 28 IT & Telecommunication market revenue estimates and forecasts, 2021 – 2033 (USD Billion)
Fig. 29 Automotive market revenue estimates and forecasts, 2021 – 2033 (USD Billion)
Fig. 30 Others market revenue estimates and forecasts, 2021 – 2033 (USD Billion)
Fig. 31 Regional Marketplace: Key takeaways
Fig. 32 Wires and Cables Market: Regional outlook, 2025 & 2033, USD Billion
Fig. 33 North America Wires and Cables Market estimates and forecasts, 2021 – 2033 (USD Billion)
Fig. 34 U.S. Wires and Cables Market estimates and forecasts, 2021 – 2033 (USD Billion)
Fig. 35 Canada Wires and Cables Market estimates and forecasts, 2021 – 2033 (USD Billion)
Fig. 36 Mexico Wires and Cables Market estimates and forecasts, 2021 – 2033 (USD Billion)
Fig. 37 Europe Wires and Cables Market estimates and forecasts, 2021 – 2033 (USD Billion)
Fig. 38 UK Wires and Cables Market estimates and forecasts, 2021 – 2033 (USD Billion)
Fig. 39 Germany Wires and Cables Market estimates and forecasts, 2021 – 2033 (USD Billion)
Fig. 40 France Wires and Cables Market estimates and forecasts, 2021 – 2033 (USD Billion)
Fig. 41 Asia Pacific Wires and Cables Market estimates and forecasts, 2021 – 2033 (USD Billion)
Fig. 42 China Wires and Cables Market estimates and forecasts, 2021 – 2033 (USD Billion)
Fig. 43 Japan Wires and Cables Market estimates and forecasts, 2021 – 2033 (USD Billion)
Fig. 44 India Wires and Cables Market estimates and forecasts, 2021 – 2033 (USD Billion)
Fig. 45 South Korea Wires and Cables Market estimates and forecasts, 2021 – 2033 (USD Billion)
Fig. 46 Australia Wires and Cables Market estimates and forecasts, 2021 – 2033 (USD Billion)
Fig. 47 Latin America Wires and Cables Market estimates and forecasts, 2021 – 2033 (USD Billion)
Fig. 48 Brazil Wires and Cables Market estimates and forecasts, 2021 – 2033 (USD Billion)
Fig. 49 MEA Wires and Cables Market estimates and forecasts, 2021 – 2033 (USD Billion)
Fig. 50 KSA Wires and Cables Market estimates and forecasts, 2021 – 2033 (USD Billion)
Fig. 51 UAE Wires and Cables Market estimates and forecasts, 2021 – 2033 (USD Billion)
Fig. 52 South Africa Wires and Cables Market estimates and forecasts, 2021 – 2033 (USD Billion)
Fig. 53 Company Categorization
Fig. 54 Company Market Positioning
Fig. 55 Strategy framework